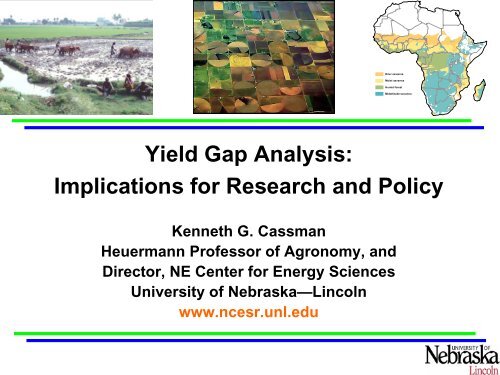
Yield Gap Analysis: Implications for Research and Policy
Yield Gap Analysis: Implications for Research and Policy
Yield Gap Analysis: Implications for Research and Policy

Create successful ePaper yourself
Turn your PDF publications into a flip-book with our unique Google optimized e-Paper software.
<strong>Yield</strong> <strong>Gap</strong> <strong>Analysis</strong>:<br />
<strong>Implications</strong> <strong>for</strong> <strong>Research</strong> <strong>and</strong> <strong>Policy</strong><br />
Kenneth G. Cassman<br />
Heuermann Professor of Agronomy, <strong>and</strong><br />
Director, NE Center <strong>for</strong> Energy Sciences<br />
University of Nebraska—Lincoln<br />
www.ncesr.unl.edu<br />
Drier savanna<br />
Moist savanna<br />
Humid <strong>for</strong>est<br />
Midaltitude savanna
What do these have in common?<br />
• Ensuring global food security in face of climate<br />
change<br />
• L<strong>and</strong> use <strong>and</strong> indirect l<strong>and</strong> use change<br />
– Impact of climate change on agriculture <strong>and</strong><br />
vica versa<br />
• Competition between food <strong>and</strong> biofuel<br />
• Conservation of natural ecosystems <strong>and</strong><br />
biodiversity<br />
EACH DEPENDS ON RATE OF GAIN IN CROP<br />
YIELDS ON EXISTING FARM LAND
• Will business as usual meet projected<br />
global food dem<strong>and</strong> in 2050?<br />
� Global area <strong>for</strong> cereal crops declining<br />
�48% increase in cereal production<br />
needed by 2050 (40 yr) = 1.2% yr -1 of<br />
current average yield, or…..<br />
�1% annual exponential growth rate<br />
• If business as usual won’t do it, what is<br />
needed to change course?
Grain harvested area (Mha)<br />
800<br />
700<br />
600<br />
500<br />
Global Cereal Area Trends, 1966-2006<br />
Total cereal area<br />
(maize, rice, wheat, sorghum, millet, barley, oats)<br />
1966-1980 1966 1980<br />
+4.6 Mha y-1 1966-1980 1966 1980<br />
+3.9 Mha y-1 400<br />
1960 1970 1980 1990 2000 2010<br />
Year<br />
1981-2006 1981 2006<br />
-1.7 1.7 Mha y-1 maize + rice + wheat area<br />
1981-2006 1981 2006<br />
+0.5 Mha y-1
Urban-industrial expansion onto prime farml<strong>and</strong> at the periphery<br />
of Kunming (+6 million), the capital of Yunnan Province, China,
Grain <strong>Yield</strong> (kg ha -1 )<br />
Global Cereal <strong>Yield</strong> Trends, 1966-2006<br />
5000<br />
4000<br />
3000<br />
2000<br />
1000<br />
+2.8%<br />
Maize <strong>Yield</strong><br />
y = 2260 + 62.5x<br />
r 2 = 0.94<br />
Wheat <strong>Yield</strong><br />
y = 1373 + 40.1x<br />
r 2 = 0.97<br />
1966 1976 1986 1996 2006<br />
Year<br />
Rice <strong>Yield</strong><br />
y = 2097 + 53.5x<br />
r 2 = 0.98<br />
THESE RATES OF INCREASE ARE NOT FAST ENOUGH TO MEET<br />
EXPECTED DEMAND ON EXISTING FARM LAND! source: FAOSTAT<br />
+1.3%
Global Average Maize <strong>Yield</strong> (kg ha -1 )<br />
7500<br />
7000<br />
6500<br />
6000<br />
5500<br />
5000<br />
4500<br />
Tyranny of constant rate of yield gain:<br />
Decreasing relative rate of gain<br />
Global Maize Grain <strong>Yield</strong> kg ha -1<br />
Relative Rate of Gain<br />
2010 2020 2030 2040 2050<br />
1.4<br />
1.3<br />
1.2<br />
1.1<br />
1.0<br />
0.9<br />
0.8<br />
Relative Rate of Gain (% average yield)
IRRIGATED AREA (Mha)<br />
Global Irrigated Area <strong>and</strong> as a % of Total Cultivated<br />
L<strong>and</strong> Area, 1966-2004<br />
300<br />
250<br />
200<br />
150<br />
100<br />
Irrigated Area<br />
1965 1975 1985 1995 2005<br />
YEAR<br />
% of total<br />
cultivated area<br />
Irrigated systems occupied 18% of<br />
cultivated l<strong>and</strong> area but produced<br />
40% of human food supply<br />
20.0<br />
17.5<br />
15.0<br />
12.5<br />
10.0
Decreasing water supply in all major irrigated areas<br />
Yet, irrigated agriculture produces 40% of global food supply<br />
on just 18% of the cropped area.
Corn grain yield (bu ac -1 )<br />
USA Corn <strong>Yield</strong> Trends, 1966-2009<br />
(powerful support from science <strong>and</strong> technology)<br />
180<br />
160<br />
140<br />
120<br />
100<br />
80<br />
linear rate of gain = 1.86 bu ac -1 yr -1<br />
Expansion of irrigated area<br />
double- to<br />
single-cross<br />
hybrids<br />
Improved balance in N,P,K fertilization<br />
Multi-location hybrid testing in<br />
1000s of on-farm strip trials<br />
Increased N fertilizer rates<br />
Conservation tilliage <strong>and</strong> soil testing<br />
60<br />
1960 1970 1980 1990 2000 2010<br />
Year<br />
Electronic<br />
auto-steer<br />
Precision planters<br />
Transgenic (Bt)<br />
insect resistance<br />
Integrated pest management
From NCGA website, 8 May 2008:<br />
http://www.ncga.com/PDFs/NCGA%20Presentation%20on%20Food%20<strong>and</strong>%20Fuel%205-7-08.pdf
Bottom Line on <strong>Yield</strong> Trends<br />
• Expansion of crop area limited by lack of good<br />
quality arable soils <strong>and</strong> concerns about loss of<br />
wildlife habitat <strong>and</strong> biodiversity<br />
– USA conservation reserve l<strong>and</strong><br />
– Rain<strong>for</strong>ests <strong>and</strong> wetl<strong>and</strong>s in Latin America, SE Asia, SSA<br />
• Current rates of gain in crop yields not adequate to<br />
meet expected dem<strong>and</strong> <strong>for</strong> food, feed, fiber, <strong>and</strong> fuel<br />
on existing crop l<strong>and</strong><br />
• Little scope <strong>for</strong> increasing irrigated crop area due to<br />
competition <strong>for</strong> water with other sectors<br />
• Little increase in yield potential of maize or rice <strong>for</strong><br />
the last 30-40 years; yield stagnation in some areas<br />
• Little scope <strong>for</strong> quantum leap in yields from<br />
biotechnology?<br />
• Need <strong>for</strong> ecological intensification (global sense)
Clearing virgin rain <strong>for</strong>est in Brazil
Ecological Intensification<br />
• How close can average farm yields<br />
come to the yield potential ceiling<br />
using crop <strong>and</strong> soil management<br />
practices that conserve natural<br />
resources, protect environmental<br />
quality, give acceptable rate of<br />
economic return?<br />
• Necessary, but not sufficient…..<br />
– food af<strong>for</strong>dability <strong>and</strong> access, markets,<br />
good governance, policies, etc.
N fertilizer rate (kg N ha -1 )<br />
NUE (kg grain kg -1 N fertilizer)<br />
High yields <strong>and</strong> high nitrogen use efficiency (NUE) are possible*<br />
•Based on data from 123 fields farmer’s irrigated fields in 2005-2007 seasons, Nebraska, USA.<br />
Grassini et al., submitted, Field Crops Res.<br />
220<br />
200<br />
180<br />
160<br />
140<br />
90<br />
80<br />
70<br />
60<br />
50<br />
12.7 13.3 kg ha -1<br />
Continuous maize Soybean-maize<br />
U.S. maize averages<br />
13.5 13.4<br />
Continuous maize Soybean-maize<br />
Tillage system:<br />
Conservation (NT): strip-,<br />
ridge-, <strong>and</strong> no-till.<br />
Conventional (CT): disk<br />
• Higher N rates but also higher NUE<br />
compared to U.S. averages,<br />
especially under soybean-corn<br />
rotation due to higher yields <strong>and</strong><br />
lower N rate than continuous corn.<br />
• No difference in N fertilizer rate<br />
under continuous corn with NT or<br />
CT; under soybean-corn rotation, N<br />
fertilizer tended to be higher under<br />
NT than CT.<br />
• NUE tended to be higher under<br />
conventional tillage due to (i) higher<br />
yields at the same N rate under<br />
continuous corn <strong>and</strong> (ii) same yield<br />
with lower N rate under soybeancorn<br />
rotation.
High yields <strong>and</strong> high water use<br />
efficiency are possible: maize in<br />
south-central NE, 2-y means 2005-06<br />
More crop per drop<br />
Treatment <strong>Yield</strong><br />
(t/ha)<br />
Irrigation<br />
(cm)<br />
100% ET 14.9 22.6<br />
Irrigation Efficiency<br />
(t/cm)<br />
0.66<br />
75% ET* 14.7 17.0<br />
0.86<br />
50% ET 12.8 11.4<br />
1.12<br />
Rainfed 5.8 0<br />
--<br />
*75% ET replacement except 10 d be<strong>for</strong>e <strong>and</strong> 7 d after silking
Ecological Intensification<br />
• How close can average farm yields<br />
come to the yield potential ceiling<br />
using crop <strong>and</strong> soil management<br />
practices that conserve natural<br />
resources, protect environmental<br />
quality, give acceptable rate of<br />
economic return?<br />
• Necessary, but not sufficient…..<br />
– food af<strong>for</strong>dability <strong>and</strong> access, markets,<br />
good governance, policies, etc.
<strong>Yield</strong> (Mg ha -1 <strong>Yield</strong> (t ha ) -1 )<br />
7<br />
6<br />
5<br />
4<br />
3<br />
2<br />
1<br />
0<br />
Evidence that average national yields begin to plateau<br />
when they reach 70-80% of yield potential<br />
Rice<br />
R. Korea<br />
Cassman, 1999. PNAS, 96: 5952-5959<br />
China<br />
Indonesia<br />
India<br />
1960 1970 1980 1990 2000 2010<br />
Year<br />
8<br />
7<br />
6<br />
5<br />
4<br />
3<br />
2<br />
1<br />
0<br />
Wheat<br />
Northwest Europe<br />
China<br />
India<br />
1960 1970 1980 1990 2000 2010<br />
Year<br />
Cassman et al, 2003, ARER 28: 315-358<br />
12<br />
10<br />
8<br />
6<br />
4<br />
2<br />
0<br />
Maize<br />
USA - irrigated<br />
China<br />
USA - rainfed<br />
Brazil<br />
1960 1970 1980 1990 2000 2010<br />
Year<br />
Note yield plateaus in Korea <strong>and</strong> China <strong>for</strong> rice, wheat in northwest Europe<br />
<strong>and</strong> India, <strong>and</strong> maize in China <strong>and</strong>……..perhaps <strong>for</strong> irrigated maize in the USA<br />
?
Crop Sci. 50:1882–1890 (2010)<br />
Genetic Improvement in Winter Wheat <strong>Yield</strong>s in the Great Plains of North<br />
America, 1959–2008<br />
Robert A. Graybosch* <strong>and</strong> C. James Peterson<br />
Abstract<br />
……Linear regressions of relative grain yields vs. year over the time period 1984 to<br />
2008, however, showed no statistically significant trend in the SRPN. For the same<br />
time period in the NRPN, a statistically significant positive slope of 0.83 was<br />
observed, though the coefficient of determination (R2) was only 0.28. …….. <strong>and</strong><br />
further improvement in the genetic potential <strong>for</strong> grain yield awaits some new<br />
technological or biological advance.<br />
Field Crops <strong>Research</strong> 119 (2010) 201–212<br />
Why are wheat yields stagnating in Europe? A comprehensive data<br />
analysis <strong>for</strong> France<br />
Nadine Brissona,∗, Philippe Gateb, David Gouacheb, Gilles Charmetc, Francois-<br />
Xavier Ouryc, Frédéric Huarda<br />
Abstract<br />
The last two decades are witnessing a decline in the growth trend of cereal yields in<br />
many European countries. The present study analyses yield trends in France using<br />
various sources of data: national <strong>and</strong> regional statistics, scattered trials, results of<br />
agroclimatic models using climatic data.
What are reasons <strong>for</strong> yield stagnation?<br />
• Secret plot among farmers to limit<br />
production?<br />
• Climate change?<br />
• Unidentified constraints <strong>and</strong>/or lack of<br />
appropriate crop <strong>and</strong> soil management<br />
technologies to take full advantage of solar<br />
radiation <strong>and</strong> water resources?<br />
• Average farm yields are bumping up against<br />
the yield potential (Yp) ceiling (75-85% of Yp)<br />
– Size of exploitable yield gap is too small
<strong>Yield</strong><br />
CO 2<br />
Solar radiation<br />
Temperature<br />
Growth period<br />
Plant density<br />
<strong>Gap</strong> 1<br />
Attainable yield<br />
with available<br />
water supply:<br />
Soil<br />
Rainfall<br />
Irrigation<br />
<strong>Yield</strong> potential Water-limited<br />
yield potential<br />
<strong>Gap</strong> 2<br />
Other limiting<br />
factors:<br />
Nutrients<br />
Weeds<br />
Pests<br />
Others<br />
Actual yield<br />
<strong>Yield</strong> potential <strong>and</strong> yield gaps<br />
Modified from: van Ittersum <strong>and</strong> Rabbinge, 1997
When producing crops near the yield potential ceiling, there is a razorthin<br />
margin <strong>for</strong> error in managing inputs (too much, too little, too early,<br />
too late), <strong>and</strong> also in managing pests because of dynamic interactions<br />
between nutrient status <strong>and</strong> pest incidence <strong>and</strong> severity
Interactions between plant<br />
nutrient status <strong>and</strong> disease<br />
become more prominent at<br />
high yield levels:<br />
For many crops, there is often<br />
a positive relationship between<br />
leaf N concentration <strong>and</strong> the<br />
prevalence <strong>and</strong> severity of<br />
several foliar diseases. In this<br />
case, sheath blight on rice in<br />
Vietnam. Hence, a critical<br />
need to precisely balance N<br />
supply with crop dem<strong>and</strong><br />
without excess or deficiency.
<strong>Yield</strong><br />
75-85% Yp<br />
CO 2<br />
Solar radiation<br />
Temperature<br />
Growth period<br />
Plant density<br />
<strong>Gap</strong> 1<br />
70-80% Yp-r<br />
Attainable yield<br />
with available<br />
water supply:<br />
Soil<br />
Rainfall<br />
Irrigation<br />
<strong>Yield</strong> potential Water-limited<br />
yield potential<br />
<strong>Gap</strong> 2<br />
Other limiting<br />
factors:<br />
Nutrients<br />
Weeds<br />
Pests<br />
Others<br />
Actual yield<br />
<strong>Yield</strong> potential <strong>and</strong> yield gaps
Developing a transparent, robust,<br />
reproducible protocol to estimate<br />
crop yield potential (Yp) in a given<br />
field, region, state, or nation<br />
PhD. Project---Justin van Wart
Rainfed Maize area <strong>and</strong> NOAA weather stations with +20 yr data<br />
(daily Tmax/Tmin, rainfall, dewpoint, wind speed)
Rank of NOAA weather stations by density of harvested rainfed maize area
Select reference weather stations (RWS) with greatest maize area density<br />
within 100-km buffers, with minimum overlap, until >50% of U.S maize area<br />
is covered. Weight Yp estimates <strong>for</strong> each RWS buffer by maize area<br />
density to estimate national Yp.<br />
Total area within buffers<br />
account <strong>for</strong> 52% of USA<br />
RF maize production
Appropriate crop simulation model<br />
(validated against yields that approach Yp)
Complicated systems: Maize, rice, wheat in China<br />
Source: Monfreda et al, 2008
NOAA weather stations with +20 yrs data: daily Tmax,<br />
Tmin, precip, dewpoint, wind speed <strong>and</strong> harvested rice<br />
area density in China
Intensive lowl<strong>and</strong> rice systems in Asia<br />
Central Luzon<br />
Philippines<br />
Mekong Delta<br />
Vietnam<br />
West Java<br />
Indonesia<br />
Cauvery Delta<br />
South India<br />
Southern<br />
China<br />
Indo-Gangetic<br />
Plain & SC China<br />
Red River D.<br />
Vietnam<br />
Central Java<br />
Indonesia<br />
Rice-Rice<br />
Rice-Rice-<br />
Rice<br />
Rice-Rice<br />
Rice-Rice-<br />
Pulses<br />
Rice-Rice<br />
(hybrid)<br />
Rice-Rice-<br />
Maize<br />
DS rice WS rice<br />
DS rice WS rice<br />
WS rice DS rice<br />
Pulses WS rice DS rice<br />
Early-rice Late-rice<br />
Rice-Wheat Wheat<br />
WS rice<br />
Rice-Rice-<br />
Maize<br />
WS rice<br />
Spring-rice Summer-rice Maize<br />
Rice Maize Rice<br />
J F M A M J J A S O N D<br />
Month
Major rice cropping systems in China: 17 provinces, 44 systems (94% of total rice area)<br />
Province Cropping season Crop establish Seeding rate* Hills per m2 Seeding date Transplanting date Flowering date Maturity date Area (ha) Variety match<br />
Hubei Early season Transplanting 25 266,667 IR72<br />
Middle season<br />
Direct seeding<br />
Transplanting<br />
45 (H), 90 (I)<br />
21<br />
266,667<br />
533,333<br />
IR72<br />
2You725<br />
Direct seeding 45 (H), 90 (I) 800,000 2You725<br />
Hunan<br />
Late season<br />
Early season<br />
Transplanting<br />
Transplanting<br />
22.5<br />
25<br />
200,000<br />
1,133,333<br />
IR72<br />
IR72<br />
Direct seeding 30 (H), 60 (I) 466,667 IR72<br />
Middle season<br />
Single late season<br />
Transplanting<br />
Transplanting<br />
22.5<br />
18.4<br />
500,000<br />
366,667<br />
2You725<br />
2You725<br />
Double late season Transplanting 18.4 1,600,000 IR72<br />
Anhui Early season Transplanting 37.5 80,000 IR72<br />
Direct seeding 75 (I) 186,667 IR72<br />
Middle season Transplanting 22.5 1,466,667 2You501<br />
Direct seeding 45 (I) 200,000 2You501<br />
Late season Transplanting 37.5 300,000 IR72<br />
Jiangxi Early season Transplanting 30 1,333,333 IR72<br />
Direct seeding 37.5 (H), 60 (I) 133,333 IR72<br />
Middle season Transplanting 27 333,333 2You501<br />
Late season Transplanting 27 1,400,000 IR72<br />
Guangdong Early season Transplanting 22.5 1,000,000 IR72<br />
Late season Transplanting 22.5 1,000,000 IR72<br />
Sichuan Single season Transplanting 16 2,666,667 2You501<br />
Guangxi Early season Transplanting 30 1,000,000 IR72<br />
Middle season Transplanting 28.5 133,333 2You501<br />
Late season Transplanting 27 1,000,000 IR72<br />
Fujian Early season Transplanting 22.5 233,333 IR72<br />
Middle season Transplanting 18 533,333 IR72<br />
Late season Transplanting 19.5 233,333 IR72<br />
Jiangsu Single season Transplanting 25.5 1,200,000 Wuxiangjing 9<br />
Direct seeding 60 (I) 800,000 Wuxiangjing 9<br />
Jilin Single season Transplanting 22.5 733,333 Jin Dao 305<br />
Heilongjiang<br />
Liaoning<br />
Single season<br />
Single season<br />
Transplanting<br />
Transplanting<br />
24<br />
22.5<br />
2,600,000<br />
666,667<br />
Jin Dao 305<br />
Jin Dao 305<br />
Henan Single season Transplanting 20.5 633,333 XD90247<br />
Zhejiang Early season Transplanting 30 93,333 IR72<br />
Direct seeding 75 (I) 40,000 IR72<br />
Middle season Transplanting 20 333,333 Wuxiangjing 9<br />
Direct seeding 52.5 (I) 333,333 Wuxiangjing 9<br />
Yunan<br />
Late season<br />
Single season (japonica)<br />
Transplanting<br />
Transplanting<br />
22.5<br />
55.5<br />
200,000<br />
600,000<br />
IR72<br />
Jin Dao 305<br />
Single season (indica) Transplanting 55.5 333,333 2You501<br />
Upl<strong>and</strong> rice Direct seeding 75 (I) 100,000 HD297<br />
Guizhou Single season Transplanting 15 733,333 2You725<br />
Hainan Early season Transplanting 33 166,667 IR72<br />
Late season Transplanting 33<br />
*kg/ha, H=hybrid <strong>and</strong> I=inbred<br />
213,333<br />
29,146,667<br />
IR72<br />
Simulate rice Yp <strong>for</strong> each of these systems
Selected reference weather stations (RWS) <strong>and</strong> 100-km buffer<br />
zones over geospatial distribution of harvested rice area.<br />
Selected buffer zones account <strong>for</strong> 50% of total rice area in<br />
China. Simulation with ORYZA2000,<br />
Once selected, each RWS database undergoes rigorous Q/A vetting <strong>and</strong> gap<br />
filling <strong>for</strong> missing data, then used in simulation model to estimate Yp
Wheat area density (green) <strong>and</strong> reference weather stations with<br />
100 km buffers in Germany covering 74% of total harvested area<br />
Collaboration with:<br />
Kurt Christian Kersebaum<br />
Inst. of L<strong>and</strong>scape Systems<br />
<strong>Analysis</strong>, Muncheberg, Germany
Production-weighted yield potential (Yp) estimates based on current<br />
crop management compared to average national yield (Ya), <strong>and</strong><br />
coverage of crop area included in Yp estimates.<br />
Country Crop Total<br />
harvested<br />
area, Mha<br />
China<br />
USA<br />
USA<br />
Irrigated<br />
rice<br />
Rainfed<br />
maize<br />
Irrigated<br />
maize<br />
Germany Rainfed<br />
wheat<br />
% of total<br />
area in Yp<br />
estimate<br />
Ya †<br />
(year)<br />
Yp<br />
6.6<br />
29.5 50%<br />
8.8 75%<br />
(2008)<br />
28.7<br />
3.6<br />
3.2<br />
52%<br />
60%<br />
10.1<br />
(2009)<br />
12.4<br />
(2009)<br />
13.2<br />
15.1<br />
8.1<br />
74% 9.5<br />
(2008)<br />
† US data from USDA NASS, 2009; China rice <strong>and</strong> German wheat data from FAO, 2008.<br />
Ya/Yp<br />
(%)<br />
77%<br />
82%<br />
85%
How high can average farm yields go?<br />
• Best current estimate:<br />
– 75-85% <strong>for</strong> irrigated crops<br />
– 70-80% <strong>for</strong> rainfed crops<br />
• Actual threshold depends on:<br />
– Relative prices <strong>for</strong> outputs versus inputs<br />
– Crop sensitivity to lodging, diseases <strong>and</strong><br />
insect pests, other stresses at high yield<br />
levels, <strong>and</strong> probability of intense storms<br />
• Rice more sensitive than maize (lower ceiling)<br />
• Wheat varies: southern (India) > northern<br />
(northern Europe)
Conclusions<br />
• Crop yield potential (Yp) can be estimated<br />
using methods that are transparent, robust,<br />
<strong>and</strong> reproducible based on weather data,<br />
geospatial distribution of crop area, current<br />
crop management (plant date <strong>and</strong> maturity,<br />
plant population) <strong>and</strong> appropriate crop models<br />
• Average farm yields begin to stagnate when<br />
they reach 70-85% of Yp<br />
• <strong>Yield</strong> gap analysis depends on accurate<br />
estimate of Yp
Need <strong>for</strong> <strong>Yield</strong> Potential--<strong>Yield</strong> <strong>Gap</strong> Atlas<br />
• Interpret historical yield trends <strong>and</strong> yield<br />
plateaus (predict yield plateaus?)<br />
• Prioritize research to ensure global food<br />
security in the face of climate change<br />
– Identify areas with largest unexploited yield gaps,<br />
identify constraints, close yield gaps through<br />
ecological intensification<br />
• Estimate agricultural l<strong>and</strong> requirements <strong>and</strong><br />
indirect l<strong>and</strong> use change (<strong>and</strong> associated<br />
GHG emissions) as influenced by policies<br />
– e.g. competition between food <strong>and</strong> biofuel