Comparison of RAPDs, AFLPs and SSR markers for the genetic ...
Comparison of RAPDs, AFLPs and SSR markers for the genetic ...
Comparison of RAPDs, AFLPs and SSR markers for the genetic ...

Create successful ePaper yourself
Turn your PDF publications into a flip-book with our unique Google optimized e-Paper software.
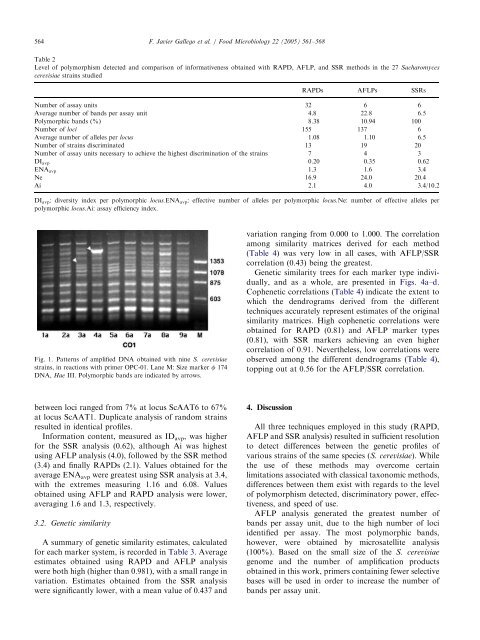
564<br />
Fig. 1. Patterns <strong>of</strong> amplified DNA obtained with nine S. cerevisiae<br />
strains,in reactions with primer OPC-01. Lane M: Size marker f 174<br />
DNA, Hae III. Polymorphic b<strong>and</strong>s are indicated by arrows.<br />
between loci ranged from 7% at locus ScAAT6 to 67%<br />
at locus ScAAT1. Duplicate analysis <strong>of</strong> r<strong>and</strong>om strains<br />
resulted in identical pr<strong>of</strong>iles.<br />
In<strong>for</strong>mation content,measured as IDavp,was higher<br />
<strong>for</strong> <strong>the</strong> <strong>SSR</strong> analysis (0.62),although Ai was highest<br />
using AFLP analysis (4.0),followed by <strong>the</strong> <strong>SSR</strong> method<br />
(3.4) <strong>and</strong> finally <strong>RAPDs</strong> (2.1). Values obtained <strong>for</strong> <strong>the</strong><br />
average ENA avp were greatest using <strong>SSR</strong> analysis at 3.4,<br />
with <strong>the</strong> extremes measuring 1.16 <strong>and</strong> 6.08. Values<br />
obtained using AFLP <strong>and</strong> RAPD analysis were lower,<br />
averaging 1.6 <strong>and</strong> 1.3,respectively.<br />
3.2. Genetic similarity<br />
A summary <strong>of</strong> <strong>genetic</strong> similarity estimates,calculated<br />
<strong>for</strong> each marker system,is recorded in Table 3. Average<br />
estimates obtained using RAPD <strong>and</strong> AFLP analysis<br />
were both high (higher than 0.981),with a small range in<br />
variation. Estimates obtained from <strong>the</strong> <strong>SSR</strong> analysis<br />
were significantly lower,with a mean value <strong>of</strong> 0.437 <strong>and</strong><br />
ARTICLE IN PRESS<br />
F. Javier Gallego et al. / Food Microbiology 22 (2005) 561–568<br />
Table 2<br />
Level <strong>of</strong> polymorphism detected <strong>and</strong> comparison <strong>of</strong> in<strong>for</strong>mativeness obtained with RAPD,AFLP,<strong>and</strong> <strong>SSR</strong> methods in <strong>the</strong> 27 Sacharomyces<br />
cerevisiae strains studied<br />
variation ranging from 0.000 to 1.000. The correlation<br />
among similarity matrices derived <strong>for</strong> each method<br />
(Table 4) was very low in all cases,with AFLP/<strong>SSR</strong><br />
correlation (0.43) being <strong>the</strong> greatest.<br />
Genetic similarity trees <strong>for</strong> each marker type individually,<strong>and</strong><br />
as a whole,are presented in Figs. 4a–d.<br />
Cophenetic correlations (Table 4) indicate <strong>the</strong> extent to<br />
which <strong>the</strong> dendrograms derived from <strong>the</strong> different<br />
techniques accurately represent estimates <strong>of</strong> <strong>the</strong> original<br />
similarity matrices. High cophenetic correlations were<br />
obtained <strong>for</strong> RAPD (0.81) <strong>and</strong> AFLP marker types<br />
(0.81),with <strong>SSR</strong> <strong>markers</strong> achieving an even higher<br />
correlation <strong>of</strong> 0.91. Never<strong>the</strong>less,low correlations were<br />
observed among <strong>the</strong> different dendrograms (Table 4),<br />
topping out at 0.56 <strong>for</strong> <strong>the</strong> AFLP/<strong>SSR</strong> correlation.<br />
4. Discussion<br />
<strong>RAPDs</strong> <strong>AFLPs</strong> <strong>SSR</strong>s<br />
Number <strong>of</strong> assay units 32 6 6<br />
Average number <strong>of</strong> b<strong>and</strong>s per assay unit 4.8 22.8 6.5<br />
Polymorphic b<strong>and</strong>s (%) 8.38 10.94 100<br />
Number <strong>of</strong> loci 155 137 6<br />
Average number <strong>of</strong> alleles per locus 1.08 1.10 6.5<br />
Number <strong>of</strong> strains discriminated 13 19 20<br />
Number <strong>of</strong> assay units necessary to achieve <strong>the</strong> highest discrimination <strong>of</strong> <strong>the</strong> strains 7 4 3<br />
DI avp 0.20 0.35 0.62<br />
ENA avp 1.3 1.6 3.4<br />
Ne 16.9 24.0 20.4<br />
Ai 2.1 4.0 3.4/10.2<br />
DIavp: diversity index per polymorphic locus.ENAavp: effective number <strong>of</strong> alleles per polymorphic locus.Ne: number <strong>of</strong> effective alleles per<br />
polymorphic locus.Ai: assay efficiency index.<br />
All three techniques employed in this study (RAPD,<br />
AFLP <strong>and</strong> <strong>SSR</strong> analysis) resulted in sufficient resolution<br />
to detect differences between <strong>the</strong> <strong>genetic</strong> pr<strong>of</strong>iles <strong>of</strong><br />
various strains <strong>of</strong> <strong>the</strong> same species (S. cerevisiae). While<br />
<strong>the</strong> use <strong>of</strong> <strong>the</strong>se methods may overcome certain<br />
limitations associated with classical taxonomic methods,<br />
differences between <strong>the</strong>m exist with regards to <strong>the</strong> level<br />
<strong>of</strong> polymorphism detected,discriminatory power,effectiveness,<strong>and</strong><br />
speed <strong>of</strong> use.<br />
AFLP analysis generated <strong>the</strong> greatest number <strong>of</strong><br />
b<strong>and</strong>s per assay unit,due to <strong>the</strong> high number <strong>of</strong> loci<br />
identified per assay. The most polymorphic b<strong>and</strong>s,<br />
however,were obtained by microsatellite analysis<br />
(100%). Based on <strong>the</strong> small size <strong>of</strong> <strong>the</strong> S. cerevisiae<br />
genome <strong>and</strong> <strong>the</strong> number <strong>of</strong> amplification products<br />
obtained in this work,primers containing fewer selective<br />
bases will be used in order to increase <strong>the</strong> number <strong>of</strong><br />
b<strong>and</strong>s per assay unit.