Comparison of RAPDs, AFLPs and SSR markers for the genetic ...
Comparison of RAPDs, AFLPs and SSR markers for the genetic ...
Comparison of RAPDs, AFLPs and SSR markers for the genetic ...

You also want an ePaper? Increase the reach of your titles
YUMPU automatically turns print PDFs into web optimized ePapers that Google loves.
566<br />
crossing-over in meiosis. In our study,<strong>the</strong> microsatellite<br />
analysis yielded nearly twice as much in<strong>for</strong>mation as <strong>the</strong><br />
AFLP <strong>markers</strong>,<strong>and</strong> three times more in<strong>for</strong>mation than<br />
<strong>the</strong> <strong>RAPDs</strong>. This high level <strong>of</strong> polymorphism provided<br />
by <strong>the</strong> <strong>SSR</strong> technique is similar to that reported in o<strong>the</strong>r<br />
comparative studies (in soybean, Powell et al.,1996; in<br />
maize, Pejic et al.,1998; inMusa, Crouch et al.,1999; in<br />
table grapes, Cenı´ s<strong>and</strong>Sa´ nchez Escribano,1999).<br />
The Assay Efficiency Index (Ai),or <strong>the</strong> ENA<br />
identified per assay,is <strong>of</strong> particular interest,as it<br />
combines <strong>the</strong> ENA identified per locus <strong>and</strong> <strong>the</strong> number<br />
<strong>of</strong> polymorphic b<strong>and</strong>s detected per assay. For our study,<br />
this index allowed us to compare techniques that detect<br />
multiple alleles <strong>and</strong> one or two b<strong>and</strong>s per assay,such as<br />
<strong>SSR</strong> analysis,with techniques that detect two alleles <strong>and</strong><br />
multiple b<strong>and</strong>s per assay,such as RAPD <strong>and</strong> AFLP<br />
analysis. The highest value <strong>of</strong> Ai was obtained by <strong>the</strong><br />
AFLP method,with 4.0,compared with 3.4 <strong>for</strong> <strong>SSR</strong>s<br />
ARTICLE IN PRESS<br />
F. Javier Gallego et al. / Food Microbiology 22 (2005) 561–568<br />
1a<br />
2a<br />
6a<br />
69<br />
1a<br />
2a<br />
6a<br />
7a<br />
8a<br />
9a<br />
6s<br />
8s<br />
3a<br />
2n<br />
5a<br />
4n<br />
7s<br />
5n<br />
8n<br />
7n<br />
6n<br />
9n<br />
1n<br />
3n<br />
3s<br />
5s<br />
4a<br />
2s<br />
9s<br />
4s<br />
1s<br />
53<br />
61<br />
75<br />
7a<br />
8a<br />
9a<br />
3a<br />
5a<br />
4a<br />
1s<br />
4s<br />
9s<br />
7n<br />
9n<br />
2n<br />
8n<br />
1n<br />
3n<br />
6n<br />
4n<br />
5n<br />
2s<br />
7s<br />
3s<br />
6s<br />
8s<br />
5s<br />
0.988 0.991 0.994 0.997 1.000 0.975 0.981 0.987 0.994 1.000<br />
(a) (b)<br />
1a<br />
6a<br />
7a<br />
50<br />
87<br />
66<br />
90<br />
1a<br />
6a<br />
7a<br />
9a<br />
8a<br />
2a<br />
4a<br />
1s<br />
9s<br />
2s<br />
4s<br />
6s<br />
8s<br />
5a<br />
1n<br />
2n<br />
3n<br />
6n<br />
9n<br />
3a<br />
3s<br />
4n<br />
5n<br />
8n<br />
7s<br />
7n<br />
5s<br />
98<br />
54<br />
88<br />
99<br />
76<br />
8a<br />
9a<br />
2a<br />
5a<br />
3a<br />
4a<br />
4s<br />
9s<br />
2s<br />
1s<br />
6s<br />
8s<br />
1n<br />
3n<br />
6n<br />
9n<br />
2n<br />
4n<br />
5n<br />
8n<br />
7s<br />
7n<br />
5s<br />
3s<br />
0.234 0.425 0.617 0.808 1.000 0.964 0.973 0.982 0.991 1.000<br />
(c) (d)<br />
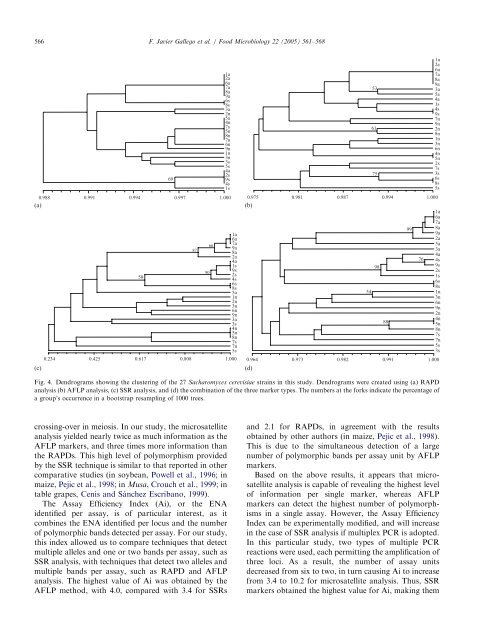
Fig. 4. Dendrograms showing <strong>the</strong> clustering <strong>of</strong> <strong>the</strong> 27 Sacharomyces cerevisiae strains in this study. Dendrograms were created using (a) RAPD<br />
analysis (b) AFLP analysis,(c) <strong>SSR</strong> analysis,<strong>and</strong> (d) <strong>the</strong> combination <strong>of</strong> <strong>the</strong> three marker types. The numbers at <strong>the</strong> <strong>for</strong>ks indicate <strong>the</strong> percentage <strong>of</strong><br />
a group’s occurrence in a bootstrap resampling <strong>of</strong> 1000 trees.<br />
<strong>and</strong> 2.1 <strong>for</strong> <strong>RAPDs</strong>,in agreement with <strong>the</strong> results<br />
obtained by o<strong>the</strong>r authors (in maize, Pejic et al.,1998).<br />
This is due to <strong>the</strong> simultaneous detection <strong>of</strong> a large<br />
number <strong>of</strong> polymorphic b<strong>and</strong>s per assay unit by AFLP<br />
<strong>markers</strong>.<br />
Based on <strong>the</strong> above results,it appears that microsatellite<br />
analysis is capable <strong>of</strong> revealing <strong>the</strong> highest level<br />
<strong>of</strong> in<strong>for</strong>mation per single marker,whereas AFLP<br />
<strong>markers</strong> can detect <strong>the</strong> highest number <strong>of</strong> polymorphisms<br />
in a single assay. However,<strong>the</strong> Assay Efficiency<br />
Index can be experimentally modified,<strong>and</strong> will increase<br />
in <strong>the</strong> case <strong>of</strong> <strong>SSR</strong> analysis if multiplex PCR is adopted.<br />
In this particular study,two types <strong>of</strong> multiple PCR<br />
reactions were used,each permitting <strong>the</strong> amplification <strong>of</strong><br />
three loci. As a result,<strong>the</strong> number <strong>of</strong> assay units<br />
decreased from six to two,in turn causing Ai to increase<br />
from 3.4 to 10.2 <strong>for</strong> microsatellite analysis. Thus,<strong>SSR</strong><br />
<strong>markers</strong> obtained <strong>the</strong> highest value <strong>for</strong> Ai,making <strong>the</strong>m