Comparison of RAPDs, AFLPs and SSR markers for the genetic ...
Comparison of RAPDs, AFLPs and SSR markers for the genetic ...
Comparison of RAPDs, AFLPs and SSR markers for the genetic ...

Create successful ePaper yourself
Turn your PDF publications into a flip-book with our unique Google optimized e-Paper software.
Food Microbiology 22 (2005) 561–568<br />
FOOD<br />
MICROBIOLOGY<br />
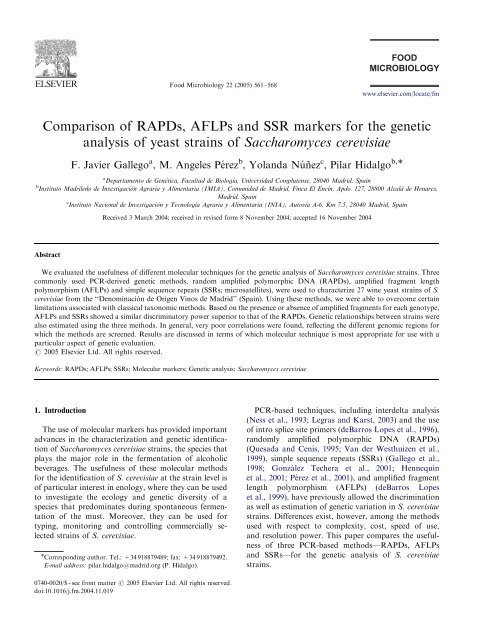
<strong>Comparison</strong> <strong>of</strong> <strong>RAPDs</strong>,<strong>AFLPs</strong> <strong>and</strong> <strong>SSR</strong> <strong>markers</strong> <strong>for</strong> <strong>the</strong> <strong>genetic</strong><br />
analysis <strong>of</strong> yeast strains <strong>of</strong> Saccharomyces cerevisiae<br />
F. Javier Gallego a ,M. Angeles Pe´ rez b ,Yol<strong>and</strong>a Nu´ n˜ ez c ,Pilar Hidalgo b,<br />
a<br />
Departamento de Genética, Facultad de Biología, Universidad Complutense, 28040 Madrid, Spain<br />
b<br />
Instituto Madrileño de Investigación Agraria y Alimentaria (IMIA), Comunidad de Madrid, Finca El Encín, Apdo. 127, 28800 Alcalá de Henares,<br />
Madrid, Spain<br />
c<br />
Instituto Nacional de Investigación y Tecnología Agraria y Alimentaria (INIA), Autovía A-6, Km 7.5, 28040 Madrid, Spain<br />
Abstract<br />
Received 3 March 2004; received in revised <strong>for</strong>m 8 November 2004; accepted 16 November 2004<br />
We evaluated <strong>the</strong> usefulness <strong>of</strong> different molecular techniques <strong>for</strong> <strong>the</strong> <strong>genetic</strong> analysis <strong>of</strong> Saccharomyces cerevisiae strains. Three<br />
commonly used PCR-derived <strong>genetic</strong> methods,r<strong>and</strong>om amplified polymorphic DNA (<strong>RAPDs</strong>),amplified fragment length<br />
polymorphism (<strong>AFLPs</strong>) <strong>and</strong> simple sequence repeats (<strong>SSR</strong>s; microsatellites),were used to characterize 27 wine yeast strains <strong>of</strong> S.<br />
cerevisiae from <strong>the</strong> ‘‘Denominacio´ n de Origen Vinos de Madrid’’ (Spain). Using <strong>the</strong>se methods,we were able to overcome certain<br />
limitations associated with classical taxonomic methods. Based on <strong>the</strong> presence or absence <strong>of</strong> amplified fragments <strong>for</strong> each genotype,<br />
<strong>AFLPs</strong> <strong>and</strong> <strong>SSR</strong>s showed a similar discriminatory power superior to that <strong>of</strong> <strong>the</strong> <strong>RAPDs</strong>. Genetic relationships between strains were<br />
also estimated using <strong>the</strong> three methods. In general,very poor correlations were found,reflecting <strong>the</strong> different genomic regions <strong>for</strong><br />
which <strong>the</strong> methods are screened. Results are discussed in terms <strong>of</strong> which molecular technique is most appropriate <strong>for</strong> use with a<br />
particular aspect <strong>of</strong> <strong>genetic</strong> evaluation.<br />
r 2005 Elsevier Ltd. All rights reserved.<br />
Keywords: <strong>RAPDs</strong>; <strong>AFLPs</strong>; <strong>SSR</strong>s; Molecular <strong>markers</strong>; Genetic analysis; Saccharomyces cerevisiae<br />
1. Introduction<br />
The use <strong>of</strong> molecular <strong>markers</strong> has provided important<br />
advances in <strong>the</strong> characterization <strong>and</strong> <strong>genetic</strong> identification<br />
<strong>of</strong> Saccharomyces cerevisiae strains,<strong>the</strong> species that<br />
plays <strong>the</strong> major role in <strong>the</strong> fermentation <strong>of</strong> alcoholic<br />
beverages. The usefulness <strong>of</strong> <strong>the</strong>se molecular methods<br />
<strong>for</strong> <strong>the</strong> identification <strong>of</strong> S. cerevisiae at <strong>the</strong> strain level is<br />
<strong>of</strong> particular interest in enology,where <strong>the</strong>y can be used<br />
to investigate <strong>the</strong> ecology <strong>and</strong> <strong>genetic</strong> diversity <strong>of</strong> a<br />
species that predominates during spontaneous fermentation<br />
<strong>of</strong> <strong>the</strong> must. Moreover,<strong>the</strong>y can be used <strong>for</strong><br />
typing,monitoring <strong>and</strong> controlling commercially selected<br />
strains <strong>of</strong> S. cerevisiae.<br />
Corresponding author. Tel.: +34 918879489; fax: +34 918879492.<br />
E-mail address: pilar.hidalgo@madrid.org (P. Hidalgo).<br />
0740-0020/$ - see front matter r 2005 Elsevier Ltd. All rights reserved.<br />
doi:10.1016/j.fm.2004.11.019<br />
ARTICLE IN PRESS<br />
www.elsevier.com/locate/fm<br />
PCR-based techniques,including interdelta analysis<br />
(Ness et al.,1993; Legras <strong>and</strong> Karst,2003) <strong>and</strong> <strong>the</strong> use<br />
<strong>of</strong> intro splice site primers (deBarros Lopes et al.,1996),<br />
r<strong>and</strong>omly amplified polymorphic DNA (<strong>RAPDs</strong>)<br />
(Quesada <strong>and</strong> Cenı´ s,1995; Van der Westhuizen et al.,<br />
1999),simple sequence repeats (<strong>SSR</strong>s) (Gallego et al.,<br />
1998; Gonza´ lez Techera et al.,2001; Hennequin<br />
et al.,2001; Pe´ rez et al.,2001),<strong>and</strong> amplified fragment<br />
length polymorphism (<strong>AFLPs</strong>) (deBarros Lopes<br />
et al.,1999),have previously allowed <strong>the</strong> discrimination<br />
as well as estimation <strong>of</strong> <strong>genetic</strong> variation in S. cerevisiae<br />
strains. Differences exist,however,among <strong>the</strong> methods<br />
used with respect to complexity,cost,speed <strong>of</strong> use,<br />
<strong>and</strong> resolution power. This paper compares <strong>the</strong> usefulness<br />
<strong>of</strong> three PCR-based methods—<strong>RAPDs</strong>,<strong>AFLPs</strong><br />
<strong>and</strong> <strong>SSR</strong>s—<strong>for</strong> <strong>the</strong> <strong>genetic</strong> analysis <strong>of</strong> S. cerevisiae<br />
strains.
562<br />
2. Materials <strong>and</strong> methods<br />
2.1. Yeast strains<br />
Must samples undergoing spontaneous fermentation<br />
were collected from wineries (A,B <strong>and</strong> C) representing<br />
three viticultural areas (Arg<strong>and</strong>a,Navalcarnero <strong>and</strong> San<br />
Martı´ n de Valdeiglesias) <strong>of</strong> <strong>the</strong> ‘‘Denominacio´ n de<br />
Origen Vinos de Madrid’’ (Spain). The number <strong>of</strong> tanks<br />
sampled in cellars A,B <strong>and</strong> C were two,four <strong>and</strong> two,<br />
respectively. Fermentation processes were conducted at<br />
temperatures between 18 <strong>and</strong> 20 1C. Populations <strong>of</strong><br />
viable yeast cells in each step <strong>of</strong> <strong>the</strong> fermentation process<br />
were <strong>of</strong> <strong>the</strong> order <strong>of</strong> 10 7 cfu/mL. From <strong>the</strong>se populations,a<br />
total <strong>of</strong> 27 S. cerevisiae (Kreger Van Rij,1984;<br />
Kurtzman <strong>and</strong> Fell,1998) strains were isolated <strong>and</strong><br />
chosen at r<strong>and</strong>om <strong>for</strong> use in this study. These strains<br />
have been included in <strong>the</strong> culture collection <strong>of</strong> <strong>the</strong> IMIA<br />
(El Encı´ n,Madrid). The reference code,origin <strong>and</strong><br />
source <strong>of</strong> each yeast strain are listed in Table 1.<br />
2.2. DNA extraction<br />
This process was carried out following <strong>the</strong> technique<br />
described by Pe´ rez et al. (2001).<br />
Table 1<br />
S. cerevisiae strains used in this study<br />
Strain<br />
(reference code)<br />
Viticultural<br />
area<br />
Winery Isolation<br />
sample<br />
ARTICLE IN PRESS<br />
Step <strong>of</strong><br />
fermentation<br />
1a Arg<strong>and</strong>a A 20 Middle<br />
2a Arg<strong>and</strong>a A 20 Middle<br />
3a Arg<strong>and</strong>a A 20 Middle<br />
4a Arg<strong>and</strong>a A 20 Middle<br />
5a Arg<strong>and</strong>a A 20 End<br />
6a Arg<strong>and</strong>a A 21 Middle<br />
7a Arg<strong>and</strong>a A 21 Middle<br />
8a Arg<strong>and</strong>a A 21 Middle<br />
9a Arg<strong>and</strong>a A 21 End<br />
1n Navalcarnero B 32 End<br />
2n Navalcarnero B 32 Middle<br />
3n Navalcarnero B 32 End<br />
4n Navalcarnero B 33 Middle<br />
5n Navalcarnero B 33 End<br />
6n Navalcarnero B 33 End<br />
7n Navalcarnero B 33 End<br />
8n Navalcarnero B 34 End<br />
9n Navalcarnero B 35 Middle<br />
1s San Martín C 46 Middle<br />
2s San Martín C 46 Middle<br />
3s San Martín C 46 End<br />
4s San Martín C 46 End<br />
5s San Martín C 47 Middle<br />
6s San Martín C 47 End<br />
7s San Martín C 47 End<br />
8s San Martín C 47 End<br />
9s San Martín C 47 End<br />
F. Javier Gallego et al. / Food Microbiology 22 (2005) 561–568<br />
2.3. RAPD analysis<br />
RAPD amplifications were carried out according to<br />
<strong>the</strong> methodology described by Gallego <strong>and</strong> Martı´ nez<br />
(1997) using a DNA Thermal Cycler 9600 (Applied<br />
Biosystems) under <strong>the</strong> following conditions: a preliminary<br />
step <strong>of</strong> 2 min at 94 1C; 10 cycles each <strong>of</strong> 30 s at 94 1C,<br />
a ramp <strong>of</strong> 1.5 1Cs 1 to reach annealing temperature,<br />
1 min at 55 1C (decreasing 1 1C per cycle to a final<br />
temperature <strong>of</strong> 46 1C),<strong>and</strong> a ramp <strong>of</strong> 1.5 min to reach<br />
72 1C followed by 4.5 min at this temperature; 25 cycles<br />
each <strong>of</strong> 30 s at 94 1C,a ramp <strong>of</strong> 1.5 1Cs 1 to reach<br />
annealing temperature,1 min at 45 1C,<strong>and</strong> a ramp <strong>of</strong><br />
1.5 min to reach 72 1C followed by 4.5 min at this<br />
temperature; <strong>and</strong> a final step <strong>of</strong> 1 min at 72 1C.<br />
Forty primers from sets B <strong>and</strong> C <strong>of</strong> Operon<br />
Technologies (Alameda,CA) were used in preliminary<br />
experiments in order to evaluate <strong>the</strong>ir per<strong>for</strong>mance.<br />
Thirty-two resulted in satisfactory amplifications <strong>and</strong><br />
were selected <strong>for</strong> use in <strong>the</strong> remainder <strong>of</strong> <strong>the</strong> assay.<br />
Amplification products were separated by electrophoresis<br />
in 1.5% (w/v) agarose gels,<strong>and</strong> visualized under UV<br />
light after staining with ethidium bromide.<br />
2.4. AFLP analysis<br />
AFLP <strong>markers</strong> were developed following <strong>the</strong> protocol<br />
supplied by Applied Biosystems (Foster City,Cali<strong>for</strong>nia,USA),based<br />
on Vos et al. (1995). DNA digestion<br />
was carried out using <strong>the</strong> restriction enzymes EcoRI <strong>and</strong><br />
MseI. Six selective amplifications were per<strong>for</strong>med using<br />
five primers. Two <strong>of</strong> <strong>the</strong> primers included <strong>the</strong> MseI<br />
adaptor sequence plus <strong>the</strong> selective CTT <strong>and</strong> CAA. The<br />
remaining three primers contained <strong>the</strong> EcoRI adaptor<br />
sequence plus AC,AT <strong>and</strong> AAG. The EcoRI selective<br />
primers were 5 0 -labeled with one <strong>of</strong> <strong>the</strong> following<br />
fluorescent dyes: 6-FAM,TET or HEX (Applied<br />
Biosystems). PCR products were separated by capillary<br />
electrophoresis in an ABI Prism 310 DNA Sequencer<br />
(Applied Biosystems). The number <strong>of</strong> fragments generated<br />
by each primer pair was obtained directly from<br />
Genescan Analysis s<strong>of</strong>tware,using <strong>the</strong> local Sou<strong>the</strong>rn<br />
method to size <strong>the</strong> fragments.<br />
2.5. <strong>SSR</strong> analysis<br />
<strong>SSR</strong> analysis was per<strong>for</strong>med according to <strong>the</strong><br />
methodology developed by Pe´ rez et al. (2001),using a<br />
panel <strong>of</strong> six effective microsatellite loci as sequencetagged<br />
site <strong>markers</strong>.<br />
Loci were amplified using two multiple PCR reactions,including<br />
ScAAT2,ScAAT3,ScAAT5 in <strong>the</strong> first<br />
reaction (PCR1) <strong>and</strong> ScAAT1,ScAAT4,<strong>and</strong> ScAAT6<br />
in <strong>the</strong> second (PCR2). Each PCR reaction was<br />
per<strong>for</strong>med in 25 mL final volume containing 10–400 ng<br />
<strong>of</strong> template DNA <strong>and</strong> 0.2 mM <strong>of</strong> each dNTP (Applied
Biosystems,Foster City,Cali<strong>for</strong>nia,USA). PCR1<br />
reaction mix contained 5 pmol <strong>of</strong> ScAAT2 primer pair<br />
fluorescent-dye labeled with HEX (yellow),5 pmol <strong>of</strong><br />
ScAAT3 primer pair fluorescent-dye labeled with 6-<br />
FAM (blue),7.5 pmol <strong>of</strong> ScAAT5 primer pair fluorescent-dye<br />
labeled with TET (green),<strong>and</strong> 1 U <strong>of</strong> Taq<br />
DNA polymerase (Biotools,Biotechnological <strong>and</strong> Medical<br />
Laboratories,S.A.,Madrid,Spain) in 1 reaction<br />
buffer (75 mM Tris HCl pH 9.0,50 mM KCl,20 mM<br />
(NH4)2SO4). PCR2 reaction mix contained 2.5 pmol <strong>of</strong><br />
ScAAT4 primer pair fluorescent-dye labeled with TET,<br />
2.5 pmol <strong>of</strong> ScAAT6 primer pair fluorescent-dye labeled<br />
with HEX,10 pmol <strong>of</strong> ScAAT1 primer pair fluorescentdye<br />
labeled with 6-FAM,<strong>and</strong> 1.5 U <strong>of</strong> Taq DNA<br />
polymerase.<br />
The amplification reactions were carried out using a<br />
DNA Thermal Cycler 9600 (Applied Biosystems) under<br />
<strong>the</strong> following conditions: a preliminary step <strong>of</strong> 5 min at<br />
94 1C; 10 cycles each <strong>of</strong> 15 s at 94 1C,30 s at 58 1C<br />
(decreasing 1 1C per cycle to reach a final temperature <strong>of</strong><br />
47 1C),<strong>and</strong> 30 s at 72 1C; 25 cycles each <strong>of</strong> 15 s at 94 1C,<br />
30 s at 48 1C,<strong>and</strong> 30 s at 72 1C; <strong>and</strong> a final step <strong>of</strong> 5 min<br />
at 72 1C. Amplifications were confirmed by running<br />
10 mL <strong>of</strong> <strong>the</strong> PCR product on 2.5% agarose gel.<br />
Aliquots (1–2 mL) <strong>of</strong> <strong>the</strong> PCR product were mixed<br />
with 12 mL <strong>of</strong> <strong>for</strong>mamide <strong>and</strong> 0.5 mL <strong>of</strong> a red DNA size<br />
st<strong>and</strong>ard (Genescan-500 ROX,Applied Biosystems).<br />
Samples were denatured at 94 1C <strong>for</strong> 3 min prior to<br />
separation by capillary electrophoresis at 15 KV <strong>for</strong><br />
24 min in an ABI Prism 310 DNA Sequencer (Applied<br />
Biosystems),<strong>and</strong> subsequently analysed using Genescan<br />
s<strong>of</strong>tware (Applied Biosystems).<br />
The reproducibility <strong>of</strong> <strong>the</strong> three analysis techniques<br />
was assessed by comparing results from two additional<br />
independent DNA extractions from half <strong>of</strong> <strong>the</strong> study<br />
strains that were chosen r<strong>and</strong>omly.<br />
2.6. Data analysis<br />
Data matrices were built based on <strong>the</strong> presence or<br />
absence <strong>of</strong> amplification products. Genetic distances<br />
were estimated from <strong>the</strong>se matrices using Dice’s algorithm<br />
(Dice,1945). This coefficient was used <strong>for</strong><br />
clustering data according to <strong>the</strong> UPGMA method.<br />
Bootstrap resampling <strong>of</strong> 1000 replicates was per<strong>for</strong>med<br />
to test <strong>the</strong> robustness <strong>of</strong> <strong>the</strong> topology <strong>of</strong> <strong>the</strong> dendrograms.<br />
Differences between dendrograms were tested by<br />
generating cophenetic values <strong>for</strong> each dendrogram <strong>and</strong><br />
assembling a cophenetic matrix <strong>for</strong> each marker type.<br />
The Mantel matrix correspondence test was <strong>the</strong>n used to<br />
compare cophenetic matrices (Mantel,1967). Computing<br />
was per<strong>for</strong>med using NTSYSpc s<strong>of</strong>tware version 2.0<br />
(Rohlf,1993) <strong>and</strong> TFPGA s<strong>of</strong>tware version 1.3 (Miller,<br />
1997).<br />
In order to evaluate <strong>the</strong> usefulness <strong>of</strong> each marker<br />
system,all <strong>of</strong> <strong>the</strong> following were calculated: <strong>the</strong><br />
ARTICLE IN PRESS<br />
F. Javier Gallego et al. / Food Microbiology 22 (2005) 561–568 563<br />
arithmetic mean <strong>of</strong> Diversity Index per polymorphic<br />
locus (DIavp ¼ [1–Spi 2 ]/np,where p i is <strong>the</strong> allele<br />
frequency <strong>for</strong> <strong>the</strong> i allele <strong>and</strong> np is <strong>the</strong> number <strong>of</strong><br />
polymorphic loci),<strong>the</strong> arithmetic mean <strong>of</strong> Effective<br />
Number <strong>of</strong> Alleles per polymorphic locus (ENA avp ¼ [1/<br />
Sp i 2 ]/np),<strong>the</strong> total number <strong>of</strong> effective alleles per<br />
polymorphic locus (Ne ¼ sumat ENAavp),<strong>and</strong> <strong>the</strong><br />
Assay Efficiency Index (Ai ¼ Ne/P). Ai combines <strong>the</strong><br />
ENA identified per locus <strong>and</strong> <strong>the</strong> number <strong>of</strong> polymorphic<br />
b<strong>and</strong>s detected in each assay (P). For dominant<br />
<strong>markers</strong> (<strong>RAPDs</strong> <strong>and</strong> <strong>AFLPs</strong>) where one <strong>of</strong> only two<br />
states (+,present or ,absent) can be distinguished at<br />
each position,we assumed that each b<strong>and</strong> position<br />
corresponded to a locus with two alleles: presence <strong>and</strong><br />
absence <strong>of</strong> <strong>the</strong> b<strong>and</strong>.<br />
3. Results<br />
3.1. Efficiency <strong>of</strong> polymorphism detection<br />
The level <strong>of</strong> polymorphism detected with each marker<br />
system is summarized in Table 2,as well as a<br />
comparison between systems.<br />
A total <strong>of</strong> 155 b<strong>and</strong>s were amplified by <strong>the</strong> 32<br />
primers used in <strong>the</strong> RAPD analysis (Fig. 1). Eight<br />
primers—OPB (01,06,07,12,13,15) <strong>and</strong> OPC (01,<br />
03)—allowed <strong>the</strong> intraspecific differentiation <strong>of</strong> <strong>the</strong><br />
yeasts,with a total <strong>of</strong> 13 polymorphic b<strong>and</strong>s. By<br />
combining <strong>the</strong> electrophoretic pr<strong>of</strong>iles <strong>of</strong> seven primers<br />
(OPB01,OPB06,OPB07,OPB13,OPB15,OPC01 <strong>and</strong><br />
OPC03),we were able to use <strong>the</strong>se polymorphisms to<br />
differentiate 13 <strong>of</strong> <strong>the</strong> 27 S. cerevisiae strains in this<br />
study. The number <strong>of</strong> amplified b<strong>and</strong>s varied between<br />
primers,ranging between two <strong>and</strong> 10,with sizes from<br />
400 up to 2000 bp. Duplicate analysis <strong>of</strong> r<strong>and</strong>om strains<br />
revealed no significant differences in b<strong>and</strong>ing patterns,<br />
although some b<strong>and</strong>s varied in intensity.<br />
Analysis <strong>of</strong> AFLP b<strong>and</strong>ing patterns (Fig. 2) yielded<br />
137 DNA fragments,with sizes ranging from 130 to<br />
410 bp. A total <strong>of</strong> 15 <strong>of</strong> <strong>the</strong>se b<strong>and</strong>s were polymorphic,<br />
allowing <strong>the</strong> differentiation <strong>of</strong> 19 <strong>of</strong> <strong>the</strong> 27 strains in this<br />
study. In<strong>for</strong>mation from four additional primer combinations<br />
(MseI-CTT/EcoRI-AC, MseI-CTT/EcoRI-AT,<br />
MseI-CAA/EcoRI-AC <strong>and</strong> MseI-CAA/EcoRI-AT) was<br />
also used in <strong>the</strong> differentiation process. The repetition <strong>of</strong><br />
this AFLP analysis obtained similar results.<br />
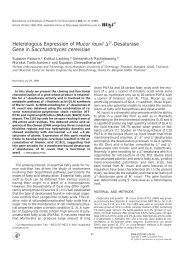
<strong>SSR</strong> analysis (Fig. 3) detected a number <strong>of</strong> alleles <strong>for</strong><br />
each locus,ranging from four (loci ScAAT5 <strong>and</strong><br />
ScAAT6) to 10 (loci ScAAT1 <strong>and</strong> ScAAT3),with 39<br />
total alleles identified. Twenty <strong>of</strong> <strong>the</strong> 27 S. cerevisiae<br />
strains in this study were differentiated. To complete <strong>the</strong><br />
<strong>SSR</strong> analysis,in<strong>for</strong>mation from three microsatellites<br />
was combined: ScAAT1,ScAAT3 <strong>and</strong> ScAAT4. Amplification<br />
products varied in size from 165 to 445 bp.<br />
Despite this allelic diversity,percent heterozygosity
564<br />
Fig. 1. Patterns <strong>of</strong> amplified DNA obtained with nine S. cerevisiae<br />
strains,in reactions with primer OPC-01. Lane M: Size marker f 174<br />
DNA, Hae III. Polymorphic b<strong>and</strong>s are indicated by arrows.<br />
between loci ranged from 7% at locus ScAAT6 to 67%<br />
at locus ScAAT1. Duplicate analysis <strong>of</strong> r<strong>and</strong>om strains<br />
resulted in identical pr<strong>of</strong>iles.<br />
In<strong>for</strong>mation content,measured as IDavp,was higher<br />
<strong>for</strong> <strong>the</strong> <strong>SSR</strong> analysis (0.62),although Ai was highest<br />
using AFLP analysis (4.0),followed by <strong>the</strong> <strong>SSR</strong> method<br />
(3.4) <strong>and</strong> finally <strong>RAPDs</strong> (2.1). Values obtained <strong>for</strong> <strong>the</strong><br />
average ENA avp were greatest using <strong>SSR</strong> analysis at 3.4,<br />
with <strong>the</strong> extremes measuring 1.16 <strong>and</strong> 6.08. Values<br />
obtained using AFLP <strong>and</strong> RAPD analysis were lower,<br />
averaging 1.6 <strong>and</strong> 1.3,respectively.<br />
3.2. Genetic similarity<br />
A summary <strong>of</strong> <strong>genetic</strong> similarity estimates,calculated<br />
<strong>for</strong> each marker system,is recorded in Table 3. Average<br />
estimates obtained using RAPD <strong>and</strong> AFLP analysis<br />
were both high (higher than 0.981),with a small range in<br />
variation. Estimates obtained from <strong>the</strong> <strong>SSR</strong> analysis<br />
were significantly lower,with a mean value <strong>of</strong> 0.437 <strong>and</strong><br />
ARTICLE IN PRESS<br />
F. Javier Gallego et al. / Food Microbiology 22 (2005) 561–568<br />
Table 2<br />
Level <strong>of</strong> polymorphism detected <strong>and</strong> comparison <strong>of</strong> in<strong>for</strong>mativeness obtained with RAPD,AFLP,<strong>and</strong> <strong>SSR</strong> methods in <strong>the</strong> 27 Sacharomyces<br />
cerevisiae strains studied<br />
variation ranging from 0.000 to 1.000. The correlation<br />
among similarity matrices derived <strong>for</strong> each method<br />
(Table 4) was very low in all cases,with AFLP/<strong>SSR</strong><br />
correlation (0.43) being <strong>the</strong> greatest.<br />
Genetic similarity trees <strong>for</strong> each marker type individually,<strong>and</strong><br />
as a whole,are presented in Figs. 4a–d.<br />
Cophenetic correlations (Table 4) indicate <strong>the</strong> extent to<br />
which <strong>the</strong> dendrograms derived from <strong>the</strong> different<br />
techniques accurately represent estimates <strong>of</strong> <strong>the</strong> original<br />
similarity matrices. High cophenetic correlations were<br />
obtained <strong>for</strong> RAPD (0.81) <strong>and</strong> AFLP marker types<br />
(0.81),with <strong>SSR</strong> <strong>markers</strong> achieving an even higher<br />
correlation <strong>of</strong> 0.91. Never<strong>the</strong>less,low correlations were<br />
observed among <strong>the</strong> different dendrograms (Table 4),<br />
topping out at 0.56 <strong>for</strong> <strong>the</strong> AFLP/<strong>SSR</strong> correlation.<br />
4. Discussion<br />
<strong>RAPDs</strong> <strong>AFLPs</strong> <strong>SSR</strong>s<br />
Number <strong>of</strong> assay units 32 6 6<br />
Average number <strong>of</strong> b<strong>and</strong>s per assay unit 4.8 22.8 6.5<br />
Polymorphic b<strong>and</strong>s (%) 8.38 10.94 100<br />
Number <strong>of</strong> loci 155 137 6<br />
Average number <strong>of</strong> alleles per locus 1.08 1.10 6.5<br />
Number <strong>of</strong> strains discriminated 13 19 20<br />
Number <strong>of</strong> assay units necessary to achieve <strong>the</strong> highest discrimination <strong>of</strong> <strong>the</strong> strains 7 4 3<br />
DI avp 0.20 0.35 0.62<br />
ENA avp 1.3 1.6 3.4<br />
Ne 16.9 24.0 20.4<br />
Ai 2.1 4.0 3.4/10.2<br />
DIavp: diversity index per polymorphic locus.ENAavp: effective number <strong>of</strong> alleles per polymorphic locus.Ne: number <strong>of</strong> effective alleles per<br />
polymorphic locus.Ai: assay efficiency index.<br />
All three techniques employed in this study (RAPD,<br />
AFLP <strong>and</strong> <strong>SSR</strong> analysis) resulted in sufficient resolution<br />
to detect differences between <strong>the</strong> <strong>genetic</strong> pr<strong>of</strong>iles <strong>of</strong><br />
various strains <strong>of</strong> <strong>the</strong> same species (S. cerevisiae). While<br />
<strong>the</strong> use <strong>of</strong> <strong>the</strong>se methods may overcome certain<br />
limitations associated with classical taxonomic methods,<br />
differences between <strong>the</strong>m exist with regards to <strong>the</strong> level<br />
<strong>of</strong> polymorphism detected,discriminatory power,effectiveness,<strong>and</strong><br />
speed <strong>of</strong> use.<br />
AFLP analysis generated <strong>the</strong> greatest number <strong>of</strong><br />
b<strong>and</strong>s per assay unit,due to <strong>the</strong> high number <strong>of</strong> loci<br />
identified per assay. The most polymorphic b<strong>and</strong>s,<br />
however,were obtained by microsatellite analysis<br />
(100%). Based on <strong>the</strong> small size <strong>of</strong> <strong>the</strong> S. cerevisiae<br />
genome <strong>and</strong> <strong>the</strong> number <strong>of</strong> amplification products<br />
obtained in this work,primers containing fewer selective<br />
bases will be used in order to increase <strong>the</strong> number <strong>of</strong><br />
b<strong>and</strong>s per assay unit.
ARTICLE IN PRESS<br />
Fig. 2. Patterns <strong>of</strong> amplified DNA <strong>of</strong> three S. cerevisiae strains,obtained by <strong>AFLPs</strong>.<br />
Fig. 3. Electrophoregram pr<strong>of</strong>iles <strong>of</strong> three S. cerevisiae strains generated by multiple PCR reaction amplifying <strong>the</strong> loci ScAAT2,ScAAT3 <strong>and</strong><br />
ScAAT5.<br />
Table 3<br />
<strong>Comparison</strong> <strong>of</strong> <strong>genetic</strong> similarity estimates obtained from three PCRderived<br />
techniques,using Dice coefficient<br />
Minimum Maximum Mean<br />
<strong>RAPDs</strong> 0.983 1.000 0.992<br />
<strong>AFLPs</strong> 0.961 1.000 0.981<br />
<strong>SSR</strong>s 0.000 1.000 0.437<br />
Table 4<br />
Correlation between cophenetic matrices (above diagonal) <strong>and</strong><br />
similarity matrices (below diagonal) obtained with different marker<br />
types<br />
<strong>RAPDs</strong> <strong>AFLPs</strong> <strong>SSR</strong>s<br />
<strong>RAPDs</strong> 0.81 0.35 0.50<br />
<strong>AFLPs</strong> 0.14 0.81 0.56<br />
<strong>SSR</strong>s 0.24 0.43 0.91<br />
Cophenetic correlation coefficients between <strong>the</strong> similarity <strong>and</strong> <strong>the</strong><br />
corresponding cophenetic matrices are given in bold on <strong>the</strong> leading<br />
diagonal.<br />
F. Javier Gallego et al. / Food Microbiology 22 (2005) 561–568 565<br />
While <strong>the</strong> <strong>SSR</strong> <strong>and</strong> AFLP techniques showed a higher<br />
discriminatory power than that <strong>of</strong> <strong>the</strong> RAPD analysis,<br />
all three techniques were able to detect <strong>genetic</strong><br />
variability between S. cerevisiae populations in this<br />
study. AFLP <strong>and</strong> <strong>SSR</strong> analysis distinguished a combined<br />
total <strong>of</strong> 23 <strong>of</strong> <strong>the</strong> 27 strains tested. All three<br />
techniques resulted in identical DNA pr<strong>of</strong>iles <strong>for</strong> three<br />
groups <strong>of</strong> isolates (1a,6a <strong>and</strong> 7a; 4n <strong>and</strong> 5n; <strong>and</strong> 6 s <strong>and</strong><br />
8 s). It is interesting to note that <strong>the</strong>se three groups were<br />
isolated ei<strong>the</strong>r from <strong>the</strong> same must or from different<br />
musts collected at <strong>the</strong> same winery (A,B,<strong>and</strong> C,<br />
respectively, Table 1). These observations may support<br />
<strong>the</strong> hypo<strong>the</strong>sis that those isolates not characterized in<br />
this study were actually <strong>of</strong> <strong>the</strong> same strain. Fur<strong>the</strong>r<br />
physiological <strong>and</strong> <strong>genetic</strong> analyses are needed to confirm<br />
this assumption.<br />
Microsatellite analysis resulted in <strong>the</strong> highest level <strong>of</strong><br />
in<strong>for</strong>mation content,measured as ID avp. This increased<br />
level <strong>of</strong> polymorphism may be due to some <strong>of</strong> <strong>the</strong><br />
mechanisms responsible <strong>for</strong> generating <strong>SSR</strong> allelic<br />
diversity: replication slippage <strong>and</strong> errors during
566<br />
crossing-over in meiosis. In our study,<strong>the</strong> microsatellite<br />
analysis yielded nearly twice as much in<strong>for</strong>mation as <strong>the</strong><br />
AFLP <strong>markers</strong>,<strong>and</strong> three times more in<strong>for</strong>mation than<br />
<strong>the</strong> <strong>RAPDs</strong>. This high level <strong>of</strong> polymorphism provided<br />
by <strong>the</strong> <strong>SSR</strong> technique is similar to that reported in o<strong>the</strong>r<br />
comparative studies (in soybean, Powell et al.,1996; in<br />
maize, Pejic et al.,1998; inMusa, Crouch et al.,1999; in<br />
table grapes, Cenı´ s<strong>and</strong>Sa´ nchez Escribano,1999).<br />
The Assay Efficiency Index (Ai),or <strong>the</strong> ENA<br />
identified per assay,is <strong>of</strong> particular interest,as it<br />
combines <strong>the</strong> ENA identified per locus <strong>and</strong> <strong>the</strong> number<br />
<strong>of</strong> polymorphic b<strong>and</strong>s detected per assay. For our study,<br />
this index allowed us to compare techniques that detect<br />
multiple alleles <strong>and</strong> one or two b<strong>and</strong>s per assay,such as<br />
<strong>SSR</strong> analysis,with techniques that detect two alleles <strong>and</strong><br />
multiple b<strong>and</strong>s per assay,such as RAPD <strong>and</strong> AFLP<br />
analysis. The highest value <strong>of</strong> Ai was obtained by <strong>the</strong><br />
AFLP method,with 4.0,compared with 3.4 <strong>for</strong> <strong>SSR</strong>s<br />
ARTICLE IN PRESS<br />
F. Javier Gallego et al. / Food Microbiology 22 (2005) 561–568<br />
1a<br />
2a<br />
6a<br />
69<br />
1a<br />
2a<br />
6a<br />
7a<br />
8a<br />
9a<br />
6s<br />
8s<br />
3a<br />
2n<br />
5a<br />
4n<br />
7s<br />
5n<br />
8n<br />
7n<br />
6n<br />
9n<br />
1n<br />
3n<br />
3s<br />
5s<br />
4a<br />
2s<br />
9s<br />
4s<br />
1s<br />
53<br />
61<br />
75<br />
7a<br />
8a<br />
9a<br />
3a<br />
5a<br />
4a<br />
1s<br />
4s<br />
9s<br />
7n<br />
9n<br />
2n<br />
8n<br />
1n<br />
3n<br />
6n<br />
4n<br />
5n<br />
2s<br />
7s<br />
3s<br />
6s<br />
8s<br />
5s<br />
0.988 0.991 0.994 0.997 1.000 0.975 0.981 0.987 0.994 1.000<br />
(a) (b)<br />
1a<br />
6a<br />
7a<br />
50<br />
87<br />
66<br />
90<br />
1a<br />
6a<br />
7a<br />
9a<br />
8a<br />
2a<br />
4a<br />
1s<br />
9s<br />
2s<br />
4s<br />
6s<br />
8s<br />
5a<br />
1n<br />
2n<br />
3n<br />
6n<br />
9n<br />
3a<br />
3s<br />
4n<br />
5n<br />
8n<br />
7s<br />
7n<br />
5s<br />
98<br />
54<br />
88<br />
99<br />
76<br />
8a<br />
9a<br />
2a<br />
5a<br />
3a<br />
4a<br />
4s<br />
9s<br />
2s<br />
1s<br />
6s<br />
8s<br />
1n<br />
3n<br />
6n<br />
9n<br />
2n<br />
4n<br />
5n<br />
8n<br />
7s<br />
7n<br />
5s<br />
3s<br />
0.234 0.425 0.617 0.808 1.000 0.964 0.973 0.982 0.991 1.000<br />
(c) (d)<br />
Fig. 4. Dendrograms showing <strong>the</strong> clustering <strong>of</strong> <strong>the</strong> 27 Sacharomyces cerevisiae strains in this study. Dendrograms were created using (a) RAPD<br />
analysis (b) AFLP analysis,(c) <strong>SSR</strong> analysis,<strong>and</strong> (d) <strong>the</strong> combination <strong>of</strong> <strong>the</strong> three marker types. The numbers at <strong>the</strong> <strong>for</strong>ks indicate <strong>the</strong> percentage <strong>of</strong><br />
a group’s occurrence in a bootstrap resampling <strong>of</strong> 1000 trees.<br />
<strong>and</strong> 2.1 <strong>for</strong> <strong>RAPDs</strong>,in agreement with <strong>the</strong> results<br />
obtained by o<strong>the</strong>r authors (in maize, Pejic et al.,1998).<br />
This is due to <strong>the</strong> simultaneous detection <strong>of</strong> a large<br />
number <strong>of</strong> polymorphic b<strong>and</strong>s per assay unit by AFLP<br />
<strong>markers</strong>.<br />
Based on <strong>the</strong> above results,it appears that microsatellite<br />
analysis is capable <strong>of</strong> revealing <strong>the</strong> highest level<br />
<strong>of</strong> in<strong>for</strong>mation per single marker,whereas AFLP<br />
<strong>markers</strong> can detect <strong>the</strong> highest number <strong>of</strong> polymorphisms<br />
in a single assay. However,<strong>the</strong> Assay Efficiency<br />
Index can be experimentally modified,<strong>and</strong> will increase<br />
in <strong>the</strong> case <strong>of</strong> <strong>SSR</strong> analysis if multiplex PCR is adopted.<br />
In this particular study,two types <strong>of</strong> multiple PCR<br />
reactions were used,each permitting <strong>the</strong> amplification <strong>of</strong><br />
three loci. As a result,<strong>the</strong> number <strong>of</strong> assay units<br />
decreased from six to two,in turn causing Ai to increase<br />
from 3.4 to 10.2 <strong>for</strong> microsatellite analysis. Thus,<strong>SSR</strong><br />
<strong>markers</strong> obtained <strong>the</strong> highest value <strong>for</strong> Ai,making <strong>the</strong>m
<strong>the</strong> most efficient <strong>markers</strong> in <strong>the</strong> study. This value may<br />
rise even higher if attempts to optimize this technique<br />
into a single multiple reaction involving all six microsatellites<br />
prove successful.<br />
Ano<strong>the</strong>r important factor to consider when evaluating<br />
marker efficiency is <strong>the</strong> ability to determine relationships<br />
between yeast strains based on an estimation <strong>of</strong><br />
<strong>genetic</strong> similarity (Figs. 4a–c). Genetic similarity coefficients<br />
were obtained (Table 3) <strong>for</strong> all three PCR-derived<br />
techniques,reflecting <strong>the</strong> extreme variability <strong>and</strong> high<br />
resolving power <strong>of</strong> <strong>the</strong>se methods. These same results,<br />
including lower similarity estimates <strong>for</strong> <strong>SSR</strong> analysis<br />
than <strong>for</strong> both <strong>RAPDs</strong> <strong>and</strong> <strong>AFLPs</strong>,have been reported<br />
in equivalent studies per<strong>for</strong>med using o<strong>the</strong>r organisms<br />
(in soybean, Powell et al.,1996; in maize, Pejic et al.,<br />
1998; in Musa, Crouch et al.,1999). These findings<br />
suggest that differences exist between a technique that<br />
amplifies unique sequences,such as microsatellite<br />
analysis,<strong>and</strong> o<strong>the</strong>r methods that amplify multiple<br />
sequences,such as RAPD <strong>and</strong> AFLP techniques.<br />
Poor correlation between estimates <strong>of</strong> <strong>genetic</strong> similarity<br />
based on <strong>the</strong> three different techniques evaluated<br />
in this study indicates that <strong>the</strong>se methods may selectively<br />
screen <strong>for</strong> different regions <strong>of</strong> <strong>the</strong> genome. To fur<strong>the</strong>r<br />
explore this issue,as well as <strong>the</strong> close similarity between<br />
<strong>the</strong> strains assayed,a greater number <strong>of</strong> loci should be<br />
analysed. In an ef<strong>for</strong>t to increase <strong>the</strong> integrity <strong>of</strong> our<br />
analysis,a single dendrogram was constructed that<br />
combines <strong>the</strong> in<strong>for</strong>mation obtained from all three<br />
marker types (Fig. 4d). This <strong>genetic</strong> tree revealed that<br />
only <strong>the</strong> topology <strong>of</strong> some groupings is conserved,with<br />
non-significant groups appearing r<strong>and</strong>om regardless <strong>of</strong><br />
<strong>the</strong> number <strong>of</strong> <strong>markers</strong> studied. Fur<strong>the</strong>r physiological<br />
experimentation is needed in order to determine if <strong>the</strong><br />
conserved groups are correlated with traits <strong>of</strong> interest.<br />
Based on <strong>the</strong> results <strong>of</strong> this study,RAPD <strong>markers</strong><br />
were <strong>the</strong> least polymorphic <strong>markers</strong> <strong>of</strong> those evaluated,<br />
<strong>and</strong> consequently had <strong>the</strong> least resolving power.<br />
Although <strong>the</strong> amount <strong>of</strong> variability detected with<br />
RAPD analysis is dependent upon <strong>the</strong> selection <strong>of</strong><br />
appropriate primers,this method has <strong>the</strong> advantage <strong>of</strong><br />
being inexpensive <strong>and</strong> simple to per<strong>for</strong>m,<strong>and</strong> does not<br />
require a previous knowledge <strong>of</strong> <strong>the</strong> genome. Problems<br />
with reproducibility have plagued <strong>the</strong> use <strong>of</strong> this<br />
technique in <strong>the</strong> past,due to <strong>the</strong> low temperature <strong>of</strong><br />
<strong>the</strong> hybridization <strong>of</strong> <strong>the</strong> primers. However,we were able<br />
to limit <strong>the</strong>se problems in this study,as evidenced by <strong>the</strong><br />
results <strong>of</strong> our duplicate analysis,by careful DNA<br />
preparation,strict adherence to amplification protocols<br />
<strong>and</strong> a rigorous interpretation <strong>of</strong> <strong>the</strong> results.<br />
The AFLP technique resulted in high resolution <strong>and</strong><br />
good reproducibility in this study,a finding substantiated<br />
by <strong>the</strong> recent use <strong>of</strong> AFLP <strong>markers</strong> in <strong>the</strong><br />
identification <strong>and</strong> intraspecific differentiation <strong>of</strong> S.<br />
cerevisiae strains (deBarros Lopes et al.,1999). This<br />
technique,however,is much more technically complex<br />
ARTICLE IN PRESS<br />
F. Javier Gallego et al. / Food Microbiology 22 (2005) 561–568 567<br />
than <strong>the</strong> use <strong>of</strong> <strong>SSR</strong> <strong>markers</strong>,requiring numerous<br />
experimental steps at a higher cost per in<strong>for</strong>mative<br />
marker. Despite <strong>the</strong>se limitations,<strong>the</strong> AFLP technique<br />
has great value as a tool <strong>for</strong> use in <strong>genetic</strong> mapping <strong>and</strong><br />
evolutionary studies,as it can test a large number <strong>of</strong> loci<br />
distributed r<strong>and</strong>omly throughout a genome. Unlike<br />
microsatellites,AFLP <strong>markers</strong> are not highly variable,<br />
providing a less biased estimate <strong>of</strong> population variability.<br />
<strong>SSR</strong> analysis revealed <strong>the</strong> highest <strong>genetic</strong> variability in<br />
<strong>the</strong> microbial population studied,also achieving <strong>the</strong><br />
greatest discriminatory power. It also proved to be <strong>the</strong><br />
most efficient method,with <strong>the</strong> highest number <strong>of</strong><br />
effective alleles per assay. We also found <strong>the</strong> results <strong>of</strong><br />
<strong>SSR</strong> to be faster <strong>and</strong> easier to interpret than <strong>the</strong> o<strong>the</strong>r<br />
techniques studied,making it an ideal technique <strong>for</strong> use<br />
in <strong>the</strong> characterization <strong>and</strong> identification <strong>of</strong> S. cerevisiae<br />
strains. Successful <strong>SSR</strong> analysis,however,depends on<br />
<strong>the</strong> proper design <strong>and</strong> syn<strong>the</strong>sis <strong>of</strong> primers,requiring a<br />
considerable amount <strong>of</strong> ef<strong>for</strong>t in <strong>the</strong> selection <strong>of</strong><br />
polymorphic microsatellites that af<strong>for</strong>d specific amplifications.<br />
Our study benefited from an available panel <strong>of</strong><br />
six microsatellite loci <strong>and</strong> <strong>the</strong> appropriate primers<br />
needed <strong>for</strong> its specific amplification (Pe´ rez et al.,2001).<br />
In summary,<strong>SSR</strong> amplifications is a simple <strong>and</strong><br />
effective method,with a high degree <strong>of</strong> discrimination<br />
<strong>and</strong> reproducibility,that can be used in <strong>the</strong> identification<br />
<strong>and</strong> intraspecific differentiation <strong>of</strong> S. cerevisiae strains,a<br />
species <strong>of</strong> great importance in industrial fermentations.<br />
Acknowledgments<br />
This research was supported by grants SC94-126 from<br />
<strong>the</strong> Programa Sectorial I+D Agrario y Alimentario <strong>and</strong><br />
RM00-001 from <strong>the</strong> Accio´ n Estratégica ‘‘Conservacio´ n<br />
de los recursos gene´ ticos de interés agroalimentario’’ del<br />
Plan Nacional de Investigacio´ n Cientı´ fica,Desarrollo e<br />
Innovacio´ n Tecnolo´ gica (I+D+I) from <strong>the</strong> Instituto<br />
Nacional de Investigacio´ n y Tecnologı´ a Agraria y<br />
Alimentaria (INIA) (Spain).<br />
References<br />
Cenı´ s,J.L.,Sánchez Escribano,E.M.,1999. Evaluación de cuatro<br />
te´ cnicas genéticas de identificación (isoenzimas,<strong>RAPDs</strong>,microsate´<br />
lites y <strong>AFLPs</strong>) en variedades de uva de mesa. In: Identificación<br />
molecular de germoplasma de vid. Jornadas de Agronomía. IMIA,<br />
Comunidad de Madrid,pp. 129–144.<br />
Crouch,J.H.,Crouch,H.K.,Const<strong>and</strong>i,H.,Van Gysel,A.,Breyne,P.,<br />
Van Montagu,M.,Jarret,R.L.,Ortiz,R.,1999. <strong>Comparison</strong> <strong>of</strong><br />
PCR-based molecular marker analyses <strong>of</strong> Musa breeding populations.<br />
Mol. Breed. 5,233–244.<br />
deBarros Lopes,M.,Soden,A.,Henschke,P.A.,Langridge,P.,1996.<br />
PCR differentiation <strong>of</strong> commercial yeast strains using intro splice<br />
site primers. Appl. Environ. Microbiol. 62,4514–4520.
568<br />
deBarros Lopes,M.,Rainieri,S.,Henschke,P.A.,Langridge,P.,1999.<br />
AFLP fingerprinting <strong>for</strong> analysis <strong>of</strong> yeast <strong>genetic</strong> variation. Int. J.<br />
Syst. Bacteriol. 49,915–924.<br />
Dice,L.R.,1945. Measures <strong>of</strong> <strong>the</strong> amount <strong>of</strong> ecologic association<br />
between species. Ecology 26,297–302.<br />
Gallego,F.J.,Martínez,I.,1997. Method to improve reliability <strong>of</strong><br />
r<strong>and</strong>om amplified polymorphic DNA. Biotechniques 23,663–664.<br />
Gallego,F.J.,Pérez,M.A.,Martínez,I.,Hidalgo,P.,1998. Microsatellites<br />
obtained from database are useful to characterize<br />
Saccharomyces cerevisiae strains. Am. J. Enol. Vitic. 49 (3),<br />
350–351.<br />
Gonzalez Techera,A.,Jubany,D.,Carrau,F.M.,Gaggero,C.,2001.<br />
Differentiation <strong>of</strong> industrial wine yeast strains using microsatellite<br />
<strong>markers</strong>. Lett. Appl. Microbiol. 33,71–75.<br />
Hennequin,C.,Thierry,A.,Richard,G.F.,Lecointre,G.,Nguyen,<br />
H.V.,Gaillardin,C.,Dujon,B.,2001. Microsatellite typing as a<br />
new tool <strong>for</strong> identification <strong>of</strong> Saccharomyces cerevisiae strains.<br />
J. Clin. Microbiol. 39,551–555.<br />
Kreger Van Rij,N.J.W.,1984. The Yeast: A Taxonomic Study.<br />
Elsevier Science,Amsterdam 1082pp.<br />
Kurtzman,C.P.,Fell,J.W.,1998. The Yeasts: A Taxonomic Study.<br />
Elsevier Science,Amsterdam 1056pp.<br />
Legras,J.L.,Karst,F.,2003. Optimisation <strong>of</strong> interdelta analysis <strong>for</strong><br />
Saccharomyces cerevisiae strain characterisation. FEMS Microbiol.<br />
Lett. 221 (2),249–255.<br />
Mantel,N.A.,1967. The detection <strong>of</strong> disease clustering <strong>and</strong> a<br />
generalized regression approach. Cancer Res. 27,209–220.<br />
Miller,M.P.,1997. Tools <strong>for</strong> population <strong>genetic</strong> analysis (TFPGA)<br />
1.3: a Windows program <strong>for</strong> <strong>the</strong> analysis <strong>of</strong> allozyme <strong>and</strong> molecular<br />
population <strong>genetic</strong> data. Computer s<strong>of</strong>tware distributed by author.<br />
ARTICLE IN PRESS<br />
F. Javier Gallego et al. / Food Microbiology 22 (2005) 561–568<br />
Ness,F.,Lavallée,F.,Dubourdieu,D.,Aigle,M.,Dulau,L.,1993.<br />
Identification <strong>of</strong> yeast strains using <strong>the</strong> polymerase chain reaction.<br />
J. Sci. Food Agric. 62,89–94.<br />
Pejic,I.,Ajmone-Marsan,P.,Morgante,M.,Kozumplik,V.,<br />
Castiglioni,P.,Taramino,G.,Motto,M.,1998. Comparative<br />
analysis <strong>of</strong> <strong>genetic</strong> similarity among maize inbred lines detected by<br />
RFLPs,<strong>RAPDs</strong>,<strong>SSR</strong>s <strong>and</strong> <strong>AFLPs</strong>. Theor. Appl. Genet. 97,<br />
1248–1255.<br />
Pe´ rez,M.A.,Gallego,F.J.,Martínez,I.,Hidalgo,P.,2001. Detection,<br />
distribution <strong>and</strong> selection <strong>of</strong> microsatellites (<strong>SSR</strong>s) in <strong>the</strong> genome<br />
<strong>of</strong> <strong>the</strong> yeast Saccharomyces cerevisiae as molecular <strong>markers</strong>. Lett.<br />
Appl. Microbiol. 33,461–466.<br />
Powell,W.,Morgante,M.,Andre,C.,Hanafey,M.,Vogel,J.,Tingey,<br />
S.,Rafalski,A.,1996. The comparison <strong>of</strong> RFLP,RAPD,AFLP<br />
<strong>and</strong> <strong>SSR</strong> (microsatellite) <strong>markers</strong> <strong>for</strong> germplasm analysis. Mol.<br />
Breed. 2,225–238.<br />
Quesada,M.P.,Cenis,J.L.,1995. Use <strong>of</strong> r<strong>and</strong>om amplified polymorphic<br />
DNA (RAPD-PCR) in <strong>the</strong> characterization <strong>of</strong> wine yeast.<br />
Am. J. Enol. Vitic. 46 (2),204–208.<br />
Rohlf,F.J.,1993. NTSYS-pc: Numerical Taxonomy System <strong>and</strong><br />
Multivariate Analysis System Version 1.8. Exeter Publications,<br />
Setautek,New York.<br />
Van der Westhuizen,T.J.,Augustyn,O.P.H.,Pretorius,I.S.,1999. The<br />
value <strong>of</strong> long-chain fatty acid analysis,ramdomly amplified<br />
polymorphic DNA <strong>and</strong> electrophoretic karyotyping <strong>for</strong> <strong>the</strong><br />
characterization <strong>of</strong> wine yeasts. S. Afr. J. Enol. Vitic. 20 (1),3–10.<br />
Vos,P.,Hogers,R.,Bleeker,M.,Reijans,M.,Van der Lee,T.,<br />
Hornes,M.,Frijters,A.,Pot,J.,Peleman,J.,Kuiper,M.,Zabeay,<br />
M.,1995. AFLP: a new technique <strong>for</strong> DNA fingerprinting. Nucl.<br />
Acid Res. 23,4407–4414.