TAV AIRPORTS
TAV AIRPORTS
TAV AIRPORTS

You also want an ePaper? Increase the reach of your titles
YUMPU automatically turns print PDFs into web optimized ePapers that Google loves.
<strong>TAV</strong> <strong>AIRPORTS</strong><br />
Management Presentation<br />
January 2012<br />
September 2011<br />
1
2<br />
Contents<br />
Page<br />
Operational and Financial Highlights 1<br />
Appendix 26
3<br />
<strong>TAV</strong> Airports Holding Co.<br />
Airport<br />
Companies<br />
Atatürk<br />
Airport<br />
(100%)<br />
Esenboga<br />
Airport<br />
(100%)<br />
A Menderes<br />
Airport<br />
(100%)<br />
Gazipaşa<br />
Airport<br />
(100%)<br />
Tbilisi &<br />
Batumi<br />
(76%)<br />
Monastir<br />
& Enfidha<br />
(67%)<br />
Skopje &<br />
Ohrid<br />
(100%)<br />
<strong>TAV</strong><br />
Latvia<br />
(100%)<br />
Madinah<br />
Airport<br />
(33%)<br />
Service<br />
Companies<br />
ATÜ<br />
(50%)<br />
BTA<br />
(67%)<br />
HAVAŞ<br />
(65%)<br />
<strong>TAV</strong> O&M<br />
(100%)<br />
<strong>TAV</strong> IT<br />
(99%)<br />
<strong>TAV</strong><br />
Security<br />
(100%)<br />
TGS<br />
(50%)<br />
HAVAŞ /<br />
EUROPE<br />
(67%)
4<br />
Revenues<br />
9M11 (4)<br />
<strong>TAV</strong> Airports Overview<br />
Turkey<br />
Airports Duty Free<br />
� Istanbul Ataturk Airport<br />
(100%),<br />
� Ankara Esenboğa Airport<br />
(100%),<br />
� Izmir Adnan Menderes Airport<br />
(100%),<br />
� Gazipasa Airport (100%)<br />
Georgia<br />
� Tbilisi and Batumi Airports<br />
(76%)<br />
Tunisia<br />
� Monastir and Enfidha Airports<br />
(67%)<br />
Macedonia<br />
� Skopje and Ohrid Airports<br />
(100%)<br />
Saudi Arabia<br />
• Medinah Airport (33%)<br />
ATÜ (50%)<br />
� Largest duty free operator<br />
in Turkey<br />
� Partner with Unifree –<br />
owned by Heinemann,<br />
leading German travel<br />
retailer (Travel Value)<br />
� Operating in Turkey,<br />
Georgia, Tunisia,<br />
Macedonia and Latvia<br />
Food and<br />
Beverage<br />
BTA (67%)<br />
� Operating in Turkey,<br />
Georgia, Macedonia,<br />
andTunisia<br />
� Operates Istanbul Airport<br />
Hotel (131 rooms)<br />
� Total seating capacity of<br />
12.500 at 146 points<br />
� Bakery & pastry factory<br />
serving in Turkey<br />
� BTA Denizyollari (50%) (3)<br />
is the F&B operator of<br />
Istanbul Deniz Otobusleri<br />
(IDO)<br />
HAVAŞ (65%)<br />
Ground<br />
Handling<br />
� Major ground handler in<br />
Turkey with a c.65% (1)<br />
share<br />
� Operates in 22 airports in<br />
Turkey including Istanbul,<br />
Ankara, Izmir and Antalya<br />
� TGS (%50) (2) operates in<br />
Istanbul (AHL&SGA),<br />
Ankara, Izmir, Antalya and<br />
Adana<br />
� %67 partner of North Hub<br />
Services (HAVAS Europe),<br />
operating in Riga, Helsinki<br />
and Stockholm<br />
Notes: (1) Based on number of flights for 2010<br />
(2) TGS started operations as of 1 January, 2010<br />
(3) BTA Denizyollari will gradually took over the F&B operations<br />
(4) Revenues represent the proportional interest of these companies in <strong>TAV</strong> Airports (50% of ATÜ revenues) (before eliminations)<br />
Others<br />
O&M, IT and Security<br />
� <strong>TAV</strong> O&M (100%):<br />
Commercial area<br />
allocations & lounges, travel<br />
agency services<br />
� <strong>TAV</strong> IT (99%):<br />
Airport IT services<br />
� <strong>TAV</strong> Security (100%):<br />
Security service provider in<br />
Istanbul, Ankara , Izmir and<br />
Gazipasa<br />
� <strong>TAV</strong> Latvia (100%):<br />
Commercial area<br />
management in Riga Airport<br />
€381m €152m €60m €151m €45m
5<br />
Ownership Structure (as of 31 December, 2011)<br />
(5)<br />
40.3%<br />
Shareholder Structure Founding Shareholders<br />
(4)<br />
3.5%<br />
(3)<br />
4.0%<br />
(1)<br />
26.1%<br />
(2)<br />
26.1%<br />
2.Akfen Holding A.Ş. has 14,466,267 (3.98%) shares in the free float<br />
3. Sera Yapi Endustrisi ve Tic. Ltd. Sti. Has 446,544 (0.01%) shares in the free float<br />
- <strong>TAV</strong>HL effective free float is 40%<br />
1. Tepe Insaat Sanayi A.Ş.<br />
Turkish integrated conglomerate focused on infrastructure and<br />
construction<br />
2. Akfen Holding A.Ş.<br />
Holding company operating in the construction, seaport, REIT and<br />
energy sector<br />
3. Sera Yapi Endustrisi A.Ş.<br />
Focused on construction in Turkey & MENA region<br />
4. Other Non-floating (KIA)<br />
5. Other Free Float<br />
Other shareholders
6<br />
Strong Growing Presence in the Broader Region<br />
Asset overview / catchment area<br />
Enfidha<br />
Monastir<br />
Skopje<br />
Ohrid<br />
Istanbul<br />
Batumi<br />
Tbilisi<br />
Ankara<br />
Gazipaşa<br />
� <strong>TAV</strong> operates in Turkey’s 3 largest cities<br />
� Since IPO <strong>TAV</strong> has expanded into the broader region, winning<br />
concessions and/or BOTs in Tunisia, Macedonia, Turkey<br />
(Gazipaşa), Georgia (Batumi) and most recently Saudi Arabia<br />
(Medinah)<br />
Izmir<br />
2011 PAX (in millions)<br />
Source: DHMI.<br />
<strong>TAV</strong> operates in Turkey’s 3 largest cities<br />
<strong>TAV</strong> is the leading airport operator in the region (41% market share (*) in Turkey) and its airports/terminals handling 53m passengers in 2011<br />
* Source: DHMI.<br />
Medinah<br />
37.5<br />
<strong>TAV</strong><br />
No.1 Airport operator in Turkey<br />
12.8<br />
25.1<br />
Fraport /<br />
Turkish<br />
IC Holding<br />
8.5 8.5<br />
Limak / GMR<br />
AHL SAW Antalya / Ankara MAHB Izmir<br />
<strong>TAV</strong><br />
AHL<br />
SAW<br />
Antalya<br />
Ankara<br />
Izmir<br />
<strong>TAV</strong><br />
6
7<br />
<strong>TAV</strong> Traffic Performance<br />
<strong>TAV</strong> Passenger Figures (million) <strong>TAV</strong> Air Traffic Movements (‘000)<br />
Source: Turkish State Airports Authority (DHMI), Georgian Civil Aviation Authority, <strong>TAV</strong> Tunisie,<strong>TAV</strong> Macedonia<br />
FY 2011<br />
<strong>TAV</strong> Total Passenger<br />
Ataturk Airport Total Pasenger<br />
Airports 2009 2010 % 2011 %<br />
Istanbul Ataturk 29.8 32.1 8% 37.5 17%<br />
Int’l 18.4 20.3 11% 23.8 17%<br />
Dom. 11.4 11.8 3% 13.6 15%<br />
Ankara Esenboga 6.1 7.8 28% 8.5 10%<br />
Int’l 1.1 1.3 21% 1.4 4%<br />
Dom. 5.0 6.4 29% 7.1 11%<br />
Izmir A.Mend. (int’l) 1.7 2.1 28% 2.5 16%<br />
Tunisia (Monastir & Enfidha) 3.8 3.92 4% 2.3 -42%<br />
Georgia (inc. Batumi) 0.77 0.91 18% 1.19 31%<br />
Macedonia(Skopje&Ohrid)** 0.64 0.73 14% 0.84 15%<br />
<strong>TAV</strong> Total *** 42.1 47.6 13% 52.8 11%<br />
Int’l 25.7 29.3 14% 31.9 9%<br />
Dom. 16.4 18.3 11% 20.8 14%<br />
Number of Passengers Growth<br />
52.8 m<br />
37.5 m<br />
Airports 2009 2010 % 2011 %<br />
Istanbul Ataturk 265.8 273.7 3% 305.8 12%<br />
Int’l 169.9 178.8 5% 199.9 12%<br />
Dom. 95.8 94.9 -1% 105.9 12%<br />
Ankara Esenboga 51.3 63.4 24% 72.2 14%<br />
Int’l 10.1 11.7 16% 11.9 1%<br />
Dom. 41.2 51.6 25% 60.4 17%<br />
Izmir A.Mend. (int’l) 13.1 16.1 23% 17.3 7%<br />
Tunisia (Monastir & Enfidha) 30.4 31.8 5% 20.8 -35%<br />
Georgia (inc. Batumi) 15.6 18.7 20% 23.1 23%<br />
Macedonia(Skopje&Ohrid)** 12.8 12.8 0% 11.9 1%<br />
<strong>TAV</strong> Total *** 376.2 416.6 11% 451.2 9%<br />
Int’l 237.4 267.9 13% 281.1 5%<br />
Dom. 138.8 148.7 7% 170.0 14%<br />
** Operation commencement date: March 01, 2010<br />
*** <strong>TAV</strong> 2009 traffic figures do not include Macedonia
8<br />
Tunisian Airports<br />
Source: Eurocontrol<br />
0<br />
-10<br />
-20<br />
-30<br />
-40<br />
-50<br />
-60<br />
-70<br />
-80<br />
-9<br />
-75<br />
Traffic is down by 42% compared to 2010.<br />
-48<br />
Tunisia % Traffic Change vs 2010<br />
Jan Feb Mar Apr May Jun Jul Aug Sept Oct Nov Dec<br />
-41<br />
-53<br />
-46<br />
-42<br />
-40<br />
Very fast recovery is expected in 2012<br />
-35<br />
Tunisia 2011 2012<br />
High case -33% 38%<br />
Base case -38% 42%<br />
Low case -43% 45%<br />
-41<br />
-33<br />
-23
9<br />
New Project Wins<br />
Operations Right<br />
Concession Expiry 2032<br />
<strong>TAV</strong> Stake 100%<br />
New Domestic Terminal<br />
Izmir Airport International Terminal, CIP, Domestic<br />
Terminal and the auxiliary structures<br />
Total Planned Invesment : €250mn<br />
Expected Start: 2012<br />
Total Area Increase: 28.500 sqm to 204.500 sqm<br />
Pax Fees €15 per international pax and €3 per domestic<br />
No volume guarantee, except for existing<br />
Volume Guarantee international terminal guarantee valid until January<br />
2015<br />
Concession Rent<br />
Izmir tender<br />
Total concession rent for entire operating period<br />
(until 2032) €610mn (excluding VAT)<br />
Concession fee payment schedule :<br />
2% to be paid at the signature date (€12m)<br />
3% to be paid 3 months from contract signing date<br />
(€18m)<br />
First instalment to be paid on 1 January 2013<br />
(€29mn) and afterwards annually on first business<br />
day of each year.<br />
BTA recent win: IDO<br />
� BTA awarded F&B operations of İstanbul Deniz Otobüsleri AS<br />
(IDO, with c50m pax) and formed a 50-50 JV with TASS<br />
(operator of IDO)<br />
� BTA started to gradually take over the current F&B sales points<br />
in September 2011<br />
� BTA will serve at 82 outlets in 21 Terminals, 17 Vehicle Ferries<br />
and 8 Fast Ferries, comprising;<br />
� 50 BTA Owned and operated Sales Points<br />
� 7 International Fast Food Restaurant (Mc Donald's)<br />
� 22 International Coffee Shop Chain (Nero)<br />
� 3 Other Tenants
10<br />
New Project Wins<br />
Medinah Tender<br />
Operations Right Prince Mohammed Bin Abdulaziz Airport structures<br />
Concession Expiry 2037<br />
<strong>TAV</strong> Stake 33%<br />
New Terminal<br />
Pax Fees<br />
Total Planned Invesment : $1-1.5bn<br />
Expected Start: first half of 2012<br />
Volume Guarantee No volume guarantee<br />
Concession Rent<br />
Total terminal capacity will Increase from 4mn to 8mn<br />
SAR 80 from both departing and arriving<br />
international pax. Pax charges will increase as per<br />
cumulative CPI in Saudi Arabia every three years<br />
Total concession rent for entire operating period (until<br />
2037): 54.5% of total revenues will be paid.<br />
The concession charge will be reduced to 27.3 % for<br />
the first two years that follow the completion of the<br />
construction.<br />
Medinah Mecca<br />
Jeddah<br />
2.330<br />
3.053<br />
3.407<br />
3.811<br />
3.254<br />
2006 2007 2008 2009 2010
11<br />
Concession Overview<br />
Airport Type/Expire <strong>TAV</strong> Stake Scope<br />
Istanbul Ataturk<br />
Ankara Esenboga<br />
Izmir A.Menderes<br />
Gazipasa<br />
Tbilisi<br />
Concession<br />
(Jan. 2021)<br />
BOT<br />
(May 2023)<br />
BOT<br />
(Jan. 2015)<br />
Concession<br />
(May 2034)<br />
BOT<br />
(Feb. 2027)<br />
2011<br />
Pax(mppa)<br />
100% Int'l+Dom. 37.5<br />
fee/pax Int'l fee/pax dom.<br />
US$15 ,<br />
€ 2.5<br />
(Transfer)<br />
100% Int'l+Dom. 8.5 15 3<br />
100% Int'l +Dom 8.5 15 3<br />
Volume<br />
Guarantee<br />
3 No<br />
0,6 M. Dom. ,<br />
0,75 Int'l for<br />
2007+%5 p.a<br />
1.0m Int’l for<br />
2006 + %3<br />
p.a.<br />
Concession<br />
Fee<br />
$140m/yr +<br />
VAT<br />
Net Debt*<br />
€177m<br />
- €104m<br />
€29m starting<br />
from 2013 (6)<br />
€10m<br />
100% Int'l+Dom. - 5 TL4 No $50.000+VAT €16m<br />
76% Int'l+Dom. 1.06 US$22 US$6 No - €14m<br />
Batumi<br />
BOT<br />
(Aug. 2027)<br />
76% Int'l+Dom. 0.13 US$12 US$7 No - -<br />
Monastir&Enfidha BOT+Concession<br />
67% Int'l+Dom. 2.3 9 1 No<br />
11-26% of<br />
revenues from €360m<br />
(May 2047) 2010 to 2047<br />
Skopje & Ohrid<br />
Medinah<br />
BOT+Concession<br />
(March 2030)<br />
BTO+Concession<br />
(2037)<br />
100% Int'l+Dom. 0.84<br />
€17.5 in<br />
Skopje, €16.2<br />
in Ohrid<br />
- No<br />
15% of the<br />
gross annual<br />
turnover **<br />
33% Int'l+Dom. 3.3 SAR 80*** - No 54.5%(4) n.a.<br />
1) As of 30 September 2010<br />
2) The concession fee is going to be 15% of the gross annual turnover until the number of passengers using the two airports reaches 1 million, and when the number of passengers exceeds 1 million,<br />
this percentage shall change between 4% and 2% depending on the number of passengers <strong>TAV</strong> Gazipaşa shall make a yearly rent payent of US$ 50,000 + VAT as a fixed amount, until the end of the operation period;<br />
as well as a share of 65% of the net profit to the DHMI.<br />
3) SAR 80 from both departing and arriving international pax. Pax charge will be increase as per cumulative CPI in Saudi Arabia every three years<br />
4) The concession charge will be reduced to 27.3 % for the first two years that follow the completion of the construction.<br />
5) Only international terminal pax<br />
6) Cash Basis<br />
€48m
12 12<br />
<strong>TAV</strong> vs Other Airport Operators<br />
SHAREHOLDER STRUCTURE<br />
BUSINESS MODEL<br />
PORTFOLIO OWNERSHIP<br />
CAPITAL EXPENDITURE<br />
� No state stake<br />
� No foreign ownership limit<br />
� Integrated business model with service<br />
companies active in every step of the<br />
value chain<br />
� Ownership of the operational rights<br />
of the airport portfolio over a<br />
predetermined period through BOTs<br />
and concessions<br />
� If BOT, high upfront capex with<br />
minimal or no mandatory capex<br />
throughout the operation period<br />
� If concession, annual concession<br />
payment<br />
<strong>TAV</strong> Airports Counterparts<br />
� Active state participation<br />
� Foreign ownership limits<br />
� Active mainly in airport/terminal<br />
management with some participation<br />
in airport services<br />
� Mostly own the airport portfolio<br />
� Regular capital expenditure with bulk<br />
investments time-to-time
13<br />
Financial Overview<br />
(in mn €)*<br />
9M11 9M10<br />
∆<br />
y-o-y 2010 2009<br />
∆<br />
y-o-y<br />
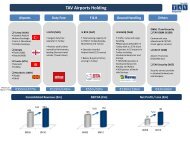
Revenues 666 594 12% 785 640 23%<br />
EBITDA 205 172 19% 212 167 27%<br />
EBITDA margin 30.8% 29.0% 1.7ppt 27.0% 26.2% 0.9 ppt<br />
Net Income 35.2 33.5 5% 52 51 0%<br />
Cash flow from operations 241 150 61% 336 210 60%<br />
Capex (92) (72) 28% (119) (312) -62%<br />
Free Cash Flow 149 78 91% 217 (102) nm<br />
Shareholders’ Equity 452 410 10% 438 372 18%<br />
Net Debt 832 890 -7% 821 941 -13%<br />
Average number of employees 19,847 17,090 16% 17,535 12,194 44%<br />
Number of passengers (mn) 39.7 36.0 10% 47.6 42.1 13%<br />
- International 24.1 22.3 8% 29.3 25.7 14%<br />
- Domestic 15.6 13.7 14% 18.3 16.4 11%<br />
* Construction revenue and construction expenditure are excluded while computing the operational performance in the table.<br />
** Figures are adjusted by including guaranteed passenger fee revenues from airports in Ankara and Izmir<br />
Consolidated Revenue (€m) EBITDA (€m) Net Profit (€m)<br />
666<br />
12%<br />
594<br />
9M11 9M10<br />
205<br />
19%<br />
172<br />
9M11 9M10<br />
35<br />
5%<br />
33<br />
9M11 9M10
14<br />
Revenue & EBITDA<br />
Revenue breakdown (9M11) Revenue breakdown (9M10)<br />
6%<br />
22%<br />
15%<br />
26%<br />
15%<br />
25%<br />
32%<br />
Duty-free<br />
Aviation<br />
Ground-handling<br />
F&B<br />
Other<br />
EBITDA Breakdown (9M11) EBITDA Breakdown (9M10)<br />
7% 3%<br />
0%<br />
50%<br />
Istanbul<br />
Other Airports<br />
HAVAŞ<br />
ATU<br />
BTA<br />
Other Services<br />
6%<br />
20%<br />
3%<br />
5%<br />
18%<br />
16%<br />
29%<br />
0%<br />
26%<br />
30%<br />
46%<br />
Duty-free<br />
Aviation<br />
Ground-handling<br />
F&B<br />
Other<br />
Istanbul<br />
Other Airports<br />
HAVAŞ<br />
ATU<br />
BTA<br />
Other Services
15<br />
OPEX Breakdown<br />
35%<br />
49%<br />
20%<br />
9M11 9M10<br />
3% 8%<br />
10%<br />
14%<br />
4% 11%<br />
20%<br />
11%<br />
16%<br />
Catering<br />
Services rendered<br />
D&A<br />
Duty free<br />
Other<br />
Concession rent<br />
Personnel<br />
34%<br />
21%<br />
3% 7%<br />
Excluding concession rent and D&A expenses<br />
Catering<br />
Services rendered<br />
Duty free<br />
Other<br />
Personnel<br />
49%<br />
4% 9%<br />
9%<br />
16%<br />
23%<br />
10%<br />
15%<br />
Catering<br />
Services rendered<br />
D&A<br />
Duty free<br />
Other<br />
Concession rent<br />
Personnel<br />
Catering<br />
Services rendered<br />
Duty free<br />
Other<br />
Personnel
16<br />
CAPEX<br />
(€m)<br />
18<br />
15<br />
20<br />
67<br />
39<br />
Enfidha Airport capex<br />
62<br />
68<br />
45<br />
113<br />
88<br />
1Q07 2Q07 3Q07 4Q07 1Q08 2Q08 3Q08 4Q08 1Q09 2Q09 3Q09 4Q09 1Q10 2Q10 3Q10 4Q10 1Q11 2Q11 3Q11<br />
property and equipment airport operation right intangible assets<br />
55<br />
56<br />
25<br />
35<br />
17<br />
42<br />
21<br />
42<br />
29
17<br />
Maturity Profile of Debt<br />
201<br />
146<br />
129 129 123<br />
1- years 2-years 3- years 4- years 5- years 5+ years<br />
480<br />
Others<br />
<strong>TAV</strong> Holding - solo<br />
Havaş<br />
TGS<br />
<strong>TAV</strong> Gazipaşa<br />
<strong>TAV</strong> Macedonia<br />
ATU<br />
<strong>TAV</strong> Tbilisi<br />
<strong>TAV</strong> Izmir<br />
<strong>TAV</strong> Esenboğa<br />
<strong>TAV</strong> Tunisie<br />
<strong>TAV</strong> Istanbul
18<br />
Debt Structure<br />
NET DEBT<br />
€(million)<br />
30 September 2011 30 June 2011 31 March 2011 31 December 2010<br />
Airports 729 798 784 697<br />
Istanbul 177 243 242 160<br />
Ankara 104 109 110 110<br />
Izmir 10 20 26 26<br />
Tunisia 360 358 349 343<br />
Gazipasa 16 16 17 16<br />
Tbilisi 14 17 19 24<br />
Batumi -0 0 0 0<br />
Macedonia 48 35 22 18<br />
Services 104 109 136 125<br />
ATU (50%) 19 20 26 21<br />
BTA -5 (2) (5) (3)<br />
Havas 59 76 76 76<br />
Others* 31 16 40 32<br />
Total 832 907 920 822<br />
* Including Holding Co.
19<br />
Revenue by country (9M11)<br />
2%<br />
Latvia<br />
1%<br />
2%<br />
91%<br />
5%
20<br />
Currency exposure<br />
TRY<br />
32%<br />
Revenues (1) (9M11) Op. Expenses (9M11) (1)(2)<br />
Total: €788m Total: €632m<br />
$<br />
15%<br />
Other<br />
4%<br />
€<br />
49%<br />
Concession rent payment (9M11) Gross Debt (9M11A)<br />
Total: €102m Total: €1,214m<br />
€<br />
9%<br />
$<br />
91%<br />
(1) Combined figures, pre-eliminations.<br />
(2) Includes concession rent expenses (€102m) and depreciation (€48m)<br />
TRY<br />
44%<br />
Other<br />
6%<br />
$<br />
3%<br />
TRY<br />
1%<br />
$<br />
17%<br />
Other<br />
0%<br />
€<br />
33%<br />
€<br />
96%<br />
20
21<br />
2010 Financial Summary<br />
(€ million) Revenues EBITDA (*) EBITDA (*) Margin Net Debt<br />
Airports 471,0 170,2 36% 697<br />
Istanbul** 318,6 110,7 35% 160<br />
Ankara 37,9 15,3 40% 110<br />
Izmir 32,7 19,4 59% 26<br />
Tunisie 45,7 12,2 27% 343<br />
Gazipasa 0,0 (1,2) nm 16<br />
Tbilisi & Batumi 22,0 11,3 51% 23<br />
Macedonia 14,1 2,5 18% 18<br />
Services 469 43,5 9% 125<br />
ATU (50%) 170 15,4 9% 21<br />
BTA 75,0 7,2 10% (3)<br />
Havaş 163,5 25,5 16% 76<br />
Others 60,7 (4,6) nm 32<br />
Total 940 213,7 23% 822<br />
Eliminations (155) (1,5) -<br />
Consolidated 785 212,2 27% 822<br />
Note: Figures below are adjusted by including guaranteed passenger fee revenues from airports in Ankara and Izmir<br />
** <strong>TAV</strong> Istanbul EBITDAR: €228m (margin: 72%)<br />
<strong>TAV</strong> Airports Consolidated – 2010
22<br />
9M11 Comparative Financials<br />
<strong>TAV</strong> Airports Consolidated – 9M11<br />
REVENUES<br />
(€ million) 9M11 9M10 Change<br />
Airports 381 355 7%<br />
Istanbul 260 238 9%<br />
Others 120 118 3%<br />
Services 407 351 16%<br />
ATU (50%) 152 123 23%<br />
BTA 60 55 9%<br />
HAVAŞ 151 130 16%<br />
Others 45 43 4%<br />
Total 788 706 12%<br />
Eliminations (122) (112) 9%<br />
Consolidated 666 594 12%<br />
EBITDA<br />
(€ million) 9M11 9M10 Change<br />
Airports 155 137 13%<br />
Istanbul 102 84 22%<br />
Others 53 53 0%<br />
Services 50 37 38%<br />
ATU (50%) 14 10 46%<br />
BTA 6 6 -4%<br />
HAVAŞ 31 29 7%<br />
Others (1) (8) n.m<br />
Total 206 173 19%<br />
Eliminations (1) (1) -30%<br />
Consolidated 205 172 19%<br />
Note: Figures above are adjusted by including guaranteed passenger fee revenues from airports in Ankara and Izmir<br />
** Regarding BTA, there is a one-off expense of €618K in the second quarter of 2011, related with the tax court case.
23<br />
Growth Rates of <strong>TAV</strong> Airports in 5 years<br />
23<br />
402<br />
30<br />
508<br />
Passengers (m)<br />
Revenue (m €)<br />
627<br />
640<br />
785<br />
2006 2007 2008 2009 2010<br />
41<br />
2006 2007 2008 2009 2010<br />
42<br />
48<br />
CAGR (2006-10)<br />
20%<br />
CAGR (2006-10)<br />
18%<br />
8.146<br />
29<br />
77<br />
Number Of Employees<br />
9.473<br />
11.289<br />
EBITDA (m €)<br />
141<br />
12.194<br />
167<br />
17.535<br />
2006 2007 2008 2009 2010<br />
212<br />
2006 2007 2008 2009 2010<br />
CAGR (2006-10)<br />
21%<br />
CAGR (2006-10)<br />
64%
24<br />
Appendix<br />
Page<br />
Overview 27<br />
Operations 37<br />
References 61
25<br />
Investment Highlights<br />
Attractive market with<br />
strong growth prospects<br />
Leading airport operator<br />
with diversified portfolio<br />
Strong financial<br />
performance and cash<br />
flow generation<br />
“Platform play”<br />
� Turkey is the fastest growing aviation market in Europe<br />
� Passenger growth of 15% p.a. during 2002-2011<br />
� Projected passenger growth of 11% p.a. during 2009-2023 (1)<br />
� Access to fast growing MENA region<br />
� Istanbul is the most efficient hub for Europe, MENA Region (2)<br />
� Diversified, balanced portfolio with leading market positions<br />
� #1 airport terminal operator in Turkey<br />
� 12 airports operating in Turkey, Georgia, Tunisia, Macedonia, Saudi Arabia and Latvia (large<br />
catchment areas)<br />
� Strong momentum with EBITDA posting 64% CAGR between 2006 and 2010<br />
� High earnings visibility given clear / agreed regulatory framework<br />
� Proven track record of growth and profitability with attractive organic growth prospects<br />
� High financial returns and cash flow generation given fixed cost base (operational leverage) and<br />
minimal ongoing capex<br />
� Well-positioned to benefit from further organic and inorganic growth<br />
(1) Source: Turkey’s Ministry of Transport<br />
(2) Determining Hub Efficiency in Europe, MIiddle East and North Afirca a comparative study, E. Nur Günay, Şükrü Nenem
26<br />
Worldwide traffic outlook up to 2030<br />
North America<br />
2011–2030 2021–2030<br />
3.4% 3.1%<br />
Source: Airbus Global Markets Outlook (2011-2030).<br />
Latin America<br />
2011–2030 2021–2030<br />
6.9% 5.2%<br />
Passenger traffic growth by airline domicile<br />
The region where <strong>TAV</strong> operates is projected to experience the highest passenger traffic growth worldwide over the next 20 years<br />
Europe<br />
2011–2030 2021–2030<br />
4.2% 3.8%<br />
Africa<br />
2011–2030 2021–2030<br />
6.3% 4.9%<br />
World<br />
2011–2030 2021–2030<br />
5.4% 4.3%<br />
Middle East<br />
2011–2030 2021–2030<br />
9.8% 5.0%<br />
CIS<br />
2011–2030 2021–2030<br />
5.6% 4.3%<br />
Asia-Pacific<br />
2011–2030 2021–2030<br />
6.6% 4.9%<br />
26
27<br />
Turkey – Fastest Growing Aviation Market in Europe<br />
Comments<br />
� The Turkish aviation market has historically showed strong growth and resilience<br />
� Penetration is still low vs. Western European countries (passenger km / capita:<br />
Turkey 0.5, Italy 0.8, Spain 1.6, Germany 2.1) (1)<br />
� Limited alternative transport infrastructure in a very large country<br />
� Transportation junction between Europe, North Africa and Asia<br />
� Young population, average age is 31 years (versus Spain – 41 years, and UK –<br />
39 years) and 50% of its population is currently younger than 29 years<br />
� Visa policies are currently changing with more countries having eliminated or<br />
simplified the visa process with Turkey<br />
� From 2000 to 2009, Turkey was the fastest growing tourist country in the world. As<br />
a result, Turkey is now the 7th largest tourist destination in the world<br />
� Turkey has a number of attractive tourist destinations, e.g. Antalya, Istanbul<br />
(largest business centre in the region), Mugla (Bodrum and Dalaman) and Izmir<br />
Source: Euromonitor, IATA.<br />
(1) Based on thousands km per capita.<br />
Traffic outlook<br />
2011–2030 World 4.2% pax – 5.1% CAGR in RPK<br />
2010–2030 World 4.8% RPK<br />
2010–2030 World 4.7% CAGR in RPK<br />
2009–2023 Turkey 11% CAGR in Passengers<br />
Turkey – one of the fastest growing airline markets<br />
International Domestic<br />
CAGR<br />
CAGR<br />
Rank Country<br />
2009–2013 (%) Country<br />
2009–2013 (%)<br />
1 Algeria 7.8 China 11.8<br />
2 Kazakhstan 7.6 Turkey 8.4<br />
3 Romania 7.3 Philippines 7.0<br />
4 Egypt 6.9 Brazil 6.7<br />
5 Lebanon 6.8 Iran 6.6<br />
6 Latvia 6.7 Greece 5.7<br />
7 Turkey 6.3 Argentina 5.5<br />
8 Ukraine 6.1 Vietnam 4.9<br />
9 Indonesia 6.0 Italy 4.6<br />
10 Russian Federation 6.0 India 4.3<br />
World total 3.2 World total 3.5<br />
Source: IATA.<br />
Note: Only those countries with traffic in excess of 2 million passengers per annum have been included.<br />
Intl. tourist arrivals – 10 largest countries ranked by growth<br />
11.5% 9.8%<br />
Source: UNWTO.<br />
The resilient Turkish aviation market is set to continue to grow rapidly in the next few years<br />
Turkey<br />
Malaysia<br />
5.6%<br />
China<br />
2.7% 2.1% 1.3% 0.8% 0.5% 0.5%<br />
Germany<br />
UK<br />
Spain<br />
USA<br />
Italy<br />
Mexico<br />
(0.4%)<br />
France<br />
2.9%<br />
World
28<br />
Pax, Mn.<br />
34 34<br />
31<br />
25 25<br />
9 9 14<br />
45<br />
Domestic Intl'l total<br />
57<br />
36<br />
31 34<br />
21<br />
65<br />
38<br />
32<br />
70<br />
79<br />
44 41 44<br />
36<br />
86<br />
51 53<br />
103<br />
58 59<br />
2002 2003 2004 2005 2006 2007 2008 2009 2010 2011<br />
�2nd largest country in Europe in terms of population:<br />
72.5m(1)<br />
Growth of the Turkish Aviation Market<br />
�In 2010, foreign visitors reached 29m(2)<br />
Source: DHMI, (1)Turkstat, (2)Ministry Culture and Tourism, (3)Ministry of Transport<br />
117<br />
110<br />
162<br />
202<br />
Deregulation of the domestic market in 2003<br />
Number of Aircrafts in Turkey<br />
240<br />
259<br />
250<br />
�Limited alternative transport infrastructure<br />
270<br />
299<br />
332<br />
2002 2003 2004 2005 2006 2007 2008 2009 2010<br />
�Aircraft number in Turkey expected to reach 750 in 2023(3)
29<br />
Turkish Aviation Market and <strong>TAV</strong> Airports<br />
Total Passenger Traffic of <strong>TAV</strong> Airports<br />
by year (mn)<br />
2002-11<br />
CAGR: 22%<br />
9 9 9 10<br />
17<br />
23<br />
2001 2002 2003 2004 2005 2006 2007 2008 2009 2010 2011<br />
30<br />
41<br />
42<br />
48<br />
53<br />
Total Passenger Traffic of Turkish Aviation Market<br />
by year (mn)<br />
34 34<br />
2002-11<br />
CAGR: 15%<br />
45<br />
57<br />
65<br />
70<br />
79<br />
86<br />
103<br />
117<br />
2002 2003 2004 2005 2006 2007 2008 2009 2010 2011
30<br />
2009<br />
Growth Rates of Pax Number in Selected Airports<br />
<strong>TAV</strong> 3%<br />
2010<br />
<strong>TAV</strong> 13%<br />
Source: ACI<br />
<strong>TAV</strong><br />
Airports Fraport World<br />
3<br />
13<br />
<strong>TAV</strong><br />
Airports<br />
-3 -3<br />
9<br />
Aeroports<br />
de Paris BAA Europe AENA Schiphol<br />
6 6<br />
-5 -5<br />
-6<br />
4 4<br />
-8 -8<br />
Fraport World AENA Europe Schiphol Aeroports<br />
de Paris<br />
0 -3<br />
BAA
31<br />
Favorable Economic and Demographic Backdrop<br />
Flows adding most movements, 2017 v 2010.<br />
Source: Eurocontrol<br />
�Substantial market size<br />
� 6th largest economy in Europe<br />
�16th largest economy in the world<br />
� Expected to beat the market<br />
9,0<br />
4,4<br />
� Sizable population with favorable<br />
demographics<br />
� 2 nd largest population in Europe<br />
Source: IMF<br />
2010 2011<br />
3,7<br />
3,1<br />
1,7<br />
1,5<br />
Turkey Emerging Europe EURO Area<br />
8% 15%<br />
64% 50%<br />
28%<br />
35%<br />
Turkey EU<br />
60+ 15-60 0-14<br />
GDP Growth Rate
32<br />
Tourism<br />
Tourist Arrivals increased by 6% in 2010 International Tourist Arrivals by Country<br />
Countries 2010 2009 Change<br />
Germany 4,4 4,5 -2%<br />
Russia 3,1 2,7 15%<br />
UK 2,7 2,4 10%<br />
Iran 1,9 1,4 36%<br />
Bulgaria 1,4 1,4 2%<br />
Georgia 1,1 1,0 12%<br />
Netherlands 1,1 1,1 -5%<br />
France 0,9 0,9 0%<br />
Syria 0,9 0,5 76%<br />
Italy 0,7 0,6 6%<br />
Other 10,5 10,5 0%<br />
TOTAL 28,6 27,1 6%<br />
Source : Ministry of Culture and Tourism<br />
6% Turkey # 7<br />
Countries 2000 2005 2006 2007 2008 2009 2010 09/08 10/09<br />
1-France 77,2 75 77,9 80,9 79,2 76,8 76,8 -3,0 0<br />
2-USA 51,2 49,2 51 56 57,9 55,0 59,7 -5,1 8,7<br />
3-China 31,2 46,8 49,9 54,7 53,0 50,9 55,7 -4,1 9,4<br />
4-Spain 46,4 55,9 58 58,7 57,2 52,2 52,7 -8,8 1,0<br />
5-Italy 41,2 36,5 41,1 43,7 42,7 43,2 43,6 1,2 0,9<br />
6-UK 23,2 28 30,7 30,9 30,1 28,2 28,1 -6,4 -0,2<br />
7-Turkey 9,6 20,3 18,9 22,2 25,0 25,5 27,0 2,0 5,9<br />
8-Germany 19 21,5 23,6 24,4 24,9 24,2 26,9 -2,7 10,9<br />
9-Malaysia 10,2 16,4 17,5 21 22,1 23,6 24,6 7,2 3,9<br />
10-Mexico 20,6 21,9 21,4 21,4 22,6 21,5 22,4 -5,2 4,4<br />
World 682 801 846 900 919 882 940 -3,8 6,6<br />
Source :UNWTO
33<br />
Earnings Visibility<br />
Landside<br />
Airside<br />
Revenues<br />
Ground<br />
Handling<br />
AERONAUTICAL NON-AERONAUTICAL<br />
Agreed passenger service charge of airports /<br />
terminals depending on project<br />
Ankara and Izmir have revenue guarantees<br />
(fixed PSC and volume growth p.a.)<br />
Check-in counter, bridge<br />
Passenger & ATM growth is the main driver<br />
Parking, Landing and lighting fees<br />
ATM growth is main driver<br />
Ramp, passenger services and traffic<br />
ATM growth and aircraft type are the<br />
main drivers<br />
Notes: Passenger service charges apply to departing passengers only<br />
Duty Free<br />
Other<br />
Duty Free available to all international<br />
inbound and outbound passengers<br />
Increased number of shops, improved<br />
selection of products and higher<br />
penetration<br />
Catering, car park, advertising, area<br />
allocation, lounge services
34<br />
Revenue sources<br />
Turkey<br />
Tunisia<br />
Georgia<br />
Macedonia<br />
Aeronautical Charges Non-aeronautical Charges<br />
Passenger Fee Ground Handling Landing Parking Fuel Duty Free F&B Car Park<br />
Istanbul X X X X X<br />
Esenboga X X X X X<br />
Izmir X X X X X<br />
Gazipasa X X X X X X X X<br />
Enfidha X X X X X X X X<br />
Monastir X X X X X X X X<br />
Tbilisi X X X X X X X X<br />
Batumi X X X X X X X X<br />
Skopje X X X X X X X X<br />
Ohrid X X X X X X X X<br />
Latvia Riga X X<br />
Saudi Arabia Madinah X X X X X X X X<br />
BTA started operations in Istanbul Ataturk Airport Domestic Terminal starting from July 2010<br />
ATU will start operations in Monastir starting from July 2014<br />
BTA will start operations in Monastir starting from 2018
35<br />
Turkey – Strong Economic Fundamentals<br />
Comments<br />
� 2nd largest country in Europe (>70m people)<br />
� 6th largest economy in Europe; 16th largest economy in the world (by<br />
GDP)<br />
� Nominal GDP growth of 9.0% p.a. over the last five years, and recorded<br />
8.2% real GDP growth in 2010, well ahead of EU 27 average of 1.8%<br />
and Spain of (0.2%)<br />
� Despite this, GDP per capita is still one of the lowest in Europe<br />
� The Turkish economy has one of the lowest public debt levels in Europe<br />
� Demographics support further market growth in the long term<br />
� 64% of population between ages of 15-60, 28% between 0-14 and<br />
8% above 60<br />
� Passport ownership still in the low teens<br />
� 3.9 million Turkish immigrants living in Europe offer a resilient traffic<br />
flow<br />
Source: EIU.<br />
Greece<br />
100%<br />
Italy<br />
European public debt levels (2010)<br />
(Total debt as % of GDP) (US$ in thousands)<br />
30.6<br />
27.3<br />
142%<br />
23.7<br />
Source: EIU.<br />
82%<br />
Belgium<br />
75%<br />
France<br />
73%<br />
Hungary<br />
69%<br />
UK<br />
54%<br />
Germany<br />
49%<br />
Spain<br />
35%<br />
Turkey<br />
27%<br />
Netherlands<br />
(US$ in billions)<br />
Turkish GDP growth<br />
1.012<br />
943<br />
877<br />
730 742 798<br />
647<br />
615<br />
483<br />
531<br />
1.083<br />
8.4%<br />
6,9% 4,7% 0,7%<br />
4,6%<br />
4,5% 4,1% 4,1% 4,0%<br />
8,2%<br />
(4.7%)<br />
GDP per capita (2010)<br />
Strong historic GDP growth trajectory, but still significant upside potential in GDP per capita<br />
1.200<br />
800<br />
400<br />
0<br />
2005A<br />
2006A<br />
2007A<br />
2008A<br />
Nominal GDP Real GDP growth (%)<br />
Source: Datamonitor, IMF.<br />
Note: 2011–2015E based on IMF forecasts.<br />
Upside potential to<br />
closest peer<br />
10.4<br />
Turkey<br />
Spain<br />
Source: EIU, World Bank and IMF.<br />
Greece<br />
Slovenia<br />
2009A<br />
2010A<br />
18.3 16.1 13.7 12.9 12.3 10.7 10.4<br />
Czech<br />
Republic<br />
Slovakia<br />
Croatia<br />
Hungary<br />
Poland<br />
2011E<br />
Latvia<br />
2012E<br />
Russia<br />
2013E<br />
Romania<br />
7.5<br />
2014E<br />
Bulgaria<br />
6.3<br />
Serbia<br />
2015E<br />
5.2 4.3<br />
Bosnia<br />
15%<br />
10%<br />
5%<br />
0%<br />
(5%)<br />
Ukraine<br />
3.0
36<br />
� Largest in the region<br />
Istanbul Atatürk Airport (100%)<br />
� Main hub and home base for Turkish Airlines<br />
� One of the fastest growing airports in Europe & 39 th busiest<br />
airport in the world<br />
� Revenue of €319 million in 2010<br />
� €228 million EBITDAR in 2010, implies 72% margin<br />
� €2.5 Transfer Fee (from Int’l Pax)<br />
� Terminal Expansion completed in 2010<br />
� Among “50 Best Travel Centers” list in Monocle, as a “Magnet<br />
for Transit Flights.”<br />
14,0%<br />
7,7% 2,8%<br />
11<br />
Passenger traffic 2002 - 2011 (m)<br />
int'l Domestic<br />
2002 2003 2004 2005 2006 2007 2008 2009 2010 2011<br />
Source: DHMI<br />
Note: 2009 and 2008 are not comparable with previous periods<br />
75,4%<br />
12<br />
16<br />
19<br />
21<br />
Air Traffic Movement per airline (2011)<br />
Domestic International<br />
TURKISH AIRLINES<br />
ONUR AIR<br />
ATLAS JET<br />
OTHER<br />
23<br />
29<br />
2,3%<br />
2,3%<br />
30<br />
27,0%<br />
32<br />
68,4%<br />
37<br />
THY<br />
Source: DHMİ<br />
ATLAS JET<br />
LUFTHANSA<br />
OTHER
37<br />
� Newest in the region<br />
Ankara Esenboga Airport (100%)<br />
� Secondary hub of Turkish Airlines (THY)<br />
� Operations commenced in October 16, 2006.<br />
� THY’s Ankara based brand Anadolu Jet began to fly in May<br />
2008<br />
� In 2009, received “Best Airport Award” by ACI, in 5-10 million<br />
category<br />
Source: DHMI<br />
3<br />
Source: DHMI<br />
3 3<br />
4<br />
int'l Domestic<br />
5<br />
2002 2003 2004 2005 2006 2007 2008 2009 2010 2011<br />
12%<br />
Passenger traffic 2002-2011 (m)<br />
5<br />
Air Traffic Movement per airline (2011)<br />
Domestic<br />
10%<br />
77%<br />
THY Pegasus Other<br />
6<br />
33%<br />
6<br />
International<br />
12%<br />
14%<br />
41%<br />
9<br />
9<br />
THY<br />
Pegasus<br />
Lufhansa<br />
Other
38<br />
Izmir Adnan Menderes Airport (100%)<br />
� Third largest city with the second biggest port in Turkey<br />
� Major tourist destination<br />
� Operations commenced in September 13, 2006.<br />
� Diversified customer base<br />
Source: DHMI<br />
4<br />
Source: DHMI<br />
Passenger traffic 2006 - 2011 (m)<br />
5<br />
Int'l Domestic<br />
6<br />
2006 2007 2008 2009 2010 2011<br />
Air Traffic Movement per airline (2011)<br />
4%<br />
36%<br />
7%<br />
8%<br />
31%<br />
15%<br />
6<br />
8<br />
9<br />
SUN EXPRESS<br />
PEGASUS<br />
LUFTHANSA<br />
ONUR AIR<br />
ATLASJET<br />
OTHERS
39<br />
International tourist arrivals (millions), 2009 = 1.5m<br />
International tourism receipts (US$ millions), 2009 = 470m<br />
Source: World Economic Forum Report.<br />
Comments Georgia GDP growth<br />
� Population: 4.4m (1.5m in Tbilisi – the capital)<br />
� Located on the east of Black Sea, Georgia controls most of the<br />
trade routes through Caucasus Mountains<br />
� Constructions of several oil and gas pipelines have proved the<br />
strategic location of Georgia<br />
� One of the fastest growing economies among Former Soviet Union<br />
until the dispute with Russia on Abkhazia and South Ossetia<br />
� Presidential-democratic form of government<br />
� Strong tourism potential (rich history, culture, climate), wide<br />
catchment area<br />
1.600<br />
1.400<br />
1.200<br />
1.000<br />
800<br />
600<br />
400<br />
200<br />
0<br />
Country overview: Georgia<br />
(US$ in billions)<br />
20,0<br />
15,0<br />
10,0<br />
5,0<br />
0,0<br />
10,2<br />
Source: IMF.<br />
12,9<br />
10,8 11,7 12,9 13,3 13,7<br />
14,2 14,9<br />
2007A 2008A 2009A 2010A 2011E 2012E 2013E 2014E 2015E<br />
Nominal GDP Real GDP growth (%)<br />
Travel and Tourism indicators Population mix<br />
Source: IMF.<br />
15,0%<br />
10,0%<br />
5,0%<br />
0,0%<br />
(5,0%)<br />
0-14 years old<br />
15-64 years old<br />
65 years old or more
40<br />
Tbilisi International Airport (76%)<br />
� Operations in new terminal commenced in February 7,<br />
2007.<br />
� Capturing almost all air traffic in Georgia<br />
� Capital city of Georgia with promising business<br />
opportunities<br />
� Capacity: 2.8 million passengers per year<br />
� Selected as the Best Emerging Airport – Russia, CIS and<br />
Baltic States<br />
Source: Georgian Civil Aviation Authority<br />
0,27<br />
0,32 0,40<br />
Source: Georgian Civil Aviation Authority<br />
Passenger traffic 2002 - 2011 (‘mn)<br />
0,55 0,57 0,62 0,71 0,70<br />
0,82<br />
2002 2003 2004 2005 2006 2007 2008 2009 2010 2011<br />
Air Traffic Movement per airline (2011)<br />
49%<br />
19%<br />
4% 5%<br />
9%<br />
7%<br />
6%<br />
GEORGIAN A/W<br />
AEROSVIT<br />
TURKISH AIRLINES<br />
AZERBAIJAN AIRLINES<br />
LUFTHANSA<br />
PEGASUS<br />
OTHER<br />
1,1
41<br />
Batumi International Airport (76%)<br />
� Operations in the terminal commenced in May 26, 2007.<br />
� Second biggest city of Georgia with strategic importance<br />
Source: Georgian Civil Aviation Authority<br />
0,04<br />
Passenger traffic 2007-2011 (‘mn)<br />
0,08<br />
0,07<br />
Note: Domestic Passenger numbers included Hopa Terminal Passengers<br />
Source: Georgian Civil Aviation Authority<br />
0,09<br />
0,13<br />
2007 2008 2009 2010 2011<br />
Air Traffic Movement per airline (2011)<br />
35%<br />
7%<br />
17%<br />
41%<br />
GEORGIAN A/W<br />
TURKISH AIRLINES<br />
BELAVIA<br />
OTHER
42<br />
� Population: 10.5m (capital Tunis’ population 728,000)<br />
International tourist arrivals (millions), 2009 = 6.9m<br />
International tourism receipts (US$ billions), 2009 = 2.8bn<br />
Source: World Economic Forum Report.<br />
Comments Tunisia Real GDP growth<br />
� Privatisation policies of the government have pushed the economy forward over<br />
the past decade<br />
� Fairly well developed infrastructure (in particular for air and rail transport – 37th<br />
place in the World Economic Forum Competitiveness Rankings)<br />
� Increasingly popular as a holiday destination, with 90% of travellers visiting<br />
Tunisia preferring air transportation<br />
� December 2010 marked the beginning of the Jasmine revolution, a series of<br />
protests and social unrest sparked by the self-immolation of 26-year-old Mohamed<br />
Bouazizi<br />
� The wave of demonstrations subsequently led to the ousting of President Zine El<br />
Abidine Ben Ali and put an end to his 23-year rule<br />
300<br />
250<br />
200<br />
150<br />
100<br />
50<br />
–<br />
Country overview: Tunisia<br />
8.0%<br />
6.0%<br />
4.0%<br />
2.0%<br />
–<br />
Source: IMF.<br />
2002<br />
2003<br />
2004<br />
2005<br />
2006<br />
2007<br />
2008<br />
Tunisia Northern Africa Africa<br />
Source: IMF, African Economic Outlook.org<br />
Travel and Tourism indicators Population mix<br />
International tourist arrivals (thousands)<br />
International toursim receipts (US$ millions)<br />
2009<br />
2010<br />
2011<br />
2012<br />
2013<br />
2014<br />
2015<br />
0-14 years old<br />
15-64 years old<br />
65 years old or<br />
more
43<br />
Monastir International Airport (67%*)<br />
� <strong>TAV</strong> started to operate in January 1, 2008<br />
� Tunisia has potential to be the primary hub of Africa in<br />
near future<br />
� 90% of travelers visiting Tunisia prefer air transportation<br />
� Selected as the Best Emerging Airport in Africa,<br />
surpassing all other African airports.<br />
* <strong>TAV</strong> sold 15% of shares of <strong>TAV</strong> Tunisie SA to IFC in 2009. and 18% of shares to<br />
PAIDF in June 2010<br />
2,9 2,8<br />
Source: <strong>TAV</strong> Tunisie<br />
Source: <strong>TAV</strong> Tunisie<br />
Passenger traffic 2002-2011 (m)<br />
3,7<br />
4,1 4,2 4,2 4,2<br />
2002 2003 2004 2005 2006 2007 2008 2009 2010 2011<br />
3,8<br />
3,9<br />
Air Traffic Movement per airline (2011)<br />
2%<br />
5%<br />
33%<br />
6%<br />
22%<br />
32%<br />
TUNIS AIR<br />
2,3<br />
NOUVELAIR TUNISIA<br />
TRANSAVIA FRANCE<br />
THOMAS COOK UK<br />
AIR BERLIN GMBH<br />
OTHER
44<br />
Enfidha International Airport (67%)<br />
� <strong>TAV</strong> started to operate in December, 2009<br />
� The Enfidha International Airport, is located 65 kilometers from the Monastir International Airport and has the potential to<br />
become one of the major air travel hubs in Africa and is a crucial facility for Tunisia’s tourism industry due to its proximity to<br />
major tourist destinations.<br />
� <strong>TAV</strong> Tunisie reached agreements with many prominent airlines and tourism agencies of the region to increase the traffic at<br />
Enfidha.
45<br />
Source: World Economic Forum Report.<br />
International tourist arrivals (thousands), 2009 = 259k<br />
International tourism receipts (US$ millions), 2009 = 218m<br />
Comments Macedonia GDP growth<br />
� Population: 2.1m – Skopje (capital) has over 500,000 inhabitants<br />
� Skopje has deep historical connections with Turkey and still harbours<br />
large population of Turks and Albanians<br />
� Important crossroads of trade in Balkan region<br />
� Adoption of visa liberalization for Macedonia in December 2009<br />
has freed the traffic between Macedonia and EU member states<br />
comprising 500 million citizens<br />
� On the verge of joining the European Common Aviation Area<br />
(ECAA), which will lift the bilateral agreements and boost the air<br />
traffic in the region<br />
300<br />
250<br />
200<br />
150<br />
100<br />
50<br />
–<br />
Country overview: Macedonia<br />
14,0<br />
12,0<br />
10,0<br />
8,0<br />
6,0<br />
4,0<br />
2,0<br />
0,0<br />
(US$ in billions)<br />
8,7 9,2 9,7 9,1<br />
10,1 10,8 11,4 12,2 13,0<br />
2007A 2008A 2009A 2010A 2011E 2012E 2013E 2014E 2015E<br />
Source: IMF.<br />
Nominal GDP Real GDP growth (%)<br />
Note GDP at current prices.<br />
Travel and Tourism indicators Population mix<br />
International tourist arrivals (thousands)<br />
International toursim receipts (US$ millions)<br />
Source: IMF.<br />
0-14 years old<br />
15-64 years old<br />
65 years old or<br />
more<br />
8,0%<br />
6,0%<br />
4,0%<br />
2,0%<br />
0,0%<br />
(2,0%)
46<br />
Skopje and Ohrid International Airports (100%)<br />
� We were awarded the tender on September 2, 2008<br />
� <strong>TAV</strong> started to operate Skopje and Ohrid Airports on<br />
March 1, 2010<br />
� The European Parliament’s adoption of the visa<br />
liberalization for Macedonia on December 19, 2009 has<br />
opened a new era for Macedonian travel. The removal of<br />
visa requirements has freed traveling between Macedonia<br />
and 25 out of 27 EU member states with 500 million<br />
citizens.<br />
42%<br />
0,58<br />
0,59<br />
Passenger traffic 2005 - 2011 (‘mn)<br />
Skopje Ohrid<br />
0,67 0,70<br />
0,64<br />
0,73<br />
0,91<br />
2005 2006 2007 2008 2009 2010 2011<br />
14%<br />
10%<br />
11%<br />
12%<br />
11%<br />
Air Traffic Movement per Airline (2011)<br />
Skopje Ohrid<br />
Adria Airways<br />
Austrian Airlines<br />
Malev<br />
JAT<br />
Croatia Airlines<br />
OTHER<br />
42%<br />
20%<br />
14%<br />
10%<br />
14%<br />
HELLO<br />
CORENDON<br />
DUTCH AIRLINES<br />
JAT AIRWAYS<br />
MAT AIRWAYS<br />
OTHER
47<br />
� Population: 27.1m<br />
� Occupies 80% of the Arabian peninsula<br />
International tourist arrivals (millions), 2010 = 12<br />
International tourism receipts (US$ billions), 2010 = 7<br />
Source: Euromonitor, World Economic Forum Report.<br />
Note: International tourism receipts figures not available before 2005.<br />
Comments Saudi Arabia GDP growth<br />
� Saudi Arabia sits on more than 25% of the world’s known oil<br />
reserves, with a production capacity of 10 million barrels per day<br />
� Petroleum sector accounts for 55% of total GDP<br />
� Part of the WTO and OPEC, where it plays a leading role<br />
� Saudi Arabia has been ruled since its foundation by the Al Saud<br />
dynasty<br />
� Saudi Arabia is home to the two holiest sites of Islam (Mecca and<br />
Medinah)<br />
16.000<br />
14.000<br />
12.000<br />
10.000<br />
8.000<br />
6.000<br />
4.000<br />
2.000<br />
–<br />
Country Overview: Saudi Arabia<br />
(US$ in billions)<br />
800<br />
700<br />
600<br />
500<br />
400<br />
300<br />
200<br />
100<br />
0<br />
Source: IMF.<br />
2007A 2008A 2009A 2010A 2011E 2012E 2013E 2014E 2015E<br />
Nominal GDP Real GDP growth (%)<br />
Travel and Tourism indicators Population mix<br />
2000 2001 2002 2003 2004 2005 2006 2007 2008 2009 2010 2011<br />
International tourist arrivals (thousands)<br />
Incoming toursim receipts (US$ billions)<br />
Source: Euromonitor.<br />
0-14 years old<br />
15-64 years old<br />
65+ years old<br />
7,0%<br />
6,0%<br />
5,0%<br />
4,0%<br />
3,0%<br />
2,0%<br />
1,0%<br />
–
48<br />
Medinah Airport (33%)<br />
Summary<br />
�First full scope airport privatisation in Saudi Arabia<br />
�Consortium with Al Rajhi Holding Group and Saudi Oger Ltd, each<br />
having a 33.3% stake<br />
�Total Capex of $1–1.5bn; <strong>TAV</strong> share of $333–500m.<br />
�Medinah benefits from strong religion-driven pilgrimage traffic<br />
growth<br />
�Operating rights of the new terminal for 25 years on a BTO model<br />
basis after take over of operations (expected in first half of 2012)<br />
Medinah Mecca Jeddah<br />
Source: DHMI<br />
Runways<br />
2 runways: 3,850m x 45m and 3,050m x 45m<br />
2,3<br />
Passenger traffic 2006-2010 (‘mn)<br />
3,1<br />
3,4<br />
Note: Haji and Umrah refers to people making pilgrimage to Mecca.<br />
3,8<br />
3,3<br />
2006 2007 2008 2009 2010
49<br />
ATU Duty Free<br />
ATU is Turkey’s leading duty free operator chain, established as a joint venture between <strong>TAV</strong><br />
Airports Holding and Unifree Duty Free A.S. It is the sole duty free operator of the Istanbul,<br />
Izmir, Ankara airports in Turkey, Tbilisi and Batumi airports in Georgia, Enfidha airport in<br />
Tunisia, Skopje and Ohrid airports in Macedonia and Riga International Airport in Latvia as of<br />
January 2011<br />
ATU which is an enterprise constituting a perfect partnership collaboration model between <strong>TAV</strong><br />
and Unifree creates a considerable operation, purchasing capacity and an effective logistics<br />
network.
50<br />
ATU Duty Free (50%)<br />
� ATU is the sole duty free operator at Istanbul Atatürk,<br />
Ankara, Izmir, Tbilisi, Batumi, Enfidha, Skopje and Ohrid<br />
� Competitive concession fee paid to <strong>TAV</strong> for ATÜ-<br />
operated shops in Ataturk Airport<br />
� ATÜ commenced operations in Riga International Airport<br />
(Latvia), starting from January 2011, contributing around<br />
€4.7m revenue in the first nine months of 2011.<br />
149<br />
149<br />
39 40 40<br />
37 37 36<br />
33<br />
29<br />
Note: Figures imply 100% of ATU<br />
Financial Data<br />
(€ m) 2006 2007 2008 2009 2010 Change<br />
Total Revenues 217.2 277.0 302.8 290.3 340.0 17%<br />
EBITDA 7.6 17.6 27.6 27.7 30.8 11%<br />
EBITDA Margin 3.5% 6.4% 9.1% 9.5% 9.0% -<br />
Spend per pax (€) 15.7 14.8 15.8 14.7 14.5 -2%<br />
Revenue (€m) Spend Per Pax (€)*<br />
-4%<br />
166<br />
33<br />
17%<br />
46 46<br />
41<br />
148<br />
40<br />
56<br />
52<br />
2008 2009 2010 2011<br />
1Q 2Q 3Q 4Q<br />
23%<br />
Duty Free Spend Per Pax (€) * 9M11 9M10 % 2010 2009 %<br />
ATU Average 14.4 13.9 4% 14.5 14.7 -2%<br />
Istanbul 16.3 15.6 4% 16.3 15.7 3%<br />
* Latvia was not included in duty free spend per pax spend calculation.
51<br />
Customs Law<br />
Products* 07.10.2009-05.09.2010 As of 06.09.2010<br />
Tobacco Products<br />
Alcohol<br />
- Beverages with more than 22%<br />
alcohol such as whiskey and raki<br />
- Beverages with less than 22% alcohol<br />
such as wine and champaigne<br />
Parfume, lotion, essence, cologne, lavender<br />
water<br />
2 cartoons of cigarettes OR other<br />
tobacco products at their own<br />
limits<br />
51<br />
3 cartoons of cigarettes AND<br />
other tobacco products at their<br />
own limits<br />
1 Liter OR 1 Liter AND<br />
2 Liters 2 Liters<br />
5 bottles (each bottle can be 120<br />
ml max )<br />
5 bottles (each bottle can be<br />
120 ml max ) AND 5 packages<br />
of skin care products & make-up<br />
Chocolate 1 kg AND 2 kg OR<br />
Sugar Products 1 kg 2 kg<br />
* The table does not include all products covered under Customs Law, but includes high importance products for ATU
52<br />
BTA Catering Services<br />
BTA Catering was founded in 1999 under the partnership of Bilintur, Tepe and Akfen in<br />
order to handle the food & beverage operation of the Istanbul Atatürk Airport's<br />
International Terminal.<br />
Following the opening of the new International Terminal of Istanbul Atatürk Airport on the<br />
10 th of January 2000, all food & beverage operations of the terminal, both for passengers<br />
and the terminal personnel, are managed by BTA Catering.
53<br />
BTA Catering Services (67%)<br />
� BTA is the food and beverage operator at Istanbul<br />
Ataturk (Int’l and domestic terminal), Ankara, Izmir,<br />
Tbilisi and Batumi, Monastir, Enfidha, Skopje and Ohrid<br />
� Total revenue increased by 27% in 2010<br />
� Concession fees: BTA pays c40% of its revenues to <strong>TAV</strong><br />
14,9<br />
21,1<br />
29,4<br />
Note: Figures imply 100% of BTA<br />
Financial Data<br />
(€ m) 2006 2007* 2008* 2009* 2010* Change<br />
Total Revenues 35.0 50.3 58.1 59.1 75.0 27%<br />
EBITDA 3.0 -0.2 3.5 6.5 7.2 11%<br />
EBITDA Margin 8.6% n.m. 6.0% 11% 10% -<br />
Spend per pax (€) 2.4 1.8 2.1 2.0 1.6 -21%<br />
* 2007 and 2008 food & beverage spend per pax includes Istanbul, Ankara & Izmir; while<br />
previous periods indicate Istanbul only<br />
Revenue (€m) Spend per Pax (€)*<br />
35<br />
50,3<br />
58,1<br />
59,1<br />
75,0<br />
2003 2004 2005 2006 2007 2008 2009 2010<br />
1,3<br />
1,5<br />
1,9<br />
2,4<br />
1,8<br />
2,1 2<br />
2003 2004 2005 2006 2007 2008 2009 2010<br />
* 2007 ,2008 and 2009 food & beverage spend per pax includes Istanbul, Ankara & Izmir;<br />
while previous periods indicate Istanbul only<br />
1,6
54<br />
Havaş Ground Handling<br />
Havaalanları Yer Hizmetleri A.Ş. (Havaş), the first Ground Handling Services Company in Turkey,<br />
was founded by the state in 1933 to provide ground handling and catering services for airlines.<br />
Whereas catering services of the company were privatized under the name USAŞ in 1987,<br />
ground handling services unit continued to render services under the name Havaalanları Yer<br />
Hizmetleri A.Ş.
55<br />
84,1<br />
Havaş Ground Handling (65%)<br />
� Total revenue of Havas increased by 30% in 2010<br />
� Operating at 22 airports in Turkey<br />
� Havaş has been chosen by THY as partner in the TGS Ground<br />
Handling Services Inc. which commenced its operations as of 01<br />
January, 2010<br />
� Havaş purchased 50% shares of North Hub Services (Havas<br />
Europe) on 12 April, 2010<br />
99,5<br />
108,1<br />
Financial Data<br />
(€ m) 2006 2007 2008 2009 2010 Change<br />
Total Revenues 99.5 108.1 120.6 125.9 163.5 30%<br />
EBITDA 11.1 20.3 28.1 24.2 25.5 6%<br />
EBITDA Margin 11.2% 18.7% 23.3% 19.2% 15.6% -<br />
# Aircrafts handled<br />
(‘000)<br />
Figures imply 100% of Havas<br />
Revenue (€m) Aircrafts Handled (‘000)<br />
120,6<br />
125,9<br />
163,5<br />
2005 2006 2007 2008 2009 2010<br />
134<br />
122.7 139.3 158.6 182.7 242.7 33%<br />
TGS Only HAVAŞ Only HAVAŞ + TGS<br />
%21<br />
161<br />
FY10 FY11<br />
109<br />
%7<br />
116<br />
FY10 FY11<br />
243<br />
%14<br />
278<br />
FY10 FY11
56<br />
Havaş, TGS and Havaş Europe Operations<br />
� Havaş can be divided in five operational units<br />
� Passengers services<br />
� Aircraft services<br />
� Cargo / Postal services<br />
� Flight operation, freight control and communication services<br />
� Representation services<br />
� Exceptional service coverage throughout Turkey<br />
� TGS, operates at a total of six airports in Turkey and provides ramp,<br />
operation, cargo and passenger services<br />
� 11,012 employees<br />
� North Hub Services (Havaş Europe)<br />
� Riga – January 2010<br />
� Helsinki – July 2010<br />
� Stockholm – June 2011<br />
Havaş & TGS coverage (Turkey) North Hub (Havaş/EUROPE) coverage (Northern Europe)<br />
North Hub coverage<br />
Denmark<br />
Sweden<br />
Poland<br />
Finland<br />
Latvia<br />
Lithuania
57<br />
Other Services<br />
� <strong>TAV</strong> O&M (100%), incorporated in 2004<br />
Commercial area allocations, maintenance and Lounges<br />
� <strong>TAV</strong> IT (99%), become a separate entity in 2005<br />
Airport IT services, software and hardware sales<br />
� <strong>TAV</strong> Security (100%), became a separate entity in 2006<br />
Security service provider in Istanbul, Ankara, Izmir and Gazipaşa<br />
� <strong>TAV</strong> Latvia (100%) incorporated in 2010<br />
<strong>TAV</strong> Airports commenced the management of all Commercial Areas<br />
on January 1st, 2011 including DutyFree, Food&Beverage and other<br />
Retail areas for 10 years<br />
38,8<br />
Financial Data<br />
(€ m) 2006 2007 2008 2009 2010 Change<br />
Total Revenues 38.8 50.3 54.5 66.1 60.7 -8%<br />
EBITDA 6.7 -6.6 -1.7 19.6 -4.6 n.m.<br />
EBITDA Margin 17.3 n.m. n.m. 30 n.m. -<br />
Note: All periods include <strong>TAV</strong> Holding, <strong>TAV</strong> O&M, <strong>TAV</strong> IT and <strong>TAV</strong> Security<br />
In 2009, €9million one-off gain was recorded due to the sale of <strong>TAV</strong> Tunisie shares to IFC<br />
In 2010, approximately €5 million one-off expense was recorded due to consultancy charges<br />
Revenue (€m) Revenue Breakdown ( 2010)<br />
50,3<br />
54,5<br />
66,1<br />
60,7<br />
2006 2007 2008 2009 2010<br />
<strong>TAV</strong><br />
Security<br />
14%<br />
Holding<br />
20%<br />
<strong>TAV</strong> IT<br />
16%<br />
<strong>TAV</strong><br />
O&M 50%
58<br />
Share Performance (as of January 12, 2012)<br />
Closing Price<br />
7.72<br />
Avg. DailyVol.*<br />
(USD)<br />
6mn<br />
Foreign Ownership<br />
84%<br />
* Jan 2011 to date<br />
1,4<br />
1,3<br />
1,2<br />
1,1<br />
1,0<br />
0,9<br />
0,8<br />
0,7<br />
0,6<br />
0,5<br />
0,4<br />
0,3<br />
28-03-07<br />
Relative<br />
14-09-07<br />
21-06-07<br />
07-03-08<br />
11-12-07<br />
26-08-08<br />
03-06-08<br />
23-02-09<br />
24-11-08<br />
13-08-09<br />
21-05-09<br />
08-02-10<br />
10-11-09<br />
05-08-10<br />
12-05-10<br />
01-02-11<br />
03-11-10<br />
Price ($)<br />
20-07-11<br />
26-04-11<br />
<strong>TAV</strong>HL ($) Relative to ISE-100<br />
Share Price Performance<br />
12-01-12<br />
17-10-11<br />
% Weekly 1M 3M Year to Date* Since IPO<br />
TL -3% 1% 1% 3% 1%<br />
USD -1% 2% 0% -14% -24%<br />
Relative to ISE -100 -5% 2% 15% 31% -15%<br />
8<br />
7<br />
6<br />
5<br />
4<br />
3<br />
2<br />
1<br />
0<br />
Market Cap (USD)<br />
1.5bn<br />
Free Float<br />
44%<br />
Effective Free Float<br />
40%
59<br />
<strong>TAV</strong> Investor Relations<br />
For further information, please visit http://ir.tav.aero,<br />
e-mail: ir@tav.aero<br />
<strong>TAV</strong>InvestorRelations@tav.aero<br />
or call +90-212-463-30-00(x2120, 2122, 2123, 2124)<br />
<strong>TAV</strong> Airports Holding Co.<br />
Istanbul Ataturk Havalimanı Dış Hatlar Terminali<br />
34149 Yesilkoy, Istanbul<br />
Nursel İLGEN, CFA<br />
Head of Investor Relations<br />
nursel.ilgen@tav.aero<br />
Tel :+90 212 463 3000 / 2122<br />
Ali Özgü CANERİ<br />
Investor Relations Assistant Manager<br />
ali.caneri@tav.aero<br />
Tel :+90 212 463 3000 / 2124<br />
Besim MERİÇ<br />
Investor Relations Assitant Manager<br />
besim.meric@tav.aero<br />
Tel :+90 212 463 3000 / 2123<br />
Pelin AKIN<br />
Management Trainee<br />
pelin.akin@tav.aero<br />
Tel :+90 212 463 3000 / 2282<br />
2007 2008<br />
2009 2010
60<br />
Disclaimer<br />
This presentation does not constitute an offer to sell or the solicitation of an offer to buy or acquire any shares of <strong>TAV</strong> Havalimanlari Holding A.Ş. (the "Company")<br />
in any jurisdiction or an inducement to enter into investment activity. No information set out in this document or referred to in such other written or oral information<br />
will form the basis of any contract.<br />
The information used in preparing these materials was obtained from or through the Company or the Company’s representatives or from public sources. No reliance<br />
may be placed for any purposes whatsoever on the information contained in this presentation or on its accuracy, completeness or fairness. The information in this<br />
presentation is subject to verification, completion and change. While the information herein has been prepared in good faith, no representation or warranty,<br />
express or implied, is or will be made and no responsibility or liability is or will be accepted by the Company or any of its group undertakings, employees or<br />
agents as to or in relation to the accuracy, completeness or fairness of the information contained in this presentation or any other written or oral information made<br />
available to any interested party or its advisers and any such liability is expressly disclaimed. This disclaimer will not exclude any liability for, or remedy in respect<br />
of fraudulent misrepresentation by the Company.<br />
This presentation contains forward-looking statements. These statements, which may contain the words “anticipate”, “believe”, “intend”, “estimate”, “expect” and<br />
words of similar meaning, reflect the Company’s beliefs, opinions and expectations and, particularly where such statements relate to possible or assumed future<br />
financial or other performance of the Company, are subject to risks and uncertainties that may cause actual results to differ materially. These risks and<br />
uncertainties include, among other factors, changing business or other market conditions and the prospects for growth anticipated by the management of the<br />
Company. These and other factors could adversely affect the outcome and financial effects of the plans and events described herein. These forward-looking<br />
statements speak only as at the date of this presentation. The Company expressly disclaim any obligation or undertaking to disseminate any updates or revisions to<br />
any forward-looking statements contained herein to reflect any change in the Company’s expectations with regard thereto or any change in events, conditions or<br />
circumstances on which any such statement is based. Past performance cannot be relied upon as a guide to future performance. As a result, you are cautioned not<br />
to place reliance on such forward-looking statements.<br />
Information in this presentation was prepared as of 13 January 2012.