TAV AIRPORTS
TAV AIRPORTS
TAV AIRPORTS

You also want an ePaper? Increase the reach of your titles
YUMPU automatically turns print PDFs into web optimized ePapers that Google loves.
13<br />
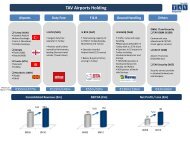
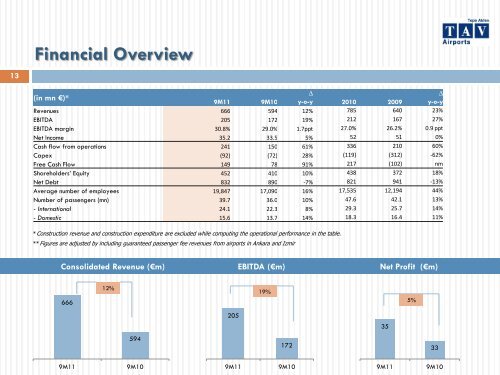
Financial Overview<br />
(in mn €)*<br />
9M11 9M10<br />
∆<br />
y-o-y 2010 2009<br />
∆<br />
y-o-y<br />
Revenues 666 594 12% 785 640 23%<br />
EBITDA 205 172 19% 212 167 27%<br />
EBITDA margin 30.8% 29.0% 1.7ppt 27.0% 26.2% 0.9 ppt<br />
Net Income 35.2 33.5 5% 52 51 0%<br />
Cash flow from operations 241 150 61% 336 210 60%<br />
Capex (92) (72) 28% (119) (312) -62%<br />
Free Cash Flow 149 78 91% 217 (102) nm<br />
Shareholders’ Equity 452 410 10% 438 372 18%<br />
Net Debt 832 890 -7% 821 941 -13%<br />
Average number of employees 19,847 17,090 16% 17,535 12,194 44%<br />
Number of passengers (mn) 39.7 36.0 10% 47.6 42.1 13%<br />
- International 24.1 22.3 8% 29.3 25.7 14%<br />
- Domestic 15.6 13.7 14% 18.3 16.4 11%<br />
* Construction revenue and construction expenditure are excluded while computing the operational performance in the table.<br />
** Figures are adjusted by including guaranteed passenger fee revenues from airports in Ankara and Izmir<br />
Consolidated Revenue (€m) EBITDA (€m) Net Profit (€m)<br />
666<br />
12%<br />
594<br />
9M11 9M10<br />
205<br />
19%<br />
172<br />
9M11 9M10<br />
35<br />
5%<br />
33<br />
9M11 9M10