Greenhouse Gas Emissions from U.S. Agriculture and Forestry: A ...
Greenhouse Gas Emissions from U.S. Agriculture and Forestry: A ...
Greenhouse Gas Emissions from U.S. Agriculture and Forestry: A ...

Create successful ePaper yourself
Turn your PDF publications into a flip-book with our unique Google optimized e-Paper software.
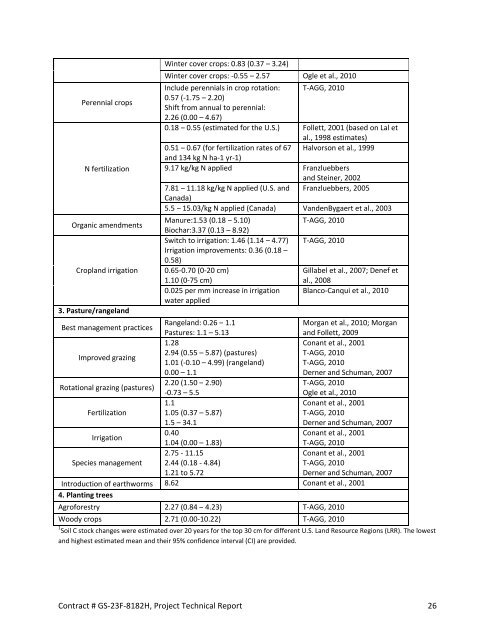
Perennial crops<br />
N fertilization<br />
Organic amendments<br />
Cropl<strong>and</strong> irrigation<br />
3. Pasture/rangel<strong>and</strong><br />
Winter cover crops: 0.83 (0.37 – 3.24)<br />
Winter cover crops: ‐0.55 – 2.57 Ogle et al., 2010<br />
Include perennials in crop rotation: T‐AGG, 2010<br />
0.57 (‐1.75 – 2.20)<br />
Shift <strong>from</strong> annual to perennial:<br />
2.26 (0.00 – 4.67)<br />
0.18 – 0.55 (estimated for the U.S.) Follett, 2001 (based on Lal et<br />
al., 1998 estimates)<br />
0.51 – 0.67 (for fertilization rates of 67 Halvorson et al., 1999<br />
<strong>and</strong> 134 kg N ha‐1 yr‐1)<br />
9.17 kg/kg N applied Franzluebbers<br />
<strong>and</strong> Steiner, 2002<br />
7.81 – 11.18 kg/kg N applied (U.S. <strong>and</strong> Franzluebbers, 2005<br />
Canada)<br />
5.5 – 15.03/kg N applied (Canada) V<strong>and</strong>enBygaert et al., 2003<br />
Manure:1.53 (0.18 – 5.10)<br />
Biochar:3.37 (0.13 – 8.92)<br />
Switch to irrigation: 1.46 (1.14 – 4.77)<br />
Irrigation improvements: 0.36 (0.18 –<br />
0.58)<br />
0.65‐0.70 (0‐20 cm)<br />
1.10 (0‐75 cm)<br />
0.025 per mm increase in irrigation<br />
water applied<br />
T‐AGG, 2010<br />
T‐AGG, 2010<br />
Gillabel et al., 2007; Denef et<br />
al., 2008<br />
Blanco‐Canqui et al., 2010<br />
Best management practices<br />
Rangel<strong>and</strong>: 0.26 – 1.1<br />
Pastures: 1.1 – 5.13<br />
Morgan et al., 2010; Morgan<br />
<strong>and</strong> Follett, 2009<br />
1.28<br />
Conant et al., 2001<br />
Improved grazing<br />
2.94 (0.55 – 5.87) (pastures)<br />
1.01 (‐0.10 – 4.99) (rangel<strong>and</strong>)<br />
T‐AGG, 2010<br />
T‐AGG, 2010<br />
0.00 – 1.1<br />
Derner <strong>and</strong> Schuman, 2007<br />
Rotational grazing (pastures)<br />
2.20 (1.50 – 2.90)<br />
‐0.73 – 5.5<br />
T‐AGG, 2010<br />
Ogle et al., 2010<br />
1.1<br />
Conant et al., 2001<br />
Fertilization 1.05 (0.37 – 5.87)<br />
T‐AGG, 2010<br />
1.5 – 34.1<br />
Derner <strong>and</strong> Schuman, 2007<br />
Irrigation<br />
0.40<br />
1.04 (0.00 – 1.83)<br />
Conant et al., 2001<br />
T‐AGG, 2010<br />
2.75 ‐ 11.15<br />
Conant et al., 2001<br />
Species management 2.44 (0.18 ‐ 4.84)<br />
T‐AGG, 2010<br />
1.21 to 5.72<br />
Derner <strong>and</strong> Schuman, 2007<br />
Introduction of earthworms<br />
4. Planting trees<br />
8.62 Conant et al., 2001<br />
Agroforestry 2.27 (0.84 – 4.23) T‐AGG, 2010<br />
Woody crops 2.71 (0.00‐10.22) T‐AGG, 2010<br />
1<br />
Soil C stock changes were estimated over 20 years for the top 30 cm for different U.S. L<strong>and</strong> Resource Regions (LRR). The lowest<br />
<strong>and</strong> highest estimated mean <strong>and</strong> their 95% confidence interval (CI) are provided.<br />
Contract # GS‐23F‐8182H, Project Technical Report 26