Greenhouse Gas Emissions from U.S. Agriculture and Forestry: A ...
Greenhouse Gas Emissions from U.S. Agriculture and Forestry: A ...
Greenhouse Gas Emissions from U.S. Agriculture and Forestry: A ...

Create successful ePaper yourself
Turn your PDF publications into a flip-book with our unique Google optimized e-Paper software.
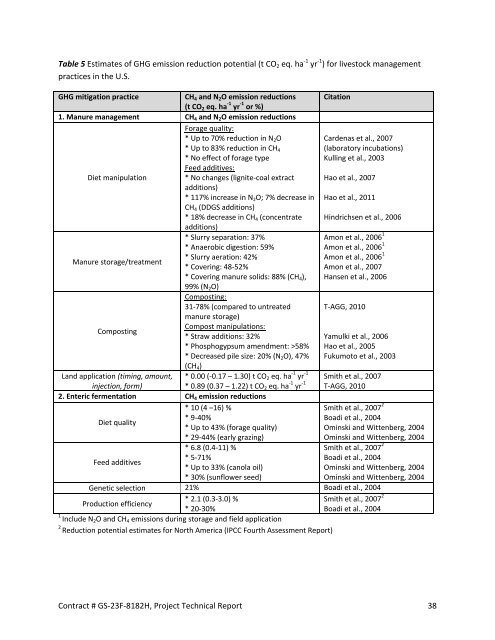
Table 5 Estimates of GHG emission reduction potential (t CO2 eq. ha ‐1 yr ‐1 ) for livestock management<br />
practices in the U.S.<br />
GHG mitigation practice CH4 <strong>and</strong> N2O emission reductions<br />
(t CO2 eq. ha ‐1 yr ‐1 or %)<br />
Citation<br />
1. Manure management CH4 <strong>and</strong> N2O emission reductions<br />
Forage quality:<br />
* Up to 70% reduction in N2O<br />
Cardenas et al., 2007<br />
* Up to 83% reduction in CH4<br />
(laboratory incubations)<br />
* No effect of forage type<br />
Feed additives:<br />
Kulling et al., 2003<br />
Diet manipulation * No changes (lignite‐coal extract<br />
additions)<br />
Hao et al., 2007<br />
* 117% increase in N2O; 7% decrease in<br />
CH4 (DDGS additions)<br />
Hao et al., 2011<br />
* 18% decrease in CH4 (concentrate<br />
additions)<br />
Hindrichsen et al., 2006<br />
* Slurry separation: 37%<br />
Amon et al., 2006<br />
* Anaerobic digestion: 59%<br />
Manure storage/treatment<br />
* Slurry aeration: 42%<br />
* Covering: 48‐52%<br />
* Covering manure solids: 88% (CH4),<br />
99% (N2O)<br />
1<br />
Amon et al., 2006 1<br />
Amon et al., 2006 1<br />
Amon et al., 2007<br />
Composting:<br />
Hansen et al., 2006<br />
31‐78% (compared to untreated<br />
manure storage)<br />
T‐AGG, 2010<br />
Composting<br />
Compost manipulations:<br />
* Straw additions: 32%<br />
Yamulki et al., 2006<br />
* Phosphogypsum amendment: >58% Hao et al., 2005<br />
* Decreased pile size: 20% (N2O), 47%<br />
(CH4)<br />
Fukumoto et al., 2003<br />
L<strong>and</strong> application (timing, amount,<br />
injection, form)<br />
* 0.00 (‐0.17 – 1.30) t CO2 eq. ha ‐1 yr ‐1<br />
* 0.89 (0.37 – 1.22) t CO2 eq. ha ‐1 yr ‐1<br />
Smith et al., 2007<br />
T‐AGG, 2010<br />
2. Enteric fermentation CH4 emission reductions<br />
* 10 (4 –16) %<br />
Smith et al., 2007<br />
Diet quality<br />
* 9‐40%<br />
* Up to 43% (forage quality)<br />
* 29‐44% (early grazing)<br />
2<br />
Boadi et al., 2004<br />
Ominski <strong>and</strong> Wittenberg, 2004<br />
Ominski <strong>and</strong> Wittenberg, 2004<br />
* 6.8 (0.4‐11) %<br />
Smith et al., 2007<br />
Feed additives<br />
* 5‐71%<br />
* Up to 33% (canola oil)<br />
* 30% (sunflower seed)<br />
2<br />
Boadi et al., 2004<br />
Ominski <strong>and</strong> Wittenberg, 2004<br />
Ominski <strong>and</strong> Wittenberg, 2004<br />
Genetic selection 21% Boadi et al., 2004<br />
Production efficiency<br />
* 2.1 (0.3‐3.0) %<br />
* 20‐30%<br />
Smith et al., 2007 2<br />
Boadi et al., 2004<br />
1<br />
Include N2O <strong>and</strong> CH4 emissions during storage <strong>and</strong> field application<br />
2<br />
Reduction potential estimates for North America (IPCC Fourth Assessment Report)<br />
Contract # GS‐23F‐8182H, Project Technical Report 38