Automated System for Selective Etching of the AlxGa1−xAs/GaAs ...
Automated System for Selective Etching of the AlxGa1−xAs/GaAs ...
Automated System for Selective Etching of the AlxGa1−xAs/GaAs ...

Create successful ePaper yourself
Turn your PDF publications into a flip-book with our unique Google optimized e-Paper software.
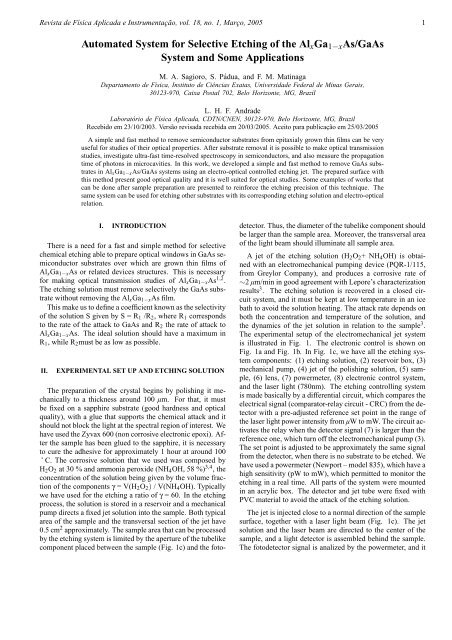
Revista de Física Aplicada e Instrumentação, vol. 18, no. 1, Março, 2005 1<br />
<strong>Automated</strong> <strong>System</strong> <strong>for</strong> <strong>Selective</strong> <strong>Etching</strong> <strong>of</strong> <strong>the</strong> <strong>AlxGa1−xAs</strong>/<strong>GaAs</strong><br />
<strong>System</strong> and Some Applications<br />
M. A. Sagioro, S. Pádua, and F. M. Matinaga<br />
Departamento de Física, Instituto de Ciências Exatas, Universidade Federal de Minas Gerais,<br />
30123-970, Caixa Postal 702, Belo Horizonte, MG, Brazil<br />
L. H. F. Andrade<br />
Laboratório de Física Aplicada, CDTN/CNEN, 30123-970, Belo Horizonte, MG, Brazil<br />
Recebido em 23/10/2003. Versão revisada recebida em 20/03/2005. Aceito para publicação em 25/03/2005<br />
A simple and fast method to remove semiconductor substrates from epitaxialy grown thin films can be very<br />
useful <strong>for</strong> studies <strong>of</strong> <strong>the</strong>ir optical properties. After substrate removal it is possible to make optical transmission<br />
studies, investigate ultra-fast time-resolved spectroscopy in semiconductors, and also measure <strong>the</strong> propagation<br />
time <strong>of</strong> photons in microcavities. In this work, we developed a simple and fast method to remove <strong>GaAs</strong> substrates<br />
in <strong>AlxGa1−xAs</strong>/<strong>GaAs</strong> systems using an electro-optical controlled etching jet. The prepared surface with<br />
this method present good optical quality and it is well suited <strong>for</strong> optical studies. Some examples <strong>of</strong> works that<br />
can be done after sample preparation are presented to rein<strong>for</strong>ce <strong>the</strong> etching precision <strong>of</strong> this technique. The<br />
same system can be used <strong>for</strong> etching o<strong>the</strong>r substrates with its corresponding etching solution and electro-optical<br />
relation.<br />
I. INTRODUCTION<br />
There is a need <strong>for</strong> a fast and simple method <strong>for</strong> selective<br />
chemical etching able to prepare optical windows in <strong>GaAs</strong> semiconductor<br />
substrates over which are grown thin films <strong>of</strong><br />
<strong>AlxGa1−xAs</strong> or related devices structures. This is necessary<br />
<strong>for</strong> making optical transmission studies <strong>of</strong> <strong>AlxGa1−xAs</strong> 1,2 .<br />
The etching solution must remove selectively <strong>the</strong> <strong>GaAs</strong> substrate<br />
without removing <strong>the</strong> <strong>AlxGa1−xAs</strong> film.<br />
This make us to define a coefficient known as <strong>the</strong> selectivity<br />
<strong>of</strong> <strong>the</strong> solution S given by S = R1 /R2, where R1 corresponds<br />
to <strong>the</strong> rate <strong>of</strong> <strong>the</strong> attack to <strong>GaAs</strong> and R2 <strong>the</strong> rate <strong>of</strong> attack to<br />
<strong>AlxGa1−xAs</strong>. The ideal solution should have a maximum in<br />
R1, while R2must be as low as possible.<br />
II. EXPERIMENTAL SET UP AND ETCHING SOLUTION<br />
The preparation <strong>of</strong> <strong>the</strong> crystal begins by polishing it mechanically<br />
to a thickness around 100 µm. For that, it must<br />
be fixed on a sapphire substrate (good hardness and optical<br />
quality), with a glue that supports <strong>the</strong> chemical attack and it<br />
should not block <strong>the</strong> light at <strong>the</strong> spectral region <strong>of</strong> interest. We<br />
have used <strong>the</strong> Zyvax 600 (non corrosive electronic epoxi). After<br />
<strong>the</strong> sample has been glued to <strong>the</strong> sapphire, it is necessary<br />
to cure <strong>the</strong> adhesive <strong>for</strong> approximately 1 hour at around 100<br />
˚ C. The corrosive solution that we used was composed by<br />
H2O2 at 30 % and ammonia peroxide (NH4OH, 58 %) 3,4 , <strong>the</strong><br />
concentration <strong>of</strong> <strong>the</strong> solution being given by <strong>the</strong> volume fraction<br />
<strong>of</strong> <strong>the</strong> components γ = V(H2O2) / V(NH4OH). Typically<br />
we have used <strong>for</strong> <strong>the</strong> etching a ratio <strong>of</strong> γ = 60. In <strong>the</strong> etching<br />
process, <strong>the</strong> solution is stored in a reservoir and a mechanical<br />
pump directs a fixed jet solution into <strong>the</strong> sample. Both typical<br />
area <strong>of</strong> <strong>the</strong> sample and <strong>the</strong> transversal section <strong>of</strong> <strong>the</strong> jet have<br />
0.5 cm 2 approximately. The sample area that can be processed<br />
by <strong>the</strong> etching system is limited by <strong>the</strong> aperture <strong>of</strong> <strong>the</strong> tubelike<br />
component placed between <strong>the</strong> sample (Fig. 1c) and <strong>the</strong> foto-<br />
detector. Thus, <strong>the</strong> diameter <strong>of</strong> <strong>the</strong> tubelike component should<br />
be larger than <strong>the</strong> sample area. Moreover, <strong>the</strong> transversal area<br />
<strong>of</strong> <strong>the</strong> light beam should illuminate all sample area.<br />
A jet <strong>of</strong> <strong>the</strong> etching solution (H2O2+ NH4OH) is obtained<br />
with an electromechanical pumping device (PQR-1/115,<br />
from Greylor Company), and produces a corrosive rate <strong>of</strong><br />
∼2 µm/min in good agreement with Lepore’s characterization<br />
results 3 . The etching solution is recovered in a closed circuit<br />
system, and it must be kept at low temperature in an ice<br />
bath to avoid <strong>the</strong> solution heating. The attack rate depends on<br />
both <strong>the</strong> concentration and temperature <strong>of</strong> <strong>the</strong> solution, and<br />
<strong>the</strong> dynamics <strong>of</strong> <strong>the</strong> jet solution in relation to <strong>the</strong> sample 3 .<br />
The experimental setup <strong>of</strong> <strong>the</strong> electromechanical jet system<br />
is illustrated in Fig. 1. The electronic control is shown on<br />
Fig. 1a and Fig. 1b. In Fig. 1c, we have all <strong>the</strong> etching system<br />
components: (1) etching solution, (2) reservoir box, (3)<br />
mechanical pump, (4) jet <strong>of</strong> <strong>the</strong> polishing solution, (5) sample,<br />
(6) lens, (7) powermeter, (8) electronic control system,<br />
and <strong>the</strong> laser light (780nm). The etching controlling system<br />
is made basically by a differential circuit, which compares <strong>the</strong><br />
electrical signal (comparator-relay circuit - CRC) from <strong>the</strong> detector<br />
with a pre-adjusted reference set point in <strong>the</strong> range <strong>of</strong><br />
<strong>the</strong> laser light power intensity from µW to mW. The circuit activates<br />
<strong>the</strong> relay when <strong>the</strong> detector signal (7) is larger than <strong>the</strong><br />
reference one, which turn <strong>of</strong>f <strong>the</strong> electromechanical pump (3).<br />
The set point is adjusted to be approximately <strong>the</strong> same signal<br />
from <strong>the</strong> detector, when <strong>the</strong>re is no substrate to be etched. We<br />
have used a powermeter (Newport – model 835), which have a<br />
high sensitivity (pW to mW), which permitted to monitor <strong>the</strong><br />
etching in a real time. All parts <strong>of</strong> <strong>the</strong> system were mounted<br />
in an acrylic box. The detector and jet tube were fixed with<br />
PVC material to avoid <strong>the</strong> attack <strong>of</strong> <strong>the</strong> etching solution.<br />
The jet is injected close to a normal direction <strong>of</strong> <strong>the</strong> sample<br />
surface, toge<strong>the</strong>r with a laser light beam (Fig. 1c). The jet<br />
solution and <strong>the</strong> laser beam are directed to <strong>the</strong> center <strong>of</strong> <strong>the</strong><br />
sample, and a light detector is assembled behind <strong>the</strong> sample.<br />
The fotodetector signal is analized by <strong>the</strong> powermeter, and it
2 M. A. Sagioro et al.<br />
is connected to an electronic controlling system (detail (8) in<br />
Fig. 1c), which stops <strong>the</strong> electromechanical pumping when<br />
<strong>the</strong> laser light reachs <strong>the</strong> detector passing through <strong>the</strong> etched<br />
sample. This controlling signal can be adjusted to suppress<br />
<strong>the</strong> jet to interrupt <strong>the</strong> etching process with a depth resolution<br />
<strong>of</strong> <strong>the</strong> order <strong>of</strong> nanometers (Fig. 1b), since <strong>the</strong> transmitted<br />
light across <strong>the</strong> sample becomes significant when <strong>the</strong> remaining<br />
layer <strong>of</strong> <strong>GaAs</strong> is closed to 100 nm thick. In our samples,<br />
after <strong>the</strong> <strong>GaAs</strong> substrate has a Al<strong>GaAs</strong> layer that works as a<br />
stop layer, since <strong>the</strong> selective <strong>of</strong> Al<strong>GaAs</strong> is bigger than <strong>GaAs</strong><br />
(Fig. 3). There<strong>for</strong>e, when <strong>the</strong> <strong>GaAs</strong> thickness decreases less<br />
than 100 nm, <strong>the</strong> laser light increases until a maximum intensity.<br />
Finally, <strong>the</strong> <strong>GaAs</strong> remaining cap layer <strong>of</strong> a few nanometers<br />
is etched with a jet solution <strong>of</strong> low concentration<br />
that guarantees us a reflected surface, which indicates a good<br />
quality <strong>of</strong> <strong>the</strong> etching process (Fig. 2). In <strong>the</strong> case <strong>of</strong> <strong>the</strong> semiconductors<br />
heterostructures that have partial selectivity, <strong>the</strong><br />
etching system still can be useful. However, <strong>the</strong> electronic circuit<br />
must have a better adjustment to detect <strong>the</strong> light intensity<br />
transmitted through <strong>the</strong> desired thickness. The advantages <strong>of</strong><br />
<strong>the</strong> etching system are <strong>the</strong> small contact <strong>of</strong> <strong>the</strong> operator with<br />
<strong>the</strong> chemical solution, <strong>the</strong> small quantity <strong>of</strong> used solution, greater<br />
independency <strong>of</strong> <strong>the</strong> system operator and a higher precision<br />
in <strong>the</strong> end point <strong>of</strong> attack mainly when semiconductor<br />
structure sample has low selectivety. Moreover, <strong>the</strong> jet solution<br />
pressure on <strong>the</strong> <strong>GaAs</strong> substrate permits both <strong>the</strong> better<br />
selectivity and a faster etching process in relation to <strong>the</strong> wet<br />
etching technique.<br />
III. SOME APPLICATIONS<br />
A. Al<strong>GaAs</strong> film<br />
As <strong>the</strong> first example <strong>of</strong> <strong>the</strong> utility <strong>of</strong> <strong>the</strong> technique <strong>of</strong> selective<br />
etching we present <strong>the</strong> studies <strong>of</strong> optical absorption<br />
in films <strong>of</strong> <strong>AlxGa1−xAs</strong> in a system <strong>AlxGa1−xAs</strong>/<strong>GaAs</strong>. This<br />
system is largely used in opto-electronics and microelectronics,<br />
as an active medium and in building lattice matched<br />
heterostructures 5 .<br />
Recently, studying ultra-fast gap dynamics <strong>of</strong> <strong>AlxGa1−xAs</strong><br />
near <strong>the</strong> crossover we have faced <strong>the</strong> difficulty <strong>of</strong> finding in <strong>the</strong><br />
literature a variety <strong>of</strong> relations <strong>of</strong> energy gap Egap(x) versus<br />
composition <strong>for</strong> <strong>the</strong> <strong>AlxGa1−xAs</strong> alloy 6 . In <strong>the</strong> indirect gap<br />
region <strong>the</strong> data are also scarce 7 . The problems arise in comparing<br />
literature data obtained by different EGap dependencies<br />
and we decided to measure <strong>the</strong> absorption <strong>of</strong> <strong>the</strong> samples that<br />
we were studying.<br />
The films were grown by molecular beam epitaxy (MBE)<br />
over substrates <strong>of</strong> <strong>GaAs</strong> (001). A layer <strong>of</strong> AlAs <strong>of</strong> 500 ˚A<br />
(etching stop layer) was grown between <strong>the</strong> substrate and <strong>the</strong><br />
<strong>AlxGa1−xAs</strong> layer. Above it was grown a 50 ˚A cap layer <strong>of</strong><br />
<strong>GaAs</strong> to protect <strong>the</strong> sample against oxidation (see Fig. 3). We<br />
studied three <strong>AlxGa1−xAs</strong> samples with thickness <strong>of</strong> 150 nm<br />
(x=0.37), 180 nm (x=0.43), and 370 nm (x=0.45).<br />
For <strong>the</strong> <strong>AlxGa1−xAs</strong> when <strong>the</strong> aluminium concentration increases<br />
<strong>the</strong> direct band gap changes from 1.42 eV (<strong>GaAs</strong>) to<br />
2.78 eV (AlAs). Then, when <strong>the</strong> substrate <strong>of</strong> <strong>GaAs</strong> is almost<br />
set point<br />
powermeter<br />
signal<br />
1M2<br />
10K<br />
0V<br />
comparator<br />
3<br />
2<br />
+ _<br />
220nF/250V<br />
8<br />
pump control<br />
7<br />
10K<br />
100KLIN<br />
10K<br />
4<br />
circuit<br />
7<br />
fotodetector<br />
power speed pump<br />
12 VDC<br />
control<br />
+12 VDC<br />
1K3<br />
(a)<br />
LM741P<br />
2.2 μµ F/63V<br />
1M<br />
relay<br />
circuit<br />
Powermeter signal<br />
4K7<br />
1<br />
DB3<br />
10nF/250 V<br />
2<br />
4<br />
(b)<br />
5<br />
E3206L<br />
MA224<br />
mechanical<br />
pump<br />
127 VAC Relay<br />
BC337<br />
Mechanical<br />
pump<br />
Powermeter<br />
0.00 μµ W<br />
laser beam<br />
(c)<br />
3<br />
glass window<br />
127 VAC<br />
6<br />
pump<br />
127 VAC<br />
Laser 780 nm<br />
FIG. 1: (a) Bloch diagram <strong>for</strong> <strong>the</strong> etching system; (b) Electronic<br />
control circuit <strong>of</strong> <strong>the</strong> pumping system. The upper part <strong>of</strong> <strong>the</strong> circuit<br />
is <strong>the</strong> comparator-relay circuit and <strong>the</strong> lower part is <strong>the</strong> flow control<br />
circuit <strong>of</strong> <strong>the</strong> jet pumping; (c) Schematic <strong>of</strong> <strong>the</strong> electromechanical jet<br />
etching system.<br />
removed, it is possible to see red light being transmit through<br />
<strong>the</strong> film. That is <strong>the</strong> reason why red light can be used to monitor<br />
<strong>the</strong> chemical etching.<br />
By using <strong>the</strong> method described in <strong>the</strong> sections 2 and 3 we<br />
prepared <strong>the</strong> three samples <strong>for</strong> absorption studies. In Fig. 4,<br />
we present <strong>the</strong> absorption spectrum measured in <strong>the</strong> x=0.37
Revista de Física Aplicada e Instrumentação, vol. 18, no. 1, Março, 2005 3<br />
FIG. 2: Details <strong>of</strong> a microcavity sample photo (1,5x1,1 mm) which<br />
shows <strong>the</strong> partial etching process (see Fig. 6). The black area is <strong>the</strong><br />
<strong>GaAs</strong> substrate and <strong>the</strong> clear area is <strong>the</strong> AlAs surface without <strong>GaAs</strong><br />
that was removed by <strong>the</strong> etching solution jet.<br />
5 nm <strong>GaAs</strong> cap layer<br />
Al<strong>GaAs</strong> film<br />
stop etching<br />
AlAs (50 nm)<br />
<strong>GaAs</strong> substrate<br />
FIG. 3: Sample structure grown by MBE.<br />
sample <strong>for</strong> different temperatures. At low temperatures we<br />
can even observe <strong>the</strong> presence <strong>of</strong> excitonic resonance that are<br />
due to Coulomb electron-hole interaction. As <strong>the</strong> temperature<br />
<strong>of</strong> <strong>the</strong> sample is lowered <strong>the</strong> exciton energy becomes greater<br />
than <strong>the</strong>rmal energy and we can observe <strong>the</strong> exciton resonance.<br />
As <strong>the</strong> temperature increases <strong>the</strong> resonance broadens<br />
mainly due to phonon collisions.<br />
We observe <strong>the</strong> excitonic resonance at low temperatures <strong>for</strong><br />
all studied samples (Fig. 5). We note also that <strong>the</strong> excitonic<br />
peak <strong>of</strong> <strong>the</strong> x = 0.37 sample (direct gap) is more pronounced<br />
than <strong>the</strong> indirect ones and that <strong>the</strong> absorption edge shifts to<br />
higher energies as <strong>the</strong> aluminium concentration <strong>of</strong> <strong>the</strong> samples<br />
increases.<br />
From <strong>the</strong> measurements at 15 K we can determine <strong>the</strong> direct<br />
gap. This is accomplished summing <strong>the</strong> exciton binding<br />
energy (7 meV) 8 to <strong>the</strong> peaks observed experimentally to determine<br />
<strong>the</strong> gap, i.e., Eg = Elig.exc + Epico. The following table<br />
1 presents <strong>the</strong> gaps <strong>of</strong> <strong>the</strong> studied sample obtained from<br />
<strong>the</strong> last energy relation. Once again, <strong>the</strong>se results illustrate<br />
both <strong>the</strong> importance and <strong>the</strong> resolution <strong>of</strong> this developed etching<br />
system, since we have studied at most one thin film Al-<br />
FIG. 4: Absorption spectrum <strong>of</strong> <strong>the</strong> <strong>AlxGa1−xAs</strong> sample (x=0.37) as<br />
a function <strong>of</strong> <strong>the</strong> temperature.<br />
FIG. 5: Absorption spectrum at 15 K <strong>of</strong> <strong>the</strong> three <strong>AlxGa1−xAs</strong> samples<br />
with different aluminium concentrations.<br />
<strong>GaAs</strong>/AlAs <strong>of</strong> 400 nm <strong>of</strong> thickness. If <strong>the</strong>re is 100 nm <strong>of</strong><br />
<strong>GaAs</strong> substrate at least, our transmitted signal would be absorbed<br />
in <strong>the</strong> substrate, and it would not be possible to have<br />
<strong>the</strong>se optical datas 1<br />
Table 1 - Direct gap determination from <strong>the</strong> absorption<br />
measurements at 15 K<br />
x Eg(eV)<br />
0.37 2.023<br />
0.43 2.108<br />
0.45 2.136
4 M. A. Sagioro et al.<br />
DBR Mirror<br />
14 AlAs/Al<strong>GaAs</strong> pairs<br />
DBR Mirror<br />
16 AlAs/Al<strong>GaAs</strong> pairs<br />
~ 0.24<br />
AlAs<br />
Al<strong>GaAs</strong><br />
<strong>GaAs</strong><br />
B. Microcavity<br />
<strong>GaAs</strong> Cap layer<br />
<strong>GaAs</strong> Substract<br />
~ 0.07<br />
~ 0.005<br />
<strong>GaAs</strong> Quantum Well<br />
~ 0.06<br />
~ 6.5<br />
FIG. 6: A λ <strong>GaAs</strong> microcavity sample structure grown by MBE. The<br />
linear measurements are in micrometers.<br />
This etching process is applied in many laser system as delicate<br />
as one <strong>GaAs</strong> microcavity, in order to remove <strong>the</strong> <strong>GaAs</strong><br />
substrate. A typical <strong>GaAs</strong> microcavity structure is shown in<br />
Fig. 6. The cavity is <strong>for</strong>med by two distributed Brag refractor<br />
mirror (DBR) with one quantum well in <strong>the</strong> center, in order to<br />
match <strong>the</strong> position <strong>of</strong> <strong>the</strong> gain media and <strong>the</strong> electro magnetic<br />
field antinode position. 9<br />
The DBR mirror reflectivity is extremely sensitive to <strong>the</strong><br />
Al<strong>GaAs</strong>/AlAs pair number and layer configurations. The mirror<br />
reflectivity can be estimated from <strong>the</strong> Fabry-Pérot resonance<br />
width at half maximum (FWHM) δ 10 given by<br />
δ = c�α − 1 l ln√ �<br />
R1R2<br />
,<br />
2πn<br />
where c is <strong>the</strong> light velocity, l is <strong>the</strong> cavity effective length, n is<br />
<strong>the</strong> refraction index, α is <strong>the</strong> cavity loss, and R1,2 is <strong>the</strong> cavity<br />
mirror reflectivity. In Fig. 7a, we show <strong>the</strong> reflectance spectrum<br />
<strong>of</strong> <strong>the</strong> microcavity at room temperature obtained with<br />
white light and normalized with <strong>the</strong> white light source reflectance<br />
spectrum <strong>of</strong> a aluminum mirror in order to correct <strong>the</strong><br />
spectrometer gain curve as well as <strong>the</strong> white light source intensity<br />
variation with wavelength. We measured δi = 5 nm<br />
and estimated R = 0.96 <strong>for</strong> this microcavity. After <strong>the</strong> sample<br />
etching, we measured <strong>the</strong> transmitted spectrum with <strong>the</strong> white<br />
light source. From Fig. 7b, we measured <strong>the</strong> cavity resonance<br />
FWHM δ f = 9 nm. We estimated again <strong>the</strong> cavity mirror reflectance<br />
and obtained R = 0.93, showing us a broader cavity<br />
[1] L. H. F. Andrade, R. Marotti, Alain A. Quivy, C. H. Brito Cruz,<br />
“Interplay between direct gap renormalization and intervalley<br />
scattering in AlxGa1-xAs near <strong>the</strong> Gamma-X crossover”, Solid<br />
State Commun. 121, 181-185 (2002).<br />
90<br />
window and lower reflectivity if compared with <strong>the</strong> initial value.<br />
It means that <strong>the</strong> etching process have stopped very close<br />
to <strong>the</strong> first DBR layer, but not enough, since <strong>the</strong> lower reflectance<br />
shows us an introduction <strong>of</strong> loss in one <strong>of</strong> <strong>the</strong> cavity<br />
DBR mirror, which results in a lower cavity finesse.<br />
(a)<br />
(b)<br />
Reflectance<br />
Transmitance<br />
1.0<br />
0.8<br />
0.6<br />
0.4<br />
λ L<br />
δi 890 nm<br />
0.2<br />
750 800 850 900 950 1000<br />
Wavelength (nm)<br />
0.5<br />
0.4<br />
0.3<br />
924 nm<br />
0.2<br />
0.1<br />
0.0<br />
δf 750 800 850 900 950 1000<br />
Wavelength (nm)<br />
FIG. 7: (a) Reflectance spectrum obtained with white light source<br />
from <strong>the</strong> <strong>GaAs</strong> substrate microcavity with resonance window at 890<br />
nm. The laser light at λL=780 nm was used as a probe <strong>for</strong> <strong>the</strong> etching<br />
system process; (b) Transmission curve <strong>for</strong> <strong>the</strong> same microcavity<br />
sample, after removed <strong>the</strong> substrate, showing <strong>the</strong> resonance at<br />
924 nm.<br />
IV. CONCLUSION<br />
We have constructed a jet etching system <strong>for</strong> etching Al-<br />
<strong>GaAs</strong>/<strong>GaAs</strong> semiconductor heterostructures with a resolution<br />
<strong>of</strong> few nanometers thickness. The resolution is demonstrated<br />
in <strong>the</strong> attack <strong>of</strong> <strong>the</strong> thin film <strong>of</strong> Al<strong>GaAs</strong> (in order <strong>of</strong> 100 nm),<br />
since <strong>the</strong> area <strong>of</strong> <strong>the</strong> sample is much bigger than its thickness.<br />
Moreover, we can follow <strong>the</strong> color change <strong>of</strong> <strong>the</strong> sample that<br />
guarantees us a resolution <strong>of</strong> a few nanometers. This etching<br />
system is presented here with some applications and results<br />
<strong>for</strong> absorption experiments. The etching power is illustrated<br />
with some primary applications in absorption spectroscopy <strong>of</strong><br />
Al<strong>GaAs</strong> films, and also <strong>of</strong> <strong>GaAs</strong> microcavity.<br />
V. ACKNOWLEDGEMENT<br />
We acknowledge R. R. Menezes <strong>for</strong> his technical support<br />
and financial support given by CNPq, PRONEX, SEBRAE<br />
and Milênio Institute <strong>of</strong> Nanoscience<br />
[2] M. A. Sagioro, “Interferência quântica em cavidades de baixa<br />
finesse”, tese de doutorado, UFMG, Belo Horizonte (2004).<br />
[3] J. J. Lepore, “An improved technique <strong>for</strong> selective etching <strong>of</strong><br />
<strong>GaAs</strong> and Ga1-xAlxAs”, J. Appl. Phys. 51, 6441-6442 (1980).
Revista de Física Aplicada e Instrumentação, vol. 18, no. 1, Março, 2005 5<br />
[4] R. A. Logan, F. K. Reinhart, “Optical waveguide in<br />
<strong>GaAs</strong>/Al<strong>GaAs</strong> epitaxial layers”, J. Appl. Phys. 44, 4172-4176<br />
(1973).<br />
[5] Jasprit Singh, Semiconductor Optoeletronics-Physics and Technology,<br />
MacGraw-Hill, pp. 443 (1995).<br />
[6] L. Pavesi, M. Guzzi, “Photoluminescence <strong>of</strong> AlxGa1-xAs alloys”,<br />
J. Appl. Phys. 75, 4779-4842 (1994).<br />
[7] S. Lassen, R. Schwabe, J. L. Staehli, “Indirect-gap AlxGa1-xAs<br />
and its similarity to gap”, Semicond. Sci. Technol. 10, 903-913<br />
(1995).<br />
[8] H. Kalt, M. Rinker, “Band-gap renormalization in semiconduc-<br />
tors with multiple inequivalent valleys”, Phys. Rev. B 45, 1139-<br />
1154 (1992).<br />
[9] Y. Yamamoto, S. Inoue, H. Heitmann, G. Bjork, and F. M. Matinaga,<br />
“Quantum Optics Effects in Semiconductor Lasers”, book<br />
chapter <strong>of</strong>: Semiconductor Lasers I: Fundamentals, pp. 361-<br />
441, Edited by Eli Kapon, Academic Press, San Diego CA-<br />
USA, 1999.<br />
[10] A. Yariv, Quantum Electronics, Chap.7, Ed. By John Wiley &<br />
Sons, New York, USA 1987.