pdf 349K - Stanford Exploration Project - Stanford University
pdf 349K - Stanford Exploration Project - Stanford University
pdf 349K - Stanford Exploration Project - Stanford University

Create successful ePaper yourself
Turn your PDF publications into a flip-book with our unique Google optimized e-Paper software.
2 Brown and Clapp SEP–108<br />
tween depth-converted seismic and VSP data (or sonic log picks) and use it to compute a<br />
correction velocity. The reliability of such algorithms is hampered by the assumption that the<br />
VSP data is error-free, when in fact, these data have random (hopefully) first-break-picking<br />
errors and also possibly exhibit correlated errors resulting from correction of deviated well<br />
VSP data to vertical (Noponen, 1995).<br />
Various authors have employed least-squares optimization algorithms to solve a related<br />
problem: the estimation of an optimal time shift to tie crossing 2-D seismic lines at the intersections<br />
(Bishop and Nunns, 1994; Harper, 1991). While these algorithms correctly assume<br />
that all data has errors, they assume that these errors are uncorrelated, or in other words, that<br />
the data are realizations of the same random variable. We expect seismic time/depth pairs to<br />
differ from VSP time/depth pairs by a low frequency shift, and that both data have random<br />
errors. Figure 1 illustrates this relationship as shifted probability distribution functions. A<br />
common view in practice, and one espoused by geostatistics, is that the inherent inaccuracy,<br />
or “softness” of seismic data causes the observed misfit between seismic and wellbore data<br />
(Mao, 1999). No attempt is made to estimate the joint data correlation, and the net effect is a<br />
faulty assumption that the seismic data is less accurate than it really is.<br />
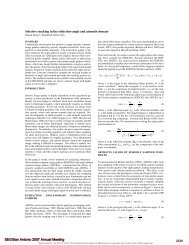
In this paper, we present a nonlinear least-squares algorithm using VSP and surface seismic<br />
data for the simultaneous estimation of interval velocity and an additive seimic correction<br />
velocity. We test the algorithm on a real VSP dataset. To simulate seismic data, we perturb<br />
the VSP data with depth errors derived from a positive velocity anomaly. The tests show that<br />
our algorithm correctly handles the errors in VSP data and leads to an unbiased residual. We<br />
also add random errors to both the VSP and seismic data and show that by assuming that the<br />
data are correlated, we can improve the final result.<br />
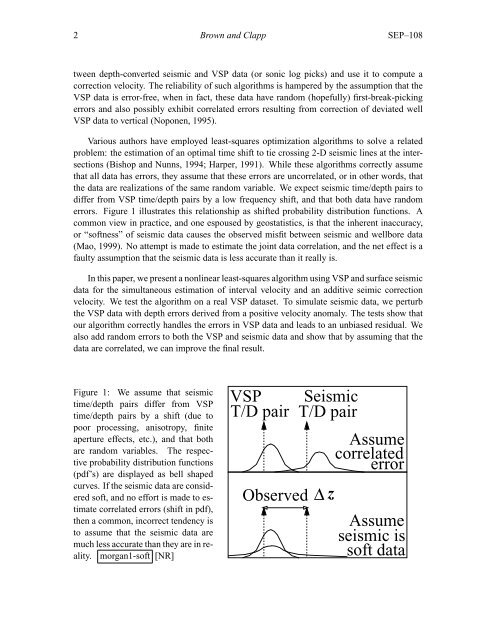
Figure 1: We assume that seismic<br />
time/depth pairs differ from VSP<br />
time/depth pairs by a shift (due to<br />
poor processing, anisotropy, finite<br />
aperture effects, etc.), and that both<br />
are random variables. The respective<br />
probability distribution functions<br />
(<strong>pdf</strong>’s) are displayed as bell shaped<br />
curves. If the seismic data are considered<br />
soft, and no effort is made to estimate<br />
correlated errors (shift in <strong>pdf</strong>),<br />
then a common, incorrect tendency is<br />
to assume that the seismic data are<br />
much less accurate than they are in reality.<br />
morgan1-soft [NR]<br />
VSP Seismic<br />
T/D pair T/D pair<br />
Observed Δ z<br />
Assume<br />
correlated<br />
error<br />
Assume<br />
seismic is<br />
soft data