Climate Change Teacher's Guide - Lawrence Hall of Science
Climate Change Teacher's Guide - Lawrence Hall of Science
Climate Change Teacher's Guide - Lawrence Hall of Science

Create successful ePaper yourself
Turn your PDF publications into a flip-book with our unique Google optimized e-Paper software.
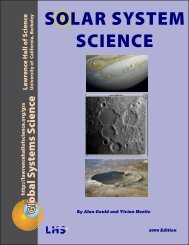
Global<br />
Systems<br />
<strong>Science</strong><br />
<strong>Climate</strong> <strong>Change</strong><br />
Teacher’s <strong>Guide</strong><br />
by Cary Sneider, Richard Golden,<br />
Florence Gaylin<br />
Contents<br />
Teaching Objectives ..............................................................4<br />
Assessment Tasks ..................................................................6<br />
<strong>Climate</strong> <strong>Change</strong>—Questionnaire ................................................8<br />
<strong>Climate</strong> <strong>Change</strong>—Concept Map ............................................... 10<br />
Planning Your GSS Course ..................................................... 11<br />
Activities Related to <strong>Climate</strong> <strong>Change</strong> ....................................... 13<br />
Page by Page Suggestions ...................................................... 15<br />
Chapter 1. What is the Greenhouse Effect? ........................... 15<br />
Chapter 2. What Is Global Warming? .................................... 15<br />
Chapter 3. What Is the Controversy About? ........................... 16<br />
Chapter 4. What’s So Special About CO2? ............................. 29<br />
Chapter 5 How Can We Measure Carbon Dioxide? .................. 32<br />
Chapter 6 Is the Atmosphere Really Changing? ...................... 37<br />
Chapter 7. What Are the Greenhouse Gases? ......................... 40<br />
Chapter 8. What Are Governments Doing About Global Warming? 52<br />
Chapter 9. What Do You Think About Global <strong>Climate</strong> <strong>Change</strong>? .... 53<br />
Additional Resources for Teaching <strong>Climate</strong> <strong>Change</strong> ..................... 54<br />
Bibliography for <strong>Climate</strong> <strong>Change</strong> ............................................ 58<br />
Index <strong>of</strong> Investigations/Activities ............................................ 62<br />
http://www.lawrencehall<strong>of</strong>science.org/GSS<br />
<strong>Lawrence</strong> <strong>Hall</strong> <strong>of</strong> <strong>Science</strong>
Sources <strong>of</strong> Support<br />
NIGEC. Development and publication <strong>of</strong> the Global Systems <strong>Science</strong> (GSS) series<br />
was supported by the Office <strong>of</strong> <strong>Science</strong>, Biological and Environmental Research<br />
Program (BER), U.S. Department <strong>of</strong> Energy, through the Western Regional<br />
Center <strong>of</strong> the National Institute for Global Environmental <strong>Change</strong> (NIGEC) under<br />
Cooperative Agreement No. DE-FC03-90ER61010. Noreen Dowling, Joseph Knox,<br />
Linda Ono, and Thomas Suchanek provided assistance to this project on behalf<br />
<strong>of</strong> NIGEC and WESTGEC.<br />
NSF. The opportunity to involve high school teachers in the development <strong>of</strong> this<br />
project was made possible by a grant from the Teacher Enhancement Program <strong>of</strong><br />
the National <strong>Science</strong> Foundation (Grant #TPE 9155393). This grant enabled us<br />
to invite 125 teachers to test these materials with their students, then come to<br />
Berkeley for three weeks, where they reported on trial test results, suggested<br />
improvements in the printed materials, and developed new laboratory activities.<br />
We are indebted to Larry G. Enochs and Wayne Sukow, Program Directors <strong>of</strong> the<br />
National <strong>Science</strong> Foundation, as well as to many teachers and students whose<br />
insights, ideas, and hard work have helped bring the GSS series to fruition.<br />
NASA. Printing and distribution <strong>of</strong> the GSS <strong>Guide</strong>s is courtesy <strong>of</strong> NASA’s Earth <strong>Science</strong><br />
Enterprise (ESE), under a Memorandum <strong>of</strong> Understanding between NASA and<br />
the University <strong>of</strong> California at Berkeley. Nahid Khazenie provided assistance on<br />
behalf <strong>of</strong> NASA/ESE. The purpose <strong>of</strong> this agreement is to provide the broadest<br />
possible distribution to high schools throughout the United States at the lowest<br />
possible cost.<br />
Financial support does not constitute an endorsement by DOE, NSF, or NASA <strong>of</strong> the<br />
views expressed in this book.<br />
To obtain latest revised editions <strong>of</strong> GSS books through University <strong>of</strong> California,<br />
<strong>Lawrence</strong> <strong>Hall</strong> <strong>of</strong> <strong>Science</strong>, please visit the GSS website:<br />
http://www.lawrencehall<strong>of</strong>science.org/gss/<br />
© 1998, 2001, 2002, 2008 by The Regents <strong>of</strong> the University <strong>of</strong> California. All rights<br />
reserved. Printed in the United States <strong>of</strong> America. This work may not be<br />
reproduced by mechanical or electronic means without written permission from<br />
the <strong>Lawrence</strong> <strong>Hall</strong> <strong>of</strong> <strong>Science</strong>, except for pages to be used in classroom activities<br />
and teacher workshops. For permission to copy portions <strong>of</strong> this material for<br />
other purposes, please write to: Global Systems <strong>Science</strong>, <strong>Lawrence</strong> <strong>Hall</strong> <strong>of</strong><br />
<strong>Science</strong>, University <strong>of</strong> California, Berkeley, CA 94720-5200 or e-mail gssmail@<br />
berkeley.edu.<br />
Global Systems <strong>Science</strong> is an activity <strong>of</strong> the <strong>Lawrence</strong> <strong>Hall</strong> <strong>of</strong> <strong>Science</strong>, University <strong>of</strong><br />
California, Berkeley. The director <strong>of</strong> the <strong>Lawrence</strong> <strong>Hall</strong> <strong>of</strong> <strong>Science</strong> is Elizabeth<br />
Stage.<br />
GSS is also an activity <strong>of</strong> the Museum <strong>of</strong> <strong>Science</strong> in Boston, Massachusetts, which<br />
provides assistance in revising and disseminating the program. The President<br />
and Director <strong>of</strong> the Museum <strong>of</strong> <strong>Science</strong> is David W. Ellis.
The Global Systems <strong>Science</strong> Series<br />
Global Systems <strong>Science</strong> (GSS) is an<br />
interdisciplinary course for high school students<br />
that emphasizes how scientists from a wide variety<br />
<strong>of</strong> fields work together to understand significant<br />
problems <strong>of</strong> global impact. The Teacher’s <strong>Guide</strong><br />
to Global Systems <strong>Science</strong> provides an overview <strong>of</strong><br />
the entire series and makes recommendations for<br />
how a course in this subject can be structured and<br />
presented. It is strongly recommended that teachers<br />
consult that guide before beginning a GSS course for<br />
their students.<br />
The Teachers’ <strong>Guide</strong> to GSS suggests that every<br />
course using this series begin with the unit A New<br />
World View, which introduces the entire field <strong>of</strong><br />
global systems science, and presents four key ideas<br />
that thread through the entire series: First, the<br />
Earth has tremendously diverse environments, yet<br />
it is a single planet that we all call “home.” Second,<br />
we can better understand the Earth if we think <strong>of</strong> it<br />
in terms <strong>of</strong> systems. Third, everything is connected<br />
to everything else. And fourth, the goal <strong>of</strong> global<br />
studies is to find out what we can do to sustain life on<br />
Planet Earth—now and in the generations to come.<br />
A New World View can be followed by any other<br />
units in the series, depending on the purpose and<br />
context for the entire program. Several alternatives<br />
are suggested in the Teacher’s <strong>Guide</strong> to GSS.
Teaching Objectives<br />
<strong>Climate</strong> <strong>Change</strong> addresses the controversial question <strong>of</strong> how human activities<br />
may be changing Earth’s climate. The guide begins by inviting students to view<br />
the controversy within the scientific community, and to see how that controversy<br />
has gradually shifted to consensus on most key issues between 1988 and 1996. The<br />
second chapter, which summarizes where the controversy stands today, poses a<br />
dilemma that is frequently found at the interface <strong>of</strong> science and society: “Decisionmakers<br />
want clear, definite answers, but the very nature <strong>of</strong> science is that it rarely<br />
produces certainty.” As students explore each <strong>of</strong> the issues at the forefront <strong>of</strong><br />
research today, they learn about fundamental concepts <strong>of</strong> Earth systems and how<br />
scientists use both theory and experiment to resolve the outstanding issues.<br />
Chapter three <strong>of</strong>fers a deeper understanding <strong>of</strong> the fundamental physical<br />
theory that underlies the theory <strong>of</strong> global warming and the greenhouse effect.<br />
It provides an overview <strong>of</strong> modern theories <strong>of</strong> matter and energy and their<br />
interactions, leading to the understanding that greenhouse gas molecules absorb<br />
infrared energy because they resonate at infrared frequencies. This principle is<br />
applied to a greenhouse, and to Earth systems, pointing out how these systems<br />
are similar and different.<br />
In Chapter four and five, the students take a “field trip” to Mauna Loa<br />
Observatory where they see how scientists have measured carbon dioxide in the<br />
Earth’s atmosphere since 1957. They graph and interpret data from Mauna Loa<br />
and other observatories which led to the prediction, in 1988, that changes in our<br />
atmosphere will cause the entire globe to gradually warm up. They also measure<br />
carbon dioxide in the laboratory to find out how much is contained in a sample<br />
<strong>of</strong> human breath and car exhaust. The chapter ends with a look at evidence<br />
for human activities which now thought to be responsible for the increase in<br />
atmospheric carbon dioxide. An overview <strong>of</strong> all <strong>of</strong><br />
the greenhouse gases and their sources is provided<br />
in Chapter 7.<br />
The last two chapters relate the science <strong>of</strong><br />
global warming to implications for social policy.<br />
Excerpts from a Congressional hearing on climate<br />
change, and consideration <strong>of</strong> President Clinton’s<br />
Action Plan bring the controversy up to date, and<br />
invite students to wrestle with the dilemma <strong>of</strong><br />
setting social policy in light <strong>of</strong> scientific findings<br />
which are clear on some questions, but uncertain<br />
on others. In the last chapter students examine the<br />
possibility <strong>of</strong> global warming from the viewpoints<br />
<strong>of</strong> science and technology, economics, politics,<br />
and ethics, and are encouraged to crystallize their<br />
personal views <strong>of</strong> what it all means, and what, if<br />
anything, should be done about it. The goals <strong>of</strong><br />
this module are briefly summarized next.<br />
Goal 1: Students realize how our way <strong>of</strong> life depends<br />
on Earth’s stable climate.<br />
Objective 1A: Students can distinguish between<br />
the natural greenhouse effect, which has kept<br />
our planet at a livable temperature for billions<br />
<strong>of</strong> years, and the increased greenhouse effect,<br />
in which human activities may be changing the<br />
climate <strong>of</strong> our planet over a relatively short<br />
time scale <strong>of</strong> a century or two.<br />
Objective 1B: Students can describe what might<br />
occur if the global climate increases by just<br />
a few degrees, ranging from positive effects,<br />
such as increased rainfall and plant growth,<br />
to negative effects, such as increased flooding<br />
and drought, loss <strong>of</strong> coastal plains and<br />
wetlands, changing forests, and threats to<br />
human health.<br />
Objective 1C: Students can explain why global<br />
climate change is controversial: a change<br />
in climate would have significant impact on<br />
people and the environment; but doing what<br />
is required to prevent climate change would<br />
cause economic difficulties. Deciding what<br />
to do is even more difficult because scientists<br />
cannot provide answers to all <strong>of</strong> the policymakers’<br />
questions.<br />
4 Global Systems <strong>Science</strong> <strong>Climate</strong> <strong>Change</strong> Teacher’s <strong>Guide</strong>
Goal 2: Students grasp how the greenhouse effect controls Earth’s<br />
climate.<br />
Objective 2A: Students can use the concept <strong>of</strong> resonance to explain why<br />
carbon dioxide and other greenhouse gases absorb infrared energy,<br />
while oxygen and nitrogen do not.<br />
Objective 2B: Students can explain how the absorption <strong>of</strong> infrared<br />
energy by glass leads to warming <strong>of</strong> a greenhouse.<br />
Objective 2C: Students can describe how warming <strong>of</strong> a greenhouse<br />
is similar to and different from what occurs in the Earth’s<br />
atmosphere.<br />
Objective 2D: Students can describe how the Earth’s climate would<br />
change if the greenhouse effect were to significantly increase or<br />
decrease.<br />
Objective 2E: Students can explain major points <strong>of</strong> agreement and<br />
disagreement among scientists about the prospect <strong>of</strong> global<br />
warming.<br />
Goal 3: Students understand how we know that greenhouse gases are<br />
increasing, and how the observed increase is related to human<br />
activities.<br />
Objective 3A: Students can describe how the concentration <strong>of</strong> carbon<br />
dioxide in the air can be measured by chemical analysis.<br />
Objective 3B: Students are able to describe how the concentration <strong>of</strong><br />
carbon dioxide in the air is measured at Mauna Loa Observatory.<br />
Objective 3C: Students can discuss the results <strong>of</strong> the observations at<br />
Mauna Loa and the South Pole, and draw conclusions about both<br />
seasonal and long term changes in the concentration <strong>of</strong> carbon<br />
dioxide in the atmosphere.<br />
Objective 3D: Students are able to identify the burning <strong>of</strong> fossil fuels<br />
as the main source <strong>of</strong> increased carbon dioxide; and three factors<br />
that lead to increased fossil fuel burning: growing human population,<br />
industrialization, and deforestation.<br />
Objective 3E: Students are able to able to identify greenhouse gases<br />
besides carbon dioxide and discuss some <strong>of</strong> the human activities<br />
that lead to their increase in the atmosphere.<br />
Goal 4: Students formulate a personal response to the possibility <strong>of</strong><br />
global warming .<br />
Objective 4A: Students can describe efforts being made by world<br />
governments and by the U.S. government to reduce the emission <strong>of</strong><br />
greenhouse gases.<br />
Objective 4B: Students formulate a personal position on global warming<br />
and the greenhouse effect, taking into account perspectives <strong>of</strong><br />
science and technology, economics, politics, and ethics. Their<br />
position is clearly stated, and leads to a conclusion about whether<br />
strong action, moderate action, or no action is necessary to reduce<br />
the buildup <strong>of</strong> greenhouse gases in the atmosphere.<br />
Global Systems <strong>Science</strong> <strong>Climate</strong> <strong>Change</strong> Teacher’s <strong>Guide</strong> 5
Assessment Tasks<br />
1. Portfolios<br />
General ideas for assessing student progress towards the goals and objectives <strong>of</strong> the<br />
GSS course are suggested on pages 19-23 <strong>of</strong> The Teacher’s <strong>Guide</strong> - Overview <strong>of</strong> the GSS. We<br />
especially encourage the use <strong>of</strong> portfolios as a means <strong>of</strong> providing feedback to students and<br />
to demonstrate evidence <strong>of</strong> student progress to parents. Portfolios for <strong>Climate</strong> <strong>Change</strong> might<br />
include:<br />
• Short writing assignments, such as analysis <strong>of</strong> the newspaper articles on pages<br />
10-11.<br />
• A series <strong>of</strong> written statements, which students select from their own writings during<br />
the unit, showing how their ideas may have changed as they learned new information,<br />
or took new perspectives into account.<br />
• Written results <strong>of</strong> laboratory work, from short activities such as use <strong>of</strong> an infrared<br />
remote control device on page 32 , to the complete laboratory investigations on pages<br />
33 and 44.<br />
• Graphs and analyses <strong>of</strong> the Mauna Loa data from Chapter five.<br />
• “What are the human caused sources <strong>of</strong> carbon dioxide?” investigation, especially the<br />
question, “How Has the Area Where You Lived <strong>Change</strong>d?” from page 54. An example <strong>of</strong><br />
a student’s essay from this assignment can be found on page 22 <strong>of</strong> the GSS Teacher’s<br />
<strong>Guide</strong> (Overview <strong>of</strong> the GSS Course.)<br />
• Answers to questions on pages 67, 69, and 73.<br />
• Observational report <strong>of</strong> students’ individual contributions to small group work<br />
throughout the unit, and especially within the “caucus” group discussions in Chapter<br />
9.<br />
• Final essay in which students describe their personal position on global climate change,<br />
assigned on page 80 .<br />
In addition to portfolios, we suggest that you<br />
use assessment tasks both before and after<br />
presenting the unit. The papers that students’<br />
complete before beginning the unit will help<br />
you diagnose their needs and adjust your plans<br />
accordingly. Comparing these papers to the<br />
students’ responses on the same tasks after<br />
completing the unit will allow you to determine<br />
how your students’ understanding and attitudes<br />
have changed as a result <strong>of</strong> instruction. Tasks<br />
which we suggest be used for pre- and post-<br />
assessment are as follows:<br />
2. Questionnaire<br />
These questions are designed to determine how<br />
students’ knowledge <strong>of</strong> key concepts have changed<br />
during the unit, and whether or not they have<br />
changed their opinions concerning personal actions<br />
and environmental issues. The Questionnaire is a<br />
traditional way to elicit student understanding. It<br />
assesses students’ abilities to express themselves<br />
as well as insights that they gained from the unit.<br />
The Concept Map is nonlinear. Students do not need<br />
to think in terms <strong>of</strong> sentences and paragraphs, and<br />
their ideas can flow more freely. Students who are<br />
more visual might be better able to show what they<br />
know on this task than on the Questionnaire.<br />
3. Concept Map<br />
Asking students to create a concept map before<br />
and after the unit is one way to determine which<br />
concepts they have learned and their understanding<br />
<strong>of</strong> the connections among these concepts. If students<br />
have not had experience in concept mapping, you<br />
might want to start them out with a hand-out showing<br />
an example (master on p. 7), a general idea <strong>of</strong> what<br />
they are to map, and starting word(s) to help get<br />
them started. Once they have had experience with<br />
concept maps, they can create them on blank sheets<br />
<strong>of</strong> paper (no photocopying required). Alternatively,<br />
6 Global Systems <strong>Science</strong> <strong>Climate</strong> <strong>Change</strong> Teacher’s <strong>Guide</strong>
they can use concept mapping s<strong>of</strong>tware such as<br />
Inspiration (http://www.inspiration.com)<br />
Decision Explorer (http://www.banxia.com/demain.html).<br />
CMap (http://cmap.coginst.uwf.edu - free for noncommercial use).<br />
Compendium (http://www.compendiuminstitute.org - free download).<br />
Omnigraffle (http://www.omnigroup.com/applications/omnigraffle Mac OSX)<br />
Freemind (http://freemind.sourceforge.net/wiki/index.php/Main_Page - open source<br />
s<strong>of</strong>tware for mind-mapping.)<br />
Micros<strong>of</strong>t Draw (comes with Micros<strong>of</strong>t Office)<br />
Some possible key words to use: systems, global, equilibrium, energy,<br />
ozone, climate, climate change, greenhouse effect, greenhouse gases,<br />
temperature, warming, global warming, carbon dioxide, methane, society.<br />
Interpreting Student Responses<br />
The tasks should be interpreted in terms <strong>of</strong> the objectives listed on page<br />
4-5. This is straightforward in the case <strong>of</strong> the questionnaire, where questions<br />
correspond to the objectives as follows:<br />
Goal Objective Questionnaire<br />
1 1A 3<br />
1B 13<br />
1C 14<br />
2 2A 5<br />
2B 1<br />
2C 3<br />
Number<br />
2D 4,13<br />
2E 11, 12<br />
3 3A 6<br />
3B 7<br />
3C 8,9<br />
3D 9, 14<br />
3E 10<br />
4 4A 15<br />
4B 16<br />
The Concept Map task is more loosely<br />
related to specific objectives. Comparing<br />
students’ papers before and after instruction<br />
may show that they have learned more about<br />
some objectives than others, or that certain<br />
misconceptions persist while others have been<br />
corrected. Eventually, we hope to be able to<br />
provide sets <strong>of</strong> instructions (called “rubrics”)<br />
to score student papers with respect to course<br />
objectives; but we do not yet have enough<br />
student data to do this.<br />
These two tasks fall along a spectrum<br />
from traditional to nontraditional<br />
ways <strong>of</strong> assessing student progress.<br />
The Questionnaire is a traditional<br />
way to elicit student understanding.<br />
It assesses students’ abilities to<br />
express themselves as well as insights<br />
that they gained from the unit. The<br />
Concept Map is nonlinear. Students<br />
do not need to think in terms <strong>of</strong><br />
sentences and paragraphs, and their<br />
ideas can flow more freely. Students<br />
who are more visual might be better<br />
able to show what they know on this<br />
task than on the Questionnaire.<br />
In the meantime, we suggest that you pair<br />
students’ pre-and post-assessment papers and<br />
compare them. With the list <strong>of</strong> objectives in mind,<br />
look for changes in the students’ attitudes and<br />
understanding. As you look through your students’<br />
papers, you’ll be able to jot comments for individual<br />
students concerning main points they may have<br />
missed, or praising them for their insights and<br />
ideas. After looking over all <strong>of</strong> the papers you will<br />
be able to write down some generalizations about<br />
what the class as a whole learned or did not learn<br />
during the course.<br />
The Questionnaire and Concept Map tasks are<br />
presented on the following pages. You may want to<br />
make two class sets <strong>of</strong> each <strong>of</strong> the tasks, using one<br />
color <strong>of</strong> paper for the pre-assessment measures and<br />
a different color <strong>of</strong> paper for the post-assessment<br />
measures.<br />
Global Systems <strong>Science</strong> <strong>Climate</strong> <strong>Change</strong> Teacher’s <strong>Guide</strong> 7
Name____________________________________ Age____ Date____________________<br />
<strong>Climate</strong> <strong>Change</strong>—Questionnaire<br />
There is a great deal <strong>of</strong> controversy about whether or not Earth’s climate is warming up. If the<br />
Earth’s climate is changing, there is debate about what may be causing these changes and what may<br />
result.<br />
The Greenhouse Effect<br />
1. Describe what occurs in a glass greenhouse so that it becomes warmer inside than outside.<br />
2. How is the greenhouse effect in an actual greenhouse different from what occurs in the Earth’s<br />
atmosphere?<br />
all?<br />
3. What is the difference between the “natural” and “increased” greenhouse effect?<br />
4. How would Earth’s climate be different if there were no carbon dioxide in the atmosphere at<br />
Carbon Dioxide and Other Greenhouse Gases<br />
5. Why does carbon dioxide absorb infrared energy while oxygen and nitrogen do not?<br />
6. How could you measure the concentration <strong>of</strong> carbon dioxide in a sample <strong>of</strong> gas?<br />
7. How do scientists measure the concentration <strong>of</strong> carbon dioxide in the atmosphere?<br />
8. How does the concentration <strong>of</strong> carbon dioxide in the atmosphere change during the year? What<br />
causes the change?<br />
8 Global Systems <strong>Science</strong> <strong>Climate</strong> <strong>Change</strong> Teacher’s <strong>Guide</strong>
9. How has the concentration <strong>of</strong> carbon dioxide changed since 1958? What caused the<br />
change?<br />
10. Name at least three other greenhouse gases and where they come from.<br />
<strong>Climate</strong> <strong>Change</strong><br />
11. On the subject <strong>of</strong> global warming, what do scientists agree about?<br />
12. Describe at least four issues on which scientists disagree about global warming.<br />
13. Name at least four environmental changes that may occur if Earth’s climate warms up, and<br />
when they might occur.<br />
14. What actions have been proposed within the United States to reduce the possibility <strong>of</strong> global<br />
warming?<br />
15. Why is it difficult for the U.S. Congress to come to agreement on actions to reduce the possibility <strong>of</strong> global<br />
warming?<br />
16. What is your personal opinion: Should we take actions to reduce the possibility <strong>of</strong> global warming? If so what<br />
could you do personally? If not, why not?<br />
Global Systems <strong>Science</strong> <strong>Climate</strong> <strong>Change</strong> Teacher’s <strong>Guide</strong> 9
Name____________________________________ Date___________________<br />
<strong>Climate</strong> <strong>Change</strong>—Concept Map<br />
A concept map is a way <strong>of</strong> displaying<br />
your knowledge about a certain subject area. It<br />
consists <strong>of</strong> a set <strong>of</strong> words in boxes representing the<br />
most important ideas. The boxes are connected<br />
by lines and words showing how the ideas in the<br />
boxes are related. For example, at right is a<br />
concept map about the United States.<br />
Your task is to create a concept map about<br />
the <strong>Climate</strong>. Your concept map should show<br />
ways <strong>of</strong> thinking about the <strong>Climate</strong> and Earthas<br />
a system. Start with the word “<strong>Climate</strong>” at the<br />
top. (If you’d like more space, you can draw your<br />
concept map on the back, or on another sheet <strong>of</strong><br />
paper.)<br />
<strong>Climate</strong><br />
United States<br />
which includes is a<br />
50 states country<br />
each containing in governed by<br />
rural President<br />
areas<br />
Courts<br />
urban suburban North<br />
areas areas America Congress<br />
which also includes<br />
Mexico Canada<br />
10 Global Systems <strong>Science</strong> <strong>Climate</strong> <strong>Change</strong> Teacher’s <strong>Guide</strong>
Planning Your GSS Course<br />
Global Systems <strong>Science</strong> is intended to be an inquiry-based course,<br />
with many hands-on laboratory activities and interactive discussions;<br />
but the extent to which it actually is based on inquiry depends on<br />
you!<br />
The student guide, <strong>Climate</strong> <strong>Change</strong>, contains two laboratory<br />
experiments (in chapters 3 and 4), a data analysis activity in chapter<br />
5, and several brief activities and projects in the other chapters that<br />
involve students in experimenting with materials at home, critical<br />
reading, discussions, and writing.<br />
This Teacher’s <strong>Guide</strong> to GSS provides additional ideas for you to<br />
enrich the course, beginning with short descriptions <strong>of</strong> activities from<br />
collections that have already been published. This are listed on the next<br />
two pages under the heading “Activities Related to <strong>Climate</strong> <strong>Change</strong>.”<br />
The list was prepared by three high school teachers who participated<br />
in a GSS Summer Institute in 1995. The teachers selected them from<br />
a large library <strong>of</strong> collected resources for teachers. They are listed<br />
here according to the chapter <strong>of</strong> the student guide that they would<br />
be most appropriate for.<br />
The remainder <strong>of</strong> this Teacher’s <strong>Guide</strong> <strong>of</strong>fers additional laboratory<br />
activities developed by other participants in the GSS Summer Institutes.<br />
They range from fairly well-developed descriptions containing lists <strong>of</strong><br />
materials and student data sheets, to ideas for activities that you may<br />
wish to develop further. These suggestions are included at appropriate<br />
places in the body <strong>of</strong> this Teacher’s <strong>Guide</strong>. We recommend that you<br />
spend some time looking through the entire <strong>Guide</strong> to decide which<br />
activities are most appropriate for your students, and which are<br />
feasible given the constraints <strong>of</strong> time and resources that you have to<br />
work with.<br />
Additionally, we encourage you to supplement students trace energy from its production within<br />
these materials with relevant articles about global the Sun, to what happens to it when it enters<br />
and local environmental issues, as well as other the atmosphere and interacts with greenhouse<br />
related instructional materials that you may already gases.<br />
have on your library shelf.<br />
• Energy Use familiarizes students with the vast<br />
When this unit is completed, you may wish infrastructure that enables us to draw on Earth<br />
to plan other GSS units that follow logically from resources to meet our energy needs. Students<br />
<strong>Climate</strong> <strong>Change</strong>. For example:<br />
consider the magnitude <strong>of</strong> fossil fuel burning,<br />
• Life and <strong>Climate</strong> is concerned with the evolution how it effects global systems including Earth’s<br />
<strong>of</strong> our planet over the past 4.6 billion years. climate system, and what can be done to modify<br />
It emphasizes the factors that have affected these trends.<br />
the Earth’s atmosphere and climate, how the • Population Growth is about how the rapid growth<br />
changing climate has affected the evolution <strong>of</strong> human populations is impacting world systems,<br />
<strong>of</strong> life, and how life has pr<strong>of</strong>oundly affected including production <strong>of</strong> greenhouse gases.<br />
Earth’s climate in the past. Students learn The ideas presented in the Chapter-By-Chapter<br />
how we know what we know about Earth’s notes, which begin on page 15, are just suggestions.<br />
prehistory, and meet several Earth Systems From time to time we will make suggestions for small<br />
scientists. Life and <strong>Climate</strong> can be viewed as or large group discussions, questions to encourage<br />
a companion volume to <strong>Climate</strong> <strong>Change</strong> in that thinking about the information that is presented, or<br />
it places current climate trends into a much ways to engage the students’ interests. However,<br />
broader context.<br />
your best guide will be your own intuitions about<br />
• Energy Flow illustrates one set <strong>of</strong> principles how to get the students to interact with each other,<br />
on which scientists base their analysis and comparing and contrasting their reactions and<br />
prediction <strong>of</strong> global climate change. In chapters opinions about the information in <strong>Climate</strong> <strong>Change</strong><br />
most closely related to <strong>Climate</strong> <strong>Change</strong>, and the results <strong>of</strong> their activities.<br />
Global Systems <strong>Science</strong> <strong>Climate</strong> <strong>Change</strong> Teacher’s <strong>Guide</strong> 11
Please keep in mind that this Teacher’s <strong>Guide</strong> is a work in progress. If<br />
you are reading these words you are a trial test teacher, and your input is<br />
urgently needed. Each teaching day, please annotate the guide in the wide<br />
margin, concerning questions you asked students, how you introduced the<br />
material, and additional activities that you used. Please note with a star (*)<br />
or some other symbol what seemed to work best in helping your students grasp<br />
concepts, formulate opinions, develop skills, or recognize the relationship<br />
between their own actions and global environmental change, so we can be<br />
sure to include these in the next version <strong>of</strong> the Teacher’s <strong>Guide</strong>. Mark with<br />
an (x) ideas that did not work well, and add notes in the margins to suggest<br />
what went wrong, and how you think we should change the Teacher’s <strong>Guide</strong>.<br />
Send your suggestions to:<br />
Global Systems <strong>Science</strong><br />
<strong>Lawrence</strong> <strong>Hall</strong> <strong>of</strong> <strong>Science</strong><br />
University <strong>of</strong> California<br />
Berkeley, CA 94720-5200.<br />
Thank you! — The Authors<br />
12 Global Systems <strong>Science</strong> <strong>Climate</strong> <strong>Change</strong> Teacher’s <strong>Guide</strong>
Activities Related to <strong>Climate</strong> <strong>Change</strong><br />
by Linda Baker, Davis Senior High School, Davis, CA<br />
Sue Green, Miami Beach Senior High School, Miami Beach, FL<br />
Marjorie Knights, Miami Douglas Macarthur High School, Hialeah, FL<br />
Robbie Robinette, North Caroline High School, Ridgly, MD<br />
The following activities were selected from a large number <strong>of</strong> published<br />
resources for teachers concerning global environmental change. Criteria<br />
for selection were that they promote student inquiry, and that they help to<br />
illuminate one or more <strong>of</strong> the concepts presented in <strong>Climate</strong> <strong>Change</strong>. They<br />
are listed below according to the chapter in <strong>Climate</strong> <strong>Change</strong> to which they<br />
are most closely related.<br />
Chapter 1 What Is Global Warming?<br />
“Volcanic Eruptions and Global <strong>Climate</strong> <strong>Change</strong>,” is an activity from the<br />
Global <strong>Change</strong> Education Resource <strong>Guide</strong> by Lynn l. Martensen. In this<br />
activity, students locate major volcanoes and predict how a major volcanic<br />
eruption might change the global climate. They investigate the effect <strong>of</strong><br />
acid precipitation from volcanoes on different types <strong>of</strong> rocks, and examine<br />
the influence <strong>of</strong> wind currents on aerosol distribution.<br />
The Global <strong>Change</strong> Education Resource <strong>Guide</strong> is<br />
organized by topic: Natural <strong>Climate</strong> Variability,<br />
Greenhouse Effect, Sea-Level Rise, Ozone<br />
Depletion, Ecosystem Response, and Decision-<br />
Making Under Scientific Uncertainty. Each<br />
topic includes fact sheets, articles, learning<br />
activities, color overhead transparencies and<br />
duplicate slides.<br />
Global <strong>Change</strong> Education Resource <strong>Guide</strong> by Lynn<br />
L. Martensen, Office <strong>of</strong> Global Programs, NOAA,<br />
1100 Wayne Ave. Suite 1225, Silver Spring, MD<br />
20910.<br />
“Air Pollution Discovery: A Scavenger Hunt” is a gold<br />
mine activity. It must be done as a team activity<br />
and is easily adapted for all ability levels. This is<br />
a typical Zephyr Press lab activity encouraging<br />
students to approach problems from many<br />
angles. It is creative and lists 30 items to collect<br />
and/or create to learn about the sources <strong>of</strong> air<br />
pollution in our environment. There is also an<br />
easy-to-follow evaluation sheet.<br />
Our Troubled Skies , Zephyr Press, Tucson,<br />
Arizona.<br />
Chapter 2 What Is the<br />
Controversy About?<br />
In the fun activity “Worldwide Effects <strong>of</strong> <strong>Climate</strong><br />
<strong>Change</strong>” students construct an “effects wheel”<br />
to help them consider a wide range <strong>of</strong> impacts<br />
that might result from global warming. By filling<br />
out their wheel, students begin to see the “chain<br />
reaction” that result as one environmental<br />
change begins to affect many others. Global<br />
Warming, and the Greenhouse Effect, 1990, a<br />
GEMS guide from the <strong>Lawrence</strong> <strong>Hall</strong> <strong>of</strong> <strong>Science</strong>,<br />
U.C. Berkeley, CA 94720-5200.<br />
Chapter 3 What’s So<br />
Special About CO 2 ?<br />
In the activity “Modeling the Greenhouse Effect”<br />
students perform an experiment to learn<br />
about the greenhouse effect. By constructing a<br />
physical model <strong>of</strong> the atmosphere using familiar<br />
materials, students learn that air trapped in a<br />
container will heat up more than air in a open<br />
container, when both are exposed to the same<br />
amount <strong>of</strong> energy from a light bulb. In addition<br />
to building and testing their own model, students<br />
practice collecting and recording data, graphing<br />
Global Systems <strong>Science</strong> <strong>Climate</strong> <strong>Change</strong> Teacher’s <strong>Guide</strong> 13
and interpreting results. In the subsequent activity, “The Global Warming<br />
Game,” students find out how the greenhouse effect works at a molecular<br />
level.<br />
Global Warming, and the Greenhouse Effect, 1990, a GEMS guide from the<br />
<strong>Lawrence</strong> <strong>Hall</strong> <strong>of</strong> <strong>Science</strong>, U.C. Berkeley, CA 94720-5200.<br />
Chapter 5 Is the Atmosphere Really<br />
Changing?<br />
“Using Statistics to Analyze <strong>Climate</strong> Data,” is an activity described in the<br />
Environmental Research Laboratories/Forecast Systems Laboratory<br />
Publication, NOAA. The students plot temperature data from Denver,<br />
Colorado that were collected during the months <strong>of</strong> July, 1991 and January,<br />
1992, the warmest and coldest months <strong>of</strong> the year. They use the data to<br />
answer a series <strong>of</strong> questions that help them understand the relationship<br />
between weather and climate. The activity can be made much more<br />
relevant and exciting for your students if you can obtain weather data for<br />
your locale from the local weather bureau, or set up a weather station<br />
at your own school.<br />
Environmental Research Laboratories/Forecast Systems Laboratory<br />
Publication, Office <strong>of</strong> Global Programs, National Oceanic and Atmospheric<br />
Administration, 1100 Wayne Ave., Suite 1225, Silver Spring, MD 20910.<br />
Activities for the Changing Earth System (ACES) provides a variety <strong>of</strong> excellent<br />
activities for teaching about global environmental change. In one set <strong>of</strong><br />
activities, students plot the average temperature <strong>of</strong> certain regions <strong>of</strong><br />
the United States over the last few decades, drawing data from Trends<br />
‘90, a compendium <strong>of</strong> data on global climate<br />
change available free from government sources<br />
and on the World Wide Web. The compare their<br />
findings with the predictions <strong>of</strong> the theory <strong>of</strong><br />
global warming and the greenhouse effect.<br />
They go on to graph the concentration <strong>of</strong> carbon<br />
dioxide in the atmosphere from ice cores and<br />
other sources <strong>of</strong> data, and compare their plots<br />
with climate change data.<br />
Activities for the Changing Earth System, 1993, by<br />
Rosanne W. Fortner and Victor J. Mayer, Project<br />
Directors, Earth Systems Education Program,<br />
Ohio State University, 59 West Woodruff Ave.,<br />
Columbus, OH 43210.<br />
Trends ‘90 and Trends ‘93, A Compendium <strong>of</strong> Data<br />
on Global <strong>Change</strong>, available from the Carbon<br />
Dioxide Information Analysis Center (CDIAC),<br />
Oak Ridge National Laboratory, Oak Ridge,<br />
Tennessee 37831.<br />
Chapter 8 What Is the<br />
U.S. Government Doing?<br />
“Environmental Heroes and Heroines: An<br />
Instructional Unit in Earth Values and Ethics,” by<br />
Clifford E. Knapp is a three-lesson unit designed to<br />
encourage teachers to involve their students in the<br />
study <strong>of</strong> the values and actions <strong>of</strong> environmental<br />
heroes and heroines in order to help them develop<br />
their own Earth ethic. It was selected for inclusion<br />
in the section entitled “Decision-Making Under<br />
Scientific Uncertainty,” in the Global <strong>Change</strong><br />
Education Resource <strong>Guide</strong>.<br />
Global <strong>Change</strong> Education Resource <strong>Guide</strong><br />
by Lynn L. Martensen, Office <strong>of</strong> Global Programs,<br />
NOAA, 1100 Wayne Ave. Suite 1225, Silver Spring,<br />
MD 20910.<br />
“Additional Resources for teaching <strong>Climate</strong> <strong>Change</strong>” are listed<br />
at the end <strong>of</strong> this resource guide, followed by a complete listing<br />
<strong>of</strong> all <strong>of</strong> the books, articles, and other resources used to create<br />
the text, graphics, and activities in <strong>Climate</strong> <strong>Change</strong>.<br />
14 Global Systems <strong>Science</strong> <strong>Climate</strong> <strong>Change</strong> Teacher’s <strong>Guide</strong>
Page by Page Suggestions<br />
Chapter 1. What is the<br />
Greenhouse Effect?<br />
Pages 2–5<br />
This chapter directly addresses several common misconceptions about global<br />
warming: 1) The “hole” in the ozone layer is not the suspected cause <strong>of</strong> global warming;<br />
2) Soot from industry will not warm the Earth. In fact, the particles released by burning<br />
are expected to reflect light back into space, and will therefore have a cooling effect.<br />
3) The predicted changes in climate are not expected to cause major problems in the<br />
near future. Large changes in climate—if they in fact occur—will affect our children and<br />
grandchildren more than they will affect us.<br />
There is an interesting website that addresses a number <strong>of</strong> misconceptions about<br />
greenhouse effect at<br />
http://www.ems.psu.edu/~fraser/Bad/BadGreenhouse.html<br />
Chapter 2. What Is Global<br />
Warming?<br />
Pages 6–7<br />
These pages provide a very brief history <strong>of</strong> the<br />
idea <strong>of</strong> global warming, and responds to a question<br />
that intelligent students are likely to raise: Who<br />
cares about one or two degrees? This is a good<br />
question for class discussion, as it is likely to draw<br />
out both information that they have read in the<br />
chapter, and their personal opinions and values. A<br />
good sequence <strong>of</strong> questions for ending the chapter<br />
might be:<br />
• What is global warming?<br />
• Why is it controversial?<br />
• How much is the Earth’s temperature likely to<br />
change, and when?<br />
• A change <strong>of</strong> 1° to 3.5° seems like very little.<br />
What’s the fuss all about?<br />
You may want to conclude the discussion<br />
by emphasizing that in this course students are<br />
expected to form their own judgments and opinions:<br />
“In the end you will be the judge <strong>of</strong> what it all<br />
means, and what, if anything, we should do.”<br />
Ask for someone to explain the graph on page<br />
7. Hansen showed this graph to Congress and it was<br />
later published in papers across the country. What<br />
does it show? How much did the global average<br />
temperature change from 1866 to 1988? (A gradual<br />
increase <strong>of</strong> less than one degree Celsius.) Is it<br />
convincing?<br />
Note: A graph showing this data appeared in<br />
the newspapers as part <strong>of</strong> the article about Hansen’s<br />
Global Systems <strong>Science</strong> <strong>Climate</strong> <strong>Change</strong> Teacher’s <strong>Guide</strong> 15
testimony in 1988. Data collected since 1988 are reported on subsequent pages<br />
and in Chapter 3. A complete graph updated to 1999 is shown on page 15.<br />
Some people have pointed out that the graph on page 7 does not begin at<br />
zero, and so exaggerates the increase in temperature. While this is true, it is not<br />
essential that all graphs begin at zero, as long as they are appropriately labeled.<br />
Appropriate horizontal and vertical scales are generally chosen to encompass all<br />
<strong>of</strong> the data, and to reveal details and trends.<br />
Pages 8–10<br />
These pages provide a number <strong>of</strong> good projects for homework and small<br />
group work. Following are some questions that you might want to pose to<br />
individuals and/or teams <strong>of</strong> students:<br />
• Read the article on page 9. In your own words, describe what Hansen said,<br />
and each <strong>of</strong> the objections made by other scientists.<br />
• Read the article on page 10. What new information is provided? What does<br />
the new data have to say about the controversy reported on page 7? Overall,<br />
how has the opinion <strong>of</strong> the scientific community changed between 1988 and<br />
1999?<br />
• Do the opinions <strong>of</strong> the two reporters, Petit and Monatersky, come out in the<br />
articles? If so, what are their opinions and passages in the articles reveal<br />
their points <strong>of</strong> view?<br />
• What is your opinion <strong>of</strong> the two articles? What do you think about the prediction<br />
<strong>of</strong> global warming at this point?<br />
Page 11<br />
The Investigation on page 11 can be small group work and/or homework.<br />
The photos depict:<br />
A. storms which may become more frequent and more intense,<br />
B. a city that might be inundated by rising sea levels and storm surge,<br />
C. a city with encroaching sand dunes, and<br />
D. wildlife endangered by flooding.<br />
Chapter 3. What Is the<br />
Controversy About?<br />
Pages 12–13<br />
The cartoon is a good place to begin discussion.<br />
Who is the patient? What does the chart at the<br />
end <strong>of</strong> the bed show? What is the patient’s diet?<br />
How is it related to the issues discussed in Chapter<br />
1? What perspectives on global warming and the<br />
greenhouse effect are expressed in the opinions <strong>of</strong><br />
the two doctors?<br />
The discussion on these two pages is aimed at<br />
showing why the controversy is important. You might<br />
ask the students if they know anyone whose job<br />
might be affected if the U.S. Government decides to<br />
significantly reduce the amount <strong>of</strong> fossil fuels used<br />
in this country. (Just about all jobs will be affected<br />
if the cost <strong>of</strong> energy goes up.)<br />
The discussion on page 13 introduces an<br />
important set <strong>of</strong> ideas. Scientists advance by<br />
skeptical inquiry. They are always testing the<br />
prevailing theories. It is common for people who<br />
misunderstand this process and dismiss theories or<br />
experimental results if other scientists challenge<br />
them. The misunderstanding is that the process<br />
does not end with controversy. Equally important<br />
16 Global Systems <strong>Science</strong> <strong>Climate</strong> <strong>Change</strong> Teacher’s <strong>Guide</strong>
for the advancement <strong>of</strong> knowledge is consensus—the gradual agreement by<br />
the scientific community that a particular theory or line <strong>of</strong> investigation has<br />
something to say about the real world.<br />
The great value <strong>of</strong> studying the topic <strong>of</strong> global warming, in contrast to<br />
well-established theories such as Newton’s Laws, is that students can see<br />
the interplay <strong>of</strong> controversy and emerging consensus. Allow some time for<br />
the students to talk about what the agreement <strong>of</strong> the IPCC panel means, as<br />
contrasted with the disagreement <strong>of</strong> individual scientists reported in the articles<br />
on pages 9 and 10.<br />
On pages 13 is an overview <strong>of</strong> what is known and issues still to be resolved<br />
concerning global warming. It is a road map for the rest <strong>of</strong> the chapter. Invite<br />
students to ask questions about what is known. They may be surprised that<br />
there is virtually complete agreement on these important issues. You might<br />
remind them <strong>of</strong> the concluding statement on page 9, when the controversy<br />
about global warming was much hotter than it is today, “We may not agree that<br />
we can already see the warming, but most <strong>of</strong> us believe in the general idea <strong>of</strong><br />
the greenhouse effect.”<br />
In order to encourage the students to think about the issues before reading<br />
the rest <strong>of</strong> the chapter you can ask them for their opinions about each <strong>of</strong> the<br />
questions at the bottom <strong>of</strong> page 13 before reading more.<br />
Page 14–15<br />
The discussion on page 14 is meant to convey the immense amount <strong>of</strong><br />
careful work involved in generating each data point in the graphs <strong>of</strong> average<br />
global temperature that were shown on pages 7 and 15. The American and British<br />
teams who have compiled the data continue to refine<br />
each data point so the results are as accurate as<br />
humanly possible.<br />
The graph on the top <strong>of</strong> page 15 shows the<br />
same difference in average global temperature as<br />
shown in the graph on page 7. We continued to use<br />
the same 30-year average baseline so that all <strong>of</strong><br />
the graphs will be consistent. Remember, however,<br />
that the important differences are the year-to-year<br />
changes in temperature, and the overall change in<br />
temperature from the beginning <strong>of</strong> the record to<br />
the end <strong>of</strong> the record.<br />
We obtained the data from two groups from<br />
their World Wide Web addresses, and created<br />
the graphs shown on page 15. Following strong<br />
recommendations from high school science teachers,<br />
we have tried to be consistent in using the Celsius<br />
scale. But articles in newspapers <strong>of</strong>ten use<br />
Fahrenheit. You might want to ask your students to<br />
check the graphs to see if they agree with the data<br />
in the article. The data for 1995 can be read from<br />
the graphs and converted to Fahrenheit using the<br />
conversion equation in the Student Book page 81.<br />
°F = ((9/5) x °C) + 32° or °C = (5/9)(°F - 32°)<br />
In responding to the questions on page 15, your<br />
students will probably observe that the average global<br />
temperature has climbed by more than the .3 to .6°C<br />
noted by the IPCC. This illustrates another aspect<br />
<strong>of</strong> science: It is generally better to be conservative<br />
when drawing conclusions. After all, there is a lot <strong>of</strong><br />
variation from year to year and it is difficult to see<br />
how much the long term average has changed. So,<br />
it’s better to estimate a low value for the amount <strong>of</strong><br />
change and increase the estimate if that is supported<br />
in later years.<br />
Page 15–18<br />
“Evidence” <strong>of</strong> effects from global warming<br />
is <strong>of</strong>ten described in unscientific ways. Encourage<br />
students to think critically about statements that<br />
such-and-such is evidence <strong>of</strong> global warming. There<br />
is also a distinction between saying that some<br />
phenomenon is evidence and saying that it is caused<br />
by global warming. Causation is a much stronger<br />
statement and harder to prove.<br />
Global Systems <strong>Science</strong> <strong>Climate</strong> <strong>Change</strong> Teacher’s <strong>Guide</strong> 17
The graph on page 18 surprises many people. It illustrates that the “ice age”<br />
was not a brief period in prehistory, but was actually the usual climate during<br />
the past 160,000 years. Today we live in a relatively “short” interglacial period.<br />
Ask the students to describe how our lives might be different today if we happen<br />
to have been born 30,000 or 40,000 years ago, when Stone Age hunters painted<br />
pictures <strong>of</strong> mammoths and bison on the walls <strong>of</strong> caves.<br />
It is also a good idea for the students to look back at the graph on page 18 to<br />
see what the climate was like when agriculture was invented, and the first large<br />
civilizations began in Northern Africa and Mesopotamia. Ask the students if they<br />
think there might be a connection between the warming climate and the invention<br />
<strong>of</strong> agriculture. (Yes, crops cannot grow in the snow! Generally warmer climates<br />
increase the regions <strong>of</strong> fertile soil and more carbon dioxide in the atmosphere at<br />
that time also increased plant growth.)<br />
Pages 20–22<br />
Question 3.2 on page 20 refers to the doubling <strong>of</strong> the concentration <strong>of</strong><br />
carbon dioxide over pre-industrial levels. Before the industrial revolution the<br />
concentration was about 280 ppm. Today it’s about 360 ppm. The IPCC report<br />
predicts that it will reach about 560 ppm by the end <strong>of</strong> the next century.<br />
The doubling time is arbitrarily selected as a reference point. Observable<br />
changes in the climate are likely to occur well before the doubling time is<br />
reached. Nonetheless, the biggest changes are not expected to occur for a very<br />
long time. Some students may take the point <strong>of</strong> view that “Why should I care?<br />
I’ll be dead then! Others may be more concerned for the future <strong>of</strong> the children<br />
and grandchildren that they expect to have some day. Ask the students to share<br />
their ideas about this. One technique is to put both viewpoints on the board and<br />
ask the students where their own opinions fall between these two extremes.<br />
“Why should I care?”...........“I care about the future!”<br />
1 2 3 4 5<br />
Pages 20–22 concern predictions <strong>of</strong> how much<br />
the Earth’s global climate will warm when the<br />
concentration <strong>of</strong> greenhouse gases double. What<br />
is more important than the answer, however, are<br />
the factors thought to influence climate—particles<br />
in the air, clouds, and the oceans.<br />
The space given to the interview with Dr.<br />
Lynn Talley provides an opportunity for students<br />
to glimpse behind the scenes, and see the deeper<br />
reasoning behind the predictions <strong>of</strong> greenhouse<br />
warming. In Dr. Tally’s vision <strong>of</strong> the link between the<br />
oceans and atmosphere spans vastly different time<br />
scales, from hours to centuries. The interview and<br />
photograph also introduce students to a scientist.<br />
You may want to ask the students what they think <strong>of</strong><br />
the interview. What did Dr. Talley say about the role<br />
<strong>of</strong> the ocean in climate change? What is she doing<br />
to find answers to questions about climate change?<br />
Could you imagine being in her shoes?<br />
Since the oceans are separately named,<br />
your students may not be aware that they are<br />
interconnected. In essence, the world has one vast<br />
ocean, with currents that run from one to the other.<br />
The distances traveled by the water are so long that<br />
a complete circuit for a drop <strong>of</strong> water takes 500 to<br />
1,000 years. A way to help the students visualize<br />
this is to ask them to make up a short story telling<br />
<strong>of</strong> the journey <strong>of</strong> one drop <strong>of</strong> water as it travels<br />
through the entire “World Ocean.”<br />
Pages 24–27<br />
These pages describe the predictions <strong>of</strong> the<br />
IPCC regarding changes that are likely to occur when<br />
the carbon dioxide concentration doubles. These<br />
predictions answer the question, “What’s the fuss<br />
all about?”<br />
We urge you to emphasize to your students that<br />
1) These predictions are not absolutely certain to<br />
occur; but are the best guess <strong>of</strong> a large number <strong>of</strong><br />
scientists working together; and 2) If the predictions<br />
18 Global Systems <strong>Science</strong> <strong>Climate</strong> <strong>Change</strong> Teacher’s <strong>Guide</strong>
come true, these changes will not occur this week, or this year—but by the end<br />
<strong>of</strong> the next century. By the time these problems become serious your students<br />
will be very old or no longer alive; but their children and grandchildren will<br />
live through this period.<br />
You may want to have individuals or small groups create stories about “A<br />
day in the life <strong>of</strong>....” in which the subject <strong>of</strong> the story is a person who will live<br />
near the end <strong>of</strong> the next century. The stories could illustrate two alternative<br />
futures: one in which fossil fuel use continues and these predictions come<br />
true; the other showing how the world might be different if conservation and<br />
alternate sources <strong>of</strong> energy are developed which will reduce the buildup <strong>of</strong><br />
greenhouse gases in the atmosphere.<br />
The idea that global warming will not directly cause the changes listed on<br />
pages 25–26, but will make them more likely to occur is a subtle point. Stephen<br />
Schneider’s analogy <strong>of</strong> traffic jams (on p. 16) is intended to communicate this<br />
idea. In his analogy, more cars on the road do not directly cause accidents,<br />
but they make accidents more likely.<br />
You might want to spark some lively discussion that turns on this issue<br />
<strong>of</strong> indirect causation. Either as a small group task, or in a large group, ask<br />
your students to imagine that someone lost a loved one—a child, spouse, or<br />
parent—due to an auto accident that occurred during rush hour. The drivers<br />
<strong>of</strong> both cars were killed. In her anguish, she decided to sue the Department<br />
<strong>of</strong> Motor Vehicles. At the trial, her lawyer argued that if the Department <strong>of</strong><br />
Motor Vehicles had not allowed so many cars to travel on the road, the accident<br />
would never have occurred.<br />
After the students’ discussion, ask them to<br />
apply their insights to the issue <strong>of</strong> global warming.<br />
Suppose the Earth warms up by 3°C, and an entire<br />
island is inundated by storm surge. From the<br />
viewpoint <strong>of</strong> the survivors, what caused the loss?<br />
Was it the storm? Global warming? The actions <strong>of</strong><br />
people from the previous century who contributed<br />
carbon dioxide to the atmosphere?<br />
On page 27 is the question “What would you<br />
do?” Emphasize that knowledge about indirect<br />
causation can help to prevent problems before<br />
they occur. For example, many large cities have<br />
constructed subways and trains so commuters can<br />
park their cars outside <strong>of</strong> the city and still make it<br />
to the <strong>of</strong>fice on time. That reduces the chances <strong>of</strong><br />
auto accidents and reduces air pollution. However,<br />
such systems are very expensive to build, and require<br />
buildings to be torn down to make way for the rails.<br />
Cities have agonized for years before deciding to<br />
build such systems.<br />
In a similar way, world leaders are currently<br />
deciding what actions to take to slow the buildup<br />
<strong>of</strong> greenhouse gases in the atmosphere. Because<br />
many questions about global warming are still<br />
unanswered, they do not know whether to take<br />
strong actions, moderate actions, or no actions at<br />
all. Tell the students that you will return to these<br />
questions later on, after exploring the science<br />
behind the theory <strong>of</strong> global warming.<br />
Good questions for review <strong>of</strong> Chapter 3 are:<br />
• What do we know about global warming?<br />
• What questions require further research?<br />
• Why is it important to answer these<br />
questions?<br />
On the following pages are two activities which<br />
relate to the ideas in this chapter: “What Drives<br />
the Global Conveyor Belt,” and “The Next Great<br />
Superhero.”<br />
Global Systems <strong>Science</strong> <strong>Climate</strong> <strong>Change</strong> Teacher’s <strong>Guide</strong> 19
Investigation<br />
What Drives the Global Conveyor Belt?<br />
by Carl Katsu, Fairfield Area School, Fairfield, PA and Arnold Beckerman, Jamaica High School, Jamaica<br />
NY<br />
This activity was inspired by a related activity developed by the<br />
authors at Project ESTEEM (Earth <strong>Science</strong> Teachers Examining Exemplary<br />
Material) at the Harvard Center for Astrophysics, during the summer <strong>of</strong><br />
1990.<br />
Overview<br />
The diagram <strong>of</strong> the Global Conveyor Belt, on page 24, shows worldwide<br />
ocean currents. The text says that “ salty water (which is already more<br />
dense than fresh water) cools and becomes even denser.” These ideas<br />
become much more meaningful to students if they have an opportunity<br />
to explore how the properties <strong>of</strong> saltiness and temperature each affect<br />
the way water flows.<br />
In this laboratory activity the students observe what happens when a<br />
fluid <strong>of</strong> one density is placed in a fluid <strong>of</strong> a different density. The fluids are<br />
salt water and fresh water, cold water and warm water. They generalize<br />
their results to describe what occurs in the world’s oceans to drive the<br />
global conveyor belt pattern <strong>of</strong> ocean currents.<br />
With some groups <strong>of</strong> students you may wish to make this into a<br />
quantitative laboratory activity in which they create their own salt solutions<br />
and heat water samples to different temperatures, and use a stop watch<br />
to measure differential rates <strong>of</strong> flow.<br />
Background<br />
The global “conveyor belt” shown on page 24<br />
plays a very important role in maintaining regional<br />
climates around the world. Like all convection<br />
currents, global ocean currents are driven by<br />
differences in density. Colder water is denser than<br />
warmer water and saltier water is denser than water<br />
that has less salt in it.<br />
Aided by prevailing winds, warm waters from<br />
the Caribbean flow northwards towards the North<br />
Atlantic. Air blowing over the warm waters carries<br />
a moderate climate to Northwestern Europe, which<br />
would otherwise be much colder. Arriving in the<br />
vicinity <strong>of</strong> Greenland and Iceland, the relatively<br />
warm waters evaporate, so the water becomes<br />
saltier and denser, and begins to sink. As these<br />
waters sink, they bring some heat with them, cooling<br />
the Earth. Additional cooling is due the removal<br />
<strong>of</strong> to carbon dioxide which is dissolved in surface<br />
waters, and then sinks when the water becomes<br />
saltier and denser.<br />
The cold waters from the North Atlantic<br />
continue flowing southward along the entire floor <strong>of</strong><br />
the Atlantic Ocean until they reach the waters <strong>of</strong>f<br />
Antarctica which are even colder and denser. The<br />
water wells upward, is cooled to the freezing point,<br />
and sinks again. The extremely cold and dense<br />
bottom waters flow from the Antarctic around the<br />
tip <strong>of</strong> Africa into the Indian, Atlantic, and Pacific<br />
Oceans where they eventually well upwards to<br />
repeat the cycle.<br />
20 Global Systems <strong>Science</strong> <strong>Climate</strong> <strong>Change</strong> Teacher’s <strong>Guide</strong>
At present the global conveyor belt pattern <strong>of</strong> ocean currents is a negative<br />
feedback process. It resists climate change by redistributing heat and removing<br />
carbon dioxide from the atmosphere. But if global warming increases substantially,<br />
this process may stop functioning. Melt from mountain glaciers and the North Polar<br />
Ice will dilute the salt concentration <strong>of</strong> the North Atlantic, and reduce the driving<br />
force <strong>of</strong> the entire ocean circulation system. Average temperatures in Europe could<br />
drop by as much as 5°C in as little as a decade, and it may take hundreds or thousands<br />
<strong>of</strong> years before the global conveyor belt system could be reestablished.<br />
Hot Tip!<br />
It’s best to present this activity just before the students read about the Global<br />
Conveyor Belt theory. After doing the activity, focus discussion on the results that the<br />
students found, and changes in density that occur with changes in water temperature<br />
and salinity. Then, when the students have read about the Global Conveyor Belt, have<br />
them discuss how what they learned from the activity helps them explain what makes<br />
the ocean currents dive to the bottom in some areas and upwell in other areas.<br />
Materials<br />
For each lab group:<br />
1 large open-mouth clear container (e.g. a 1000 ml<br />
beaker)<br />
1 small narrow-neck bottle (such as a Barnes<br />
bottle)<br />
1 container <strong>of</strong> tap water (approximately 500 mL)<br />
1 container <strong>of</strong> saturated salt water solution (approx.<br />
500 mL)<br />
1 container <strong>of</strong> warm water (approximately 500 mL)<br />
1 container <strong>of</strong> ice water (approximately 500 mL)<br />
1 small container <strong>of</strong> food coloring<br />
1 set <strong>of</strong> safety goggles and lab apron (optional)<br />
Optional (for quantitative measurements)<br />
1 stop watch<br />
1 immersible thermometer<br />
1 graduated cylinder<br />
1 medicine dropper<br />
1 glass stirring rod<br />
5 ice cubes<br />
1 cup <strong>of</strong> salt<br />
1 pan balance, triple-beam balance, or digital<br />
balance 5<br />
1 ring stand with ring and wire screen<br />
1 heat source, e.g. Bunsen burner, hot plate, alcohol<br />
lamp<br />
1 igniter for Bunsen burner or matches for alcohol<br />
lamp<br />
Salt solutions. A saturated salt water solution can<br />
be prepared for the whole class by dissolving<br />
as much salt as possible in tap water at room<br />
temperature. Alternatively students can prepare<br />
their own salt solutions and compare the rate <strong>of</strong><br />
flow <strong>of</strong> different concentrations <strong>of</strong> salt.<br />
Cold water. Ice water can be prepared in a large<br />
bucket , with ladles or cups for the students to<br />
help themselves.<br />
Warm water. The warm water should be cool enough<br />
so that students can comfortably put their hands<br />
into it. However, keep in mind that the greater<br />
the temperature difference between the ice<br />
water and the warm water, the more dramatic<br />
the convection effects. Warm tap water should<br />
be fine for this experiment. Insulated cups should<br />
be available for teams to keep the water warm<br />
during the activity.<br />
On the following page is a sheet to hand out<br />
to the students describing the activity. The next<br />
page gives suggestions for leading discussions and<br />
extending the activity so it is quantitative.<br />
Global Systems <strong>Science</strong> <strong>Climate</strong> <strong>Change</strong> Teacher’s <strong>Guide</strong> 21
What Drives the Global Conveyor Belt?<br />
In this experiment you will observe what happens when two masses <strong>of</strong><br />
water meet—with different temperatures and different salt concentrations.<br />
The results <strong>of</strong> your experiment will reveal the causes <strong>of</strong> ocean currents.<br />
Part 1. Experimenting with warm and<br />
cold water<br />
1. Predict: What will happen when warm water is released at the bottom <strong>of</strong> a<br />
container <strong>of</strong> cold water? What will happen when cold water is released at<br />
the bottom <strong>of</strong> a container <strong>of</strong> warm water?<br />
2. Fill the large jar or beaker with cold water.<br />
3. Put a drop <strong>of</strong> food coloring into the narrow-neck bottle, then fill the bottle<br />
with warm water.<br />
4. Holding your finger over the end <strong>of</strong> the bottle, carefully lower the bottle<br />
into the jar or beaker <strong>of</strong> water, not letting any <strong>of</strong> the colored water escape.<br />
Position the bottle on its side with its mouth facing the center <strong>of</strong> the beaker.<br />
Remove your hand slowly, being careful not to disturb the water.<br />
5. Observe from the side, and draw what happens.<br />
6. Empty the containers and fill the large container with warm water and the<br />
small container with colored ice water.<br />
7. Release the cold water at the bottom <strong>of</strong> the container <strong>of</strong> warm water and<br />
draw what happens.<br />
8. Draw conclusions. What happens when masses <strong>of</strong> water <strong>of</strong> two different<br />
temperatures meet? Why does that occur? How can the results <strong>of</strong> your<br />
experiment explain what causes ocean currents?<br />
Part 2. Experimenting with salty and<br />
fresh water<br />
1. Predict: What will happen when salty water is released at the bottom <strong>of</strong> a<br />
container <strong>of</strong> fresh water? What will happen when fresh water is released<br />
at the bottom <strong>of</strong> a container <strong>of</strong> salty water?<br />
2. Follow steps 2-8 in Part 1, but using salty and fresh water rather than warm<br />
and cold water.<br />
3. As before, see if you can explain why masses <strong>of</strong> salty and fresh water behave<br />
as they do, then use the results <strong>of</strong> your experiment to further explain the<br />
causes <strong>of</strong> ocean currents.<br />
22 Global Systems <strong>Science</strong> <strong>Climate</strong> <strong>Change</strong> Teacher’s <strong>Guide</strong>
Suggestions for conducting the activity<br />
• It’s best to demonstrate how to properly place the bottle in the bottom<br />
<strong>of</strong> the large jar or beaker, and how to remove your hand with minimal<br />
disturbance to the water. Use water <strong>of</strong> the same temperature or salinity<br />
so you don’t give away the final result.<br />
• To increase interest and motivation, ask the students to share their<br />
predictions before handing out the equipment.<br />
• Be sure the students rinse the bottles and beakers between experiments.<br />
• Avoid getting ice in the bottles and beakers.<br />
• When observing the hot water convection in cold water, students may need<br />
to wipe condensation <strong>of</strong>f <strong>of</strong> the large beaker.<br />
• The darker food colorings need fewer drops than the lighter ones.<br />
Suggestions for discussing results<br />
• It’s very important to allow time for discussion <strong>of</strong> results after each portion<br />
<strong>of</strong> the lab activity. If there is not time to discuss it that day, allow time<br />
the next day. Discussion should follow these steps:<br />
a. Have each team discuss what they did and what they observed.<br />
Compare with other teams to see if they agree or disagree.<br />
b. Invite students to explain their discoveries in terms <strong>of</strong> differences in<br />
density <strong>of</strong> salt vs. clear water, or warm vs. cold water.<br />
c. Ask students to relate their findings to the causes <strong>of</strong> ocean currents.<br />
Help them recognize that ocean currents are convection currents<br />
driven by differences in density.<br />
d. Use hints and questions to help them figure<br />
out what drives the Global Conveyor Belt as<br />
described in the “Background” section at the<br />
beginning <strong>of</strong> this activity.<br />
• Discuss the importance <strong>of</strong> the global conveyor<br />
belt ocean current, how it may be changed if the<br />
Earth’s climate changes, and how changes in ocean<br />
currents may, in turn, further affect the Earth’s<br />
climate.<br />
Suggestions for a<br />
quantitative activity<br />
• Have the students create solutions with different<br />
concentrations <strong>of</strong> salt and different temperatures,<br />
and to compare flow rates.<br />
• Flow rate can be measured by using a stop watch<br />
to measure how long it takes the plume <strong>of</strong> colored<br />
water to leave the bottle and reach a certain<br />
point in the large jar. Measure this distance<br />
in centimeters and calculate the flow rate in<br />
centimeters per second.<br />
Further extensions<br />
• Have students conduct library research<br />
and prepare a report, comparing the<br />
temperatures <strong>of</strong> different locations in the<br />
world oceans and possible reasons for the<br />
differences.<br />
• Have students measure the temperature in<br />
a swimming pool at 30-cm depth intervals,<br />
and graph the data. How do the results<br />
compare with ocean temperatures at<br />
increasing depths?<br />
• Set up a large aquarium and place a<br />
heating lamp over the tank. Measure the<br />
temperature at 10-cm depth intervals. How<br />
do the results <strong>of</strong> compare with students’<br />
predictions?<br />
Global Systems <strong>Science</strong> <strong>Climate</strong> <strong>Change</strong> Teacher’s <strong>Guide</strong> 23
Assessment ideas<br />
• Have students map concepts involved in this<br />
activity<br />
• Ask the students to invent a story about what<br />
occurs to a drop <strong>of</strong> water as it flows through the<br />
world’s oceans.<br />
• Have students write about effects that humans<br />
might have on ocean currents, what that might<br />
mean for future generations, and how those<br />
effects might be avoided by what we do today.<br />
Extra challenges<br />
Have students research these questions....<br />
• What causes changes in salinity <strong>of</strong> the ocean?<br />
The rate <strong>of</strong> evaporation (affected by air<br />
temperature, humidity, and wind)?<br />
The amount <strong>of</strong> rain falling on the ocean?<br />
The amount <strong>of</strong> freshwater added by streams<br />
and rivers?<br />
The amount <strong>of</strong> salt in solution in rivers and<br />
streams emptying into the ocean?<br />
The amount <strong>of</strong> salt added by underwater<br />
volcanoes and vents?<br />
The temperature <strong>of</strong> the ocean water?<br />
• What happens when a large river flows into the<br />
ocean, or when it rains?<br />
Fresh water will “float” on the denser salt water,<br />
forming a layer <strong>of</strong> fresh water on top <strong>of</strong> the ocean<br />
water. Eventually turbulence will mix the water,<br />
so the ocean becomes less salty.<br />
• Use data from your quantitative experiments to<br />
calculate how long it will take cold dense water<br />
to flow from Iceland to the equator.<br />
From classroom experiments, the flow rate <strong>of</strong> cold<br />
water at 4°C in warm water 20°C is about 0.1<br />
cm/s. This converts to about 1 km/11.57 days.<br />
To go 5000 km (the distance from Iceland to<br />
the equator) would take 11,570 days or 315<br />
years. This is the right order <strong>of</strong> magnitude since<br />
deep water takes approximately 1000 years to<br />
circulate once around the globe.<br />
References<br />
Broecker, Wallace S., “Chaotic <strong>Climate</strong>,” Scientific<br />
American, pages 62-68, November, 1995.<br />
Bernstein, Leonard, et. al., Environmental <strong>Science</strong>,<br />
New York: Addison Wesley, 1995.<br />
24 Global Systems <strong>Science</strong> <strong>Climate</strong> <strong>Change</strong> Teacher’s <strong>Guide</strong>
Investigation<br />
How Does Ocean Temperature Affect<br />
Absorption <strong>of</strong> CO 2 ?<br />
by Donna Morey, Fair High School, Little Rock, AK<br />
Glenda Pepin, Dorsey High School, Los Angeles, CA<br />
and Eloise Farmer, Torrington High School, Torrington, CT<br />
Absorption in plants is one way that carbon<br />
dioxide is removed from the atmosphere. Another<br />
is the ocean. Like a bottle <strong>of</strong> sparkling soda pop,<br />
the ocean contains dissolved carbon dioxide. If it<br />
were not for the ocean, the Earth would be a much<br />
warmer place! However, as your students will<br />
discover in this activity, the ocean’s capacity to<br />
dissolve carbon dioxide depends on its temperature.<br />
This has important implications for the future <strong>of</strong><br />
our planet.<br />
Materials for each team<br />
2 Alka Seltzer tablets<br />
3 containers (250 ml beakers)<br />
1 dropper bottle <strong>of</strong> dilute (1:25) household ammonia<br />
3 large test tubes (25 mm x 100 mm)<br />
Procedure<br />
Demonstrate the following steps:<br />
1. Label the three 250 ml beakers: A, B, C. Mark<br />
the three test tubes in the same way.<br />
2. Demonstrate how to pour 200 ml BTB solution<br />
into each beaker. The hot BTB goes in beaker<br />
A, the cold BTB goes in beaker B, and the room<br />
temperature BTB goes into beaker C.<br />
3. Ask the students to predict what will occur if<br />
you drop an Alka Seltzer tablet into beakers<br />
A and B.<br />
4. Have the students set up their beakers, and<br />
go ahead and drop the tablets into the two<br />
beakers, observe what happens, and record their<br />
observations.<br />
5. Now ask the students if they think there will be<br />
a difference in acidity between containers A<br />
and B? If so, which will be more acidic? Which<br />
more basic ?<br />
6. Have the students test their predictions by<br />
pouring 10 ml solution from each <strong>of</strong> the beakers<br />
into the test tubes with the same letters. They<br />
should add household ammonia, drop by drop, to<br />
Before class, prepare a gallon <strong>of</strong> BTB solution<br />
by adding concentrated BTB to a gallon <strong>of</strong> water until<br />
it is a rich but transparent blue. Put about a third<br />
<strong>of</strong> it into a refrigerator overnight so it cools, and put<br />
about a third <strong>of</strong> it into a microwave oven, or on a<br />
hot plate just before class so it is at the temperature<br />
<strong>of</strong> hot tap water. Keep about a third at room<br />
temperature. Have these available with pitchers<br />
or labels so students can fill their beakers.<br />
1 ice cube<br />
1 hot plate<br />
test-tubes A and B only, and to keep a record <strong>of</strong><br />
the number <strong>of</strong> drops needed to change the liquids<br />
to the same color as that in the control tube<br />
C. Tell them to swirl the tubes gently between<br />
drops to mix the ammonia into solution, and to<br />
record your observations <strong>of</strong> the number <strong>of</strong> drops<br />
ammonia added to each tube.<br />
Discussion questions<br />
• Why was it necessary to use the same amount <strong>of</strong><br />
Alka Seltzer for each test beaker ?<br />
• What can you conclude about the relationship<br />
between the water temperature difference and<br />
the solubility <strong>of</strong> carbon dioxide in water?<br />
• On the basis <strong>of</strong> what you have observed during<br />
this experiment, if the Earth’s climate warms<br />
because <strong>of</strong> additional carbon dioxide in the<br />
atmosphere, what will happen to the ability <strong>of</strong><br />
the oceans to absorb carbon dioxide?<br />
• How do you think the warming <strong>of</strong> ocean water<br />
will affect the global climate?<br />
• Is this a feedback effect? If so, is it positive or<br />
negative feedback?<br />
Global Systems <strong>Science</strong> <strong>Climate</strong> <strong>Change</strong> Teacher’s <strong>Guide</strong> 25
Laboratory Investigation<br />
The Next Great Super Hero<br />
by John Stegmaier, Gunnison High School, Gunnison, CO<br />
Overview<br />
One <strong>of</strong> the positive scenarios for a warmer world is that plants will<br />
grow better. If that is so, will carbon dioxide be the next great superhero<br />
and feed our growing population? Possibly; and possibly not. In this activity,<br />
students grow plants in atmospheres with different concentrations <strong>of</strong><br />
Carbon Dioxide, and then test the plants for evidence <strong>of</strong> photosynthesis.<br />
With this experiential background, they learn about the more complex<br />
findings <strong>of</strong> pr<strong>of</strong>essional scientists concerning plant growth in atmospheres<br />
enriched in carbon dioxide.<br />
Background<br />
We suggest that you present the following information to your<br />
students after they have completed their experiments.<br />
Plants use carbon dioxide molecules for photosynthesis. They extract<br />
carbon atoms for building plant tissues, and release the oxygen into the<br />
air. If the atmosphere grows richer in carbon dioxide, it makes sense to<br />
predict that plants would grow faster than they do now. A great many<br />
studies have supported this prediction, and suggest that if farmers choose<br />
their crops carefully, they could increase yields. This<br />
has become known as “carbon dioxide fertilization.”<br />
Another interesting finding <strong>of</strong> this research is that<br />
some plants also become more drought-resistant<br />
under carbon dioxide fertilization since they do not<br />
need to keep their stomata (pores) open as much to<br />
draw in carbon dioxide, so they lose less water.<br />
However, the implications <strong>of</strong> the studies are<br />
not all positive. Plants respond differently to<br />
increased levels <strong>of</strong> carbon dioxide, and scientists<br />
have classified them into two groups based on the<br />
number <strong>of</strong> carbon atoms in the compound that is<br />
synthesized during the early steps <strong>of</strong> photosynthesis.<br />
The groups are called C (including wheat, barley,<br />
3<br />
oats, soybeans, sunflowers, rice, and alfalfa) and C4 (including corn, sugar cane, sorghum, and millet.)<br />
Most trees are C , but many tropical plants are C 3 4<br />
Recent studies suggest that C plants might respond<br />
3<br />
better to carbon dioxide fertilization than C plants.<br />
4<br />
That is why forested areas are expected to undergo<br />
change with increasing carbon dioxide, as some trees<br />
and shrubs thrive at the expense <strong>of</strong> others.<br />
Growing the Plants<br />
Pr<strong>of</strong>essional scientists generally produce<br />
carbon dioxide rich atmospheres by enclosing<br />
plants in perforated plastic envelopes, and allowing<br />
carbon dioxide to leak into the enclosure slowly<br />
from gas tanks. Such tanks with pressure regulators<br />
are available for rent in most communities from<br />
companies that produce compressed air for<br />
commercial applications. You might be able to<br />
obtain the assistance <strong>of</strong> a large company in your<br />
community that uses such equipment by borrowing<br />
one <strong>of</strong> their tanks for a couple <strong>of</strong> weeks, and<br />
possibly get help setting it up and using it in your<br />
classroom.<br />
An alternative approach was developed by John<br />
Stegmeir in the GSS Summer Institute. It consists <strong>of</strong><br />
a large tub <strong>of</strong> water with several styr<strong>of</strong>oam “rafts”<br />
cut to fit a plant pot. (One raft is made for the class,<br />
and student teams are assigned to test leaves from<br />
the various plants.) Into each raft is placed a small<br />
potted plant (coleus or geranium are recommended,<br />
but it is important that all plants are identical in<br />
variety and color). Some vegetable oil is poured into<br />
the water to create a film which will prevent carbon<br />
dioxide from being absorbed by the water.<br />
26 Global Systems <strong>Science</strong> <strong>Climate</strong> <strong>Change</strong> Teacher’s <strong>Guide</strong>
Over each raft is placed a “bell jar” made from the top half <strong>of</strong> a 2-liter<br />
soda bottle. The open top <strong>of</strong> each bell jar (where the cap was screwed on) can<br />
be sealed <strong>of</strong>f with a plastic bag and twist tie, which can later be used to sample<br />
the gas in the jar. Each bell jar is pushed down over the raft and into the water<br />
to seal in the atmosphere.<br />
The rafts need to be larger than the plants. In the simplest case, you will<br />
need three rafts and four plants. One plant will have a candle placed on the<br />
raft next to it, inside the bell jar. The candle will be lit before placing the jar<br />
over it, and allowed to burn out. The atmosphere should then have less oxygen<br />
in it and more carbon dioxide. A second raft will have a shallow hole dug into it<br />
with a solid chunk <strong>of</strong> KOH, which absorbs carbon dioxide. This should provide an<br />
atmosphere poor in carbon dioxide. One raft will just have a plant in a normal<br />
atmosphere. Place the tub in a window that receives direct sunlight. A cardboard<br />
frame can be placed over the tub, with circular cut-outs to hold the domes in<br />
place, and expose all plants equally to sunlight. A fourth plant will be placed in<br />
a closet with adequate water, but no light.<br />
Testing for Starch<br />
The presence <strong>of</strong> starch is an indication that photosynthesis is taking place.<br />
After two or three days, some differences might be noticed in the starch content<br />
<strong>of</strong> the various plants. Ask the students for their predictions. If they understand<br />
that photosynthesis produces starch (among other substances) and that plants<br />
need both sunlight and carbon dioxide for photosynthesis to occur, they will<br />
probably predict that:<br />
• The plant in the dark will probably produce no<br />
starch because it has no light.<br />
• The plant with KOH and a carbon dioxide poor<br />
atmosphere will produce little or no starch.<br />
• The plant in room air and full sunlight will produce<br />
starch.<br />
• The plant with the candle and a carbon dioxide<br />
rich atmosphere will produce the most starch.<br />
Conduct starch tests as follows:<br />
1) Pull leaves <strong>of</strong>f <strong>of</strong> top (growing) portions <strong>of</strong> the<br />
plants<br />
2) Boil the leaves in a beaker for one minute<br />
3) Heat (not boil) leaves in alcohol 2 minutes<br />
4) Lay in a 25% solution <strong>of</strong> Iodine for 1 minute<br />
5) Lay flat on a paper towel and look for black lines<br />
which indicate starch production<br />
Student groups can be assigned to test leaves<br />
<strong>of</strong> different plants and then compare with the results<br />
<strong>of</strong> the other teams to test their hypotheses. It is<br />
also possible to test the atmospheres inside the bell<br />
jars for carbon dioxide using BTB as indicated in the<br />
steps on pages 35 <strong>of</strong> this Teacher’s <strong>Guide</strong>.<br />
Discussion<br />
Have each lab group report their results. Focus<br />
the discussion to draw general conclusions from the<br />
combined data, with questions such as:<br />
• Did the plant in the dark produce no starch? How<br />
do you know? If not, why not? (Probably not.<br />
No light, no photosynthesis, no starch.)<br />
• Did the plant with KOH and a carbon dioxide poor<br />
atmosphere produce starch? (Probably very<br />
little, because without carbon dioxide it cannot<br />
photosynthesize.)<br />
• Did the plant in room air and full sunlight<br />
produce starch? (It probably did because it<br />
photosynthesized normally.)<br />
• Did the plant with the candle and a carbon dioxide<br />
rich atmosphere produce the most starch? (It is<br />
possible that it did produce more starch because<br />
photosynthesis was able to proceed more rapidly.<br />
However, it had to have enough oxygen for<br />
respiration. Production is starch is difficult to<br />
predict, which is all the more reason to do the<br />
experiment and find out!)<br />
Global Systems <strong>Science</strong> <strong>Climate</strong> <strong>Change</strong> Teacher’s <strong>Guide</strong> 27
References<br />
Ennis, Christine A. and Marcus, Nancy H., Biological Consequences <strong>of</strong><br />
Global <strong>Climate</strong> <strong>Change</strong>, Global <strong>Change</strong> Instruction Program, University<br />
Corporation for Atmospheric Research, 1994.<br />
Morholt, E., Brandwein, P., and Joseph, A., A Sourcebook for the Biological<br />
<strong>Science</strong>s, 2nd Edition, Harcourt, Brace and World, 1966.<br />
Idso, Sherwood B., and Kimball, Bruce A., “Doubling CO2 Triples Growth<br />
Rate <strong>of</strong> Sour Orange Trees,” DOE Research Summary, Carbon Dioxide<br />
Information Analysis Center, Oak Ridge National Laboratory, Oak Ridge,<br />
TN, December, 1991.<br />
Policy Implications Of Greenhouse Warming: Mitigation, Adaptation, and<br />
<strong>Science</strong> Base, Washington, D.C., National Academy Press, 1993.<br />
28 Global Systems <strong>Science</strong> <strong>Climate</strong> <strong>Change</strong> Teacher’s <strong>Guide</strong>
Chapter 4. What’s So Special<br />
About CO 2 ?<br />
Page 28<br />
The cartoon and short paragraph on page 28 are intended<br />
to illustrate why the students are asked to learn more about<br />
matter and energy. In the cartoon, we see Mother Nature<br />
adding just a pinch <strong>of</strong> carbon dioxide to the atmosphere,<br />
“to make the whole thing really work.” As described in the<br />
paragraph below, the purpose <strong>of</strong> the chapter to follow is to<br />
find why carbon dioxide is so special that without it, our world<br />
would be unsuitable for life as we know it.<br />
In order to answer that simple question, the<br />
chapter provides an introduction to modern theories<br />
<strong>of</strong> matter and energy. The key concept presented is<br />
resonance. Molecules <strong>of</strong> carbon dioxide gas resonate<br />
when they encounter photons <strong>of</strong> infrared energy; while<br />
molecules <strong>of</strong> oxygen and nitrogen do not. Later, the same<br />
explanation will be expanded to encompass all <strong>of</strong> the greenhouse<br />
gases.<br />
Please keep in mind that this chapter is not intended to be a substitute<br />
for courses in chemistry and physics; but is intended to whet the students’<br />
appetites for learning more about science. Therefore, we suggest you focus<br />
on communicating an intuitive grasp <strong>of</strong> how matter and energy interact, and<br />
what this interaction can tell us about life on Earth.<br />
Page 28–30<br />
This very brief sketch <strong>of</strong> the history <strong>of</strong> ideas<br />
about matter is intended to lead to the idea that<br />
matter is composed <strong>of</strong> atoms and molecules. This is<br />
probably not the first time your students have heard<br />
this theory, but they may have misconceptions about<br />
it. A good way to find out your students’ ideas is to<br />
draw a picture <strong>of</strong> a stoppered flask on the board,<br />
with a few tiny circles to represent molecules <strong>of</strong><br />
nitrogen, the most common gas in air. Explain that<br />
the molecules are drawn thousands <strong>of</strong> times larger<br />
than they would be if drawn to scale, and ask them<br />
a few questions about it: Suppose I leave this flask<br />
alone overnight. Tomorrow, what will happen to<br />
the molecules? Will most <strong>of</strong> them be along the<br />
top, bottom, or distributed throughout the flask?<br />
Is there anything in between the molecules? What<br />
will happen if I introduce carbon dioxide molecules<br />
(color these in)? Will they flow in along the bottom,<br />
top, or be distributed throughout the flask? Invite<br />
your students to share their ideas, then argue and<br />
debate different points <strong>of</strong> view.<br />
“Light Energy” beginning on page 29<br />
introduces both the wave and particle theories<br />
<strong>of</strong> electromagnetic energy. If is important for<br />
your students to explore the colors in white light<br />
with prisms or diffraction gratings. (A good way to<br />
create a rainbow in a darkened classroom is with<br />
a diffraction grating placed on top <strong>of</strong> an overhead<br />
projector. A prism placed in the beam will also<br />
work. )<br />
Page 29–30 introduce the idea that photons<br />
<strong>of</strong> different colors have different wavelengths and<br />
frequencies. Have students play with Slinkies, other<br />
long springs, or ropes, observing how wavelength is<br />
related to frequency (speed <strong>of</strong> shaking). A good<br />
activity is for the students to tie one end <strong>of</strong> a rope<br />
or Slinky to a stationary object and observe how a<br />
single pulse is reflected from the fixed end. (They<br />
will see that the direction and shape <strong>of</strong> the wave is<br />
reversed when the wave is reflected.)<br />
It may seem redundant to identify light by<br />
both wavelength and frequency, but both concepts<br />
are important in understanding the nature <strong>of</strong><br />
electromagnetic radiation. Wavelength is the most<br />
visible and concrete property that allows us to<br />
distinguish x-rays from radio waves, or blue light<br />
from red or green light. While frequency makes<br />
the same distinctions (since it is just the reciprocal<br />
Global Systems <strong>Science</strong> <strong>Climate</strong> <strong>Change</strong> Teacher’s <strong>Guide</strong> 29
<strong>of</strong> wavelength), it also captures the idea <strong>of</strong> different energies corresponding to<br />
different wavelengths. When students shake the slinky or rope (or in the next<br />
activity, the model molecule) they feel that greater energy is needed to produce<br />
the vibration than when they shake it more slowly.<br />
Pages 31–32<br />
The discussion <strong>of</strong> infrared energy on page 31 can be made more meaningful if<br />
your students can actually feel radiant energy in the classroom. If direct sunlight<br />
is streaming into the window, they can put their hands in the beam. They can<br />
shade the infrared energy with a piece <strong>of</strong> cardboard, and feel the cool shadow.<br />
If the weather is cloudy, bring in a small space heater, candle, or heat lamp so<br />
they can feel the infrared energy.<br />
The activities on page 32 might best be done at home, where most students<br />
have access to televisions and remote control devices. Short written reports on<br />
the student’s findings can be shared in class.<br />
The introduction to resonance on page 33 is very important, as resonance<br />
is the central idea that explains how greenhouse gases absorb infrared energy.<br />
Nearly everyone has experienced pushing people on a swing, so it should not be<br />
difficult for them to relate to the example; but it would also be valuable to set<br />
up several pendulums in class. Weights on strings with different lengths have<br />
different resonant frequencies. Students will be able to measure these resonant<br />
frequencies by finding the rhythm for pushing each pendulum to keep it swinging,<br />
and then counting the number <strong>of</strong> pushes in ten seconds.<br />
Pages 33–34<br />
Several different kinds <strong>of</strong> materials have been<br />
used successful to construct model molecules to<br />
achieve the resonance effect. Following are the<br />
different kinds <strong>of</strong> materials that were developed<br />
by high school teachers during the GSS summer<br />
institutes.<br />
Polystyrene Balls<br />
Long, Stiff Springs<br />
Springy Steel Rods<br />
Taped Hacksaw Blades<br />
Plastic Strips with Nuts and Bolts<br />
We recommend that you determine which<br />
would be easiest to obtain and build a set <strong>of</strong><br />
molecules to see how easy it is to observe a<br />
difference in resonance before presenting the<br />
lesson to your students. (To demonstrate the<br />
effect, carbon dioxide and methane molecules<br />
should resonate quite easily when shaken at<br />
moderate speed by hand, while oxygen and<br />
nitrogen should only resonate if shaken very<br />
rapidly, or may not resonate at all.)<br />
Page 36–37<br />
The concept <strong>of</strong> resonance is a broad and<br />
powerful principle in physics that explains a very<br />
wide variety <strong>of</strong> phenomena. In this section, several<br />
examples besides molecules are given. Ask your<br />
students to think <strong>of</strong> others in their own experience.<br />
Feel free to add some ideas <strong>of</strong> your own to get the<br />
juices flowing.<br />
You can also ask a few questions to help the<br />
students see more examples <strong>of</strong> resonance around<br />
them. (For example, the way we speak and hear<br />
can be explained by resonance. What is resonating<br />
when we speak? What is resonating when we hear?<br />
What resonates when a drum is played, or a clarinet<br />
or trumpet? Why is it easier to play deep notes on<br />
a tuba than on a trumpet?)<br />
Applying resonance to the tiny world <strong>of</strong><br />
photons and molecules is not easy; but it will be<br />
easier for the students to visualize once they have<br />
felt resonance in the previous activity, and applied<br />
the concept to other situations that they see around<br />
them every day. At a microscopic level, they need<br />
to visualize infrared photons as vibrating at just the<br />
right speed to cause a carbon dioxide or methane<br />
30 Global Systems <strong>Science</strong> <strong>Climate</strong> <strong>Change</strong> Teacher’s <strong>Guide</strong>
molecule to absorb that vibration. In contrast, infrared and visible<br />
photons pass right by oxygen and nitrogen molecules without causing<br />
them to vibrate. In this way, the concept <strong>of</strong> resonance explains why<br />
air is transparent to visible light, and why it would be transparent to<br />
infrared radiation, if it were not for the small percentage <strong>of</strong> carbon<br />
dioxide, methane, and a few other greenhouse gases which all resonate<br />
at infrared frequencies.<br />
Page 35<br />
Have the students look back at the “quick-and-dirty” explanation<br />
<strong>of</strong> the greenhouse effect on pages 3–4. Then have them compare it with<br />
the explanation on page 36. Ask the students what the explanation on<br />
page 36 provides which the description on pages 3–4 does not. (The<br />
discussion on page 36 <strong>of</strong>fers an explanation at the molecular level,<br />
involving the concept <strong>of</strong> resonance.) Ask the students to try to describe<br />
how the greenhouse effect occurs in their own words.<br />
The greenhouse effect in the Earth’s atmosphere differs from the<br />
effect in an actual greenhouse. The explanation is at a molecular level.<br />
A good assignment to see if individuals understand the concept presented<br />
on the previous pages is to ask them to read page 29-31, and to write a<br />
story about what happens to a single infrared photon from the time it<br />
leaves the sun, to the time it leaves the Earth for space. Students who<br />
finish early might do the same for a photon <strong>of</strong> visible light.<br />
To help the students review the chapter, you might ask:<br />
• If the greenhouse effect is not new, why do we hear so much about<br />
it in the newspapers?<br />
• If carbon dioxide has always existed in the atmosphere, why are<br />
scientists making such a big deal about it?<br />
• What do you think life would be like on Earth if we had no carbon<br />
dioxide or other greenhouse gases in the atmosphere?<br />
• If our atmosphere were 1% carbon dioxide instead <strong>of</strong> .036% that is in<br />
the atmosphere today?<br />
• How do you think scientists know how much carbon dioxide is in the<br />
atmosphere?<br />
The last question was not answered previously in the book. It is<br />
the subject <strong>of</strong> the next chapter, and a good way to get them to think<br />
about the difficulties involved in making such measurements.<br />
Global Systems <strong>Science</strong> <strong>Climate</strong> <strong>Change</strong> Teacher’s <strong>Guide</strong> 31
Investigation<br />
Resonance Activity Modifications<br />
by Agnes Wu, Greyhills High School, Tuba City, AZ<br />
Wes Knapp, Scotia-Glenville Central High School, Scotia, NY<br />
and Peter Leddy, Norton High School, Norton, MA<br />
Materials<br />
We found the best materials to be styr<strong>of</strong>oam<br />
balls joined by stiff heliacal springs, about 15 cm<br />
long. Each team will need the following: 3 styr<strong>of</strong>oam<br />
balls; 2 or 4 springs; 1 clock or watch<br />
Activity<br />
Have the students push the springs into the<br />
styr<strong>of</strong>oam balls as shown in the illustrations. In all<br />
models, the springs should be secured with a small<br />
quantity <strong>of</strong> glue after locating the proper positions<br />
<strong>of</strong> the springs.<br />
Creating a methane molecule which accurately<br />
reproduces the structure <strong>of</strong> a tetrahedron is an extra<br />
challenge. We were able to mark the styr<strong>of</strong>oam ball<br />
that represented the carbon atom for the positions<br />
<strong>of</strong> the springs as follows:<br />
a. Form a piece <strong>of</strong> wire into a loop with a diameter<br />
.95 times the circumference <strong>of</strong> the styr<strong>of</strong>oam<br />
ball. Mark the circle in three spots, so it is<br />
divided into three equal segments (do not cut<br />
the wire!)<br />
b. Place the wire on the ball, and mark the ball<br />
where each <strong>of</strong> the marks on the wire touch it.<br />
This is the location <strong>of</strong> three <strong>of</strong> the bonds.<br />
c. To find the location <strong>of</strong> the fourth bond, reposition<br />
the wire so that only two <strong>of</strong> the marks made<br />
above align with the marks on the wire. Mark the<br />
ball a fourth time at the third mark on the wire.<br />
The result should be a ball (carbon atom) with<br />
four marks equally spaced three dimensionally<br />
around it.<br />
d. Push in ends <strong>of</strong> springs at each mark, and glue<br />
into place. Glue styr<strong>of</strong>oam balls representing<br />
hydrogen atoms on the ends <strong>of</strong> each spring.<br />
Resources<br />
An excellent video available from the American<br />
Association <strong>of</strong> Physics Teachers (AAPT) is entitled<br />
Tacoma Narrows Bridge Collapse. This short (10<br />
minute) illustrates how gusts <strong>of</strong> wind at the resonant<br />
frequency <strong>of</strong> the bridge structure, caused the entire<br />
bridge to collapse.<br />
Chapter 5 How Can We<br />
Measure Carbon Dioxide?<br />
Page 38–40<br />
The primary purpose <strong>of</strong> this chapter is for<br />
students to learn how the concentration <strong>of</strong> carbon<br />
dioxide in the stratosphere is monitored. Other<br />
greenhouse gases are monitored in a similar way.<br />
A secondary purpose is for students to learn more<br />
about who does science. It is not unusual that the<br />
carbon dioxide monitoring project was conceived by<br />
a scientist with a Ph.D., but the day-to-day conduct<br />
<strong>of</strong> the project is conducted by people who have<br />
a wide variety <strong>of</strong> different skills, from electrical<br />
engineers to meteorologists and student assistants.<br />
The interviews in this chapter are intended to help<br />
students see that science is done by people with<br />
different ethnic and cultural backgrounds, who have<br />
taken a variety <strong>of</strong> different career paths.<br />
Help students find Mauna Loa on a map. Where<br />
is it with respect to other places in the State <strong>of</strong><br />
Hawaii that they may have heard <strong>of</strong>, such as Waikiki<br />
and Honolulu? (Both are on the smaller island <strong>of</strong><br />
Oahu.) The two large volcanoes, Mauna Loa (Where<br />
the Earth observatory that we visit is located),<br />
and Mauna Kea (where the new Keck telescope is<br />
located) are both on the Big Island <strong>of</strong> Hawaii. The<br />
Big Island <strong>of</strong> Hawaii is also a tourist destination,<br />
where the famous Kona Coast and the town <strong>of</strong> Hilo<br />
are located.<br />
32 Global Systems <strong>Science</strong> <strong>Climate</strong> <strong>Change</strong> Teacher’s <strong>Guide</strong>
Investigation<br />
Observing Carbon Dioxide Gas<br />
Materials for each team<br />
1 empty tub or dish pan<br />
1 small chunk <strong>of</strong> solid carbon dioxide (dry ice)<br />
1 bottle <strong>of</strong> soap solution and bubble-blowing ring<br />
A wonderful way to test your students’<br />
predictions about what will happen to the carbon<br />
dioxide molecules in the flask, is to have lab teams<br />
put a lump <strong>of</strong> solid carbon dioxide (dry ice) into an<br />
empty tub. Within a few seconds, the solid carbon<br />
dioxide will sublime, forming a cloud <strong>of</strong> gas in the<br />
bottom <strong>of</strong> the tub. The students can blow soap<br />
bubbles and watch them fall into the tub. The<br />
bubbles will settle as far as the top <strong>of</strong> the mass <strong>of</strong><br />
carbon dioxide gas, where they will stop and hover.<br />
In a few minutes the mass <strong>of</strong> carbon dioxide gas will<br />
get larger as more <strong>of</strong> the dry ice sublimes.<br />
Going back to the drawing on the board, ask<br />
the students what their experiments suggest about<br />
what will happen to the carbon dioxide atoms in the<br />
flask. (They will probably predict that the carbon<br />
dioxide molecules will cluster along the bottom<br />
Responses to the questions raised on pages<br />
39–40 are:<br />
Why is it necessary for John Chin to hold his<br />
breath? Like all animals, people exhale carbon<br />
dioxide. So John Chin’s breath would make the<br />
concentration appear higher than it actually is<br />
if he does not hold his breath.<br />
Why is John Chin the only one allowed to take<br />
flask samples? Controlling variables—keeping<br />
everything the same except for the test<br />
variable—is very important in an experiment.<br />
If the same person collects the data, it is more<br />
likely that the samples will all be alike. The only<br />
thing different will be the date on which the<br />
sample is collected. That will make it possible<br />
to infer from the data how carbon dioxide<br />
concentration is increasing over time, and rule<br />
out the possibility that there is some change in<br />
the collection in the data.<br />
It may seem odd that the text describes<br />
three method for collecting and measuring carbon<br />
dioxide—the single flask method, the new flask<br />
method, and the continuous monitoring system on<br />
<strong>of</strong> the flask, while the nitrogen molecules will be<br />
pushed upwards.)<br />
You may want to return to some <strong>of</strong> the ideas<br />
on page 28 to conclude the session, explaining<br />
that the modern particle theory <strong>of</strong> matter agrees<br />
with Democritus, that there is absolutely nothing<br />
between the molecules; and that there are different<br />
kinds <strong>of</strong> molecules, which have different properties.<br />
If molecules did not move around all the time, they<br />
would fall to the bottom <strong>of</strong> the flask, but because<br />
they are always in motion, they bounce around,<br />
filling the flask. This is inferred by the behavior <strong>of</strong><br />
gases in situations such as balloons, in which the<br />
molecules <strong>of</strong> gas push on the rubber, filling out the<br />
balloon. Because the carbon dioxide molecules<br />
are “heavier” (have more mass than) the nitrogen<br />
molecules, they tend to be found on the bottom <strong>of</strong><br />
the flask, pushing the nitrogen towards the top.<br />
top <strong>of</strong> Mauna Loa. The whole story is included for<br />
several reasons. First, it shows how techniques in<br />
science <strong>of</strong>ten progress, from very simple methods<br />
to more complex techniques designed to improve<br />
the quality <strong>of</strong> the data. Second, it shows how two<br />
different techniques are used to check the accuracy<br />
<strong>of</strong> the result. And third, the three methods introduce<br />
ideas important to the monitoring <strong>of</strong> carbon dioxide<br />
one step at a time; from simple collection <strong>of</strong> a<br />
sample in a chamber (the single flask method), to<br />
improved sampling <strong>of</strong> uncontaminated air from a tall<br />
tower (methods two and three), to the purification<br />
<strong>of</strong> the sample and actual measuring techniques<br />
(continuous sampling on Mauna Loa.)<br />
Pages 40–44<br />
The diagram on page 42 provides an overview<br />
<strong>of</strong> the carbon dioxide monitoring process at the<br />
observing station on top <strong>of</strong> Mauna Loa. You might<br />
want to ask the student:<br />
Why is the air collected at the top <strong>of</strong> a tower?<br />
Does this remind you <strong>of</strong> anything else we saw<br />
in this chapter? (This is an improvement over<br />
Global Systems <strong>Science</strong> <strong>Climate</strong> <strong>Change</strong> Teacher’s <strong>Guide</strong> 33
the telescoping tube shown on page 40. The idea is to sample the air as<br />
far away from contaminants, such as human breath and breezes from lower<br />
altitudes, so that the air sample represents the average atmosphere <strong>of</strong> the<br />
Earth.)<br />
Why is it necessary to extract the water vapor from the air? (This foreshadows<br />
Chapter 7 in which we find that water vapor is also a greenhouse gas. If it<br />
is permitted into the test chamber, the result will give an incorrect reading<br />
<strong>of</strong> the amount <strong>of</strong> carbon dioxide. For now, let the students express their<br />
opinions; then remind them <strong>of</strong> this when they read about water vapor as<br />
a greenhouse gas in Chapter 7, so they can figure it out for themselves if<br />
they have not already done so.)<br />
What is happening to the carbon dioxide gas at a molecular level inside <strong>of</strong> the<br />
test chamber? (The molecules resonate and absorb energy from the infrared<br />
photons. They vibrate and move around faster. The movement <strong>of</strong> molecules<br />
is measured as an increase in temperature <strong>of</strong> the test sample.)<br />
How does measuring temperature help the researchers measure the amount <strong>of</strong><br />
carbon dioxide in the air? (A higher temperature means that more carbon<br />
dioxide must be in the air. The test gases, which have a measured amount<br />
<strong>of</strong> carbon dioxide, allow them to relate a certain temperature to a certain<br />
concentration <strong>of</strong> carbon dioxide.)<br />
Understanding the experiment, by following<br />
the steps on pages 40–41, will help the students<br />
understand what they are seeing in the pictures<br />
on page 42. Otherwise, it’s nothing but a jumble<br />
<strong>of</strong> machines and wires. For each picture, ask the<br />
students to identify where (which number) on page<br />
42, that piece <strong>of</strong> equipment would be placed, and<br />
what its function is supposed to be.<br />
Be sure the students notice the measured<br />
amounts <strong>of</strong> gas printed on the tank at the bottom<br />
<strong>of</strong> page 42. It is 340 ppm. Can they guess what<br />
the concentration in the other tank is? (from the<br />
drawing above, it is 370 ppm.) The other gases are<br />
combined in the amounts in which they actually<br />
occur in the atmosphere.<br />
To help the students understand the photos<br />
on page 41, you can draw on the chalkboard a large<br />
version <strong>of</strong> the strip chart, and help them to interpret<br />
it with some leading questions, such as:<br />
• What’s the vertical scale on this chart? (It<br />
indicates time, with earlier times at the top,<br />
and later times at the bottom.)<br />
• What is the horizontal scale? (It indicates the<br />
temperature <strong>of</strong> the gas, which corresponds to<br />
the concentration <strong>of</strong> carbon dioxide in ppm.)<br />
• What does the top trace indicate? (It shows<br />
the concentration <strong>of</strong> carbon dioxide in the<br />
atmosphere, 353.7 ppm.)<br />
• What does the middle trace indicate? (The jog<br />
to the left indicates the temperature <strong>of</strong> the 340<br />
ppm test sample.)<br />
• What does the bottom trace indicate? (The jog to<br />
the right indicates the temperature <strong>of</strong> the 370<br />
ppm test sample.)<br />
You can faintly see these jogs back and forth<br />
in the data chart spread out in front <strong>of</strong> Ms. Yokoi in<br />
the picture at the top <strong>of</strong> page 43.<br />
sample<br />
from tank<br />
340 ppm<br />
Diagram <strong>of</strong> strip chart record, page 41<br />
sample from the air<br />
353.7 ppm<br />
sample<br />
from tank<br />
370 ppm<br />
return to air sample<br />
(out <strong>of</strong> view)<br />
34 Global Systems <strong>Science</strong> <strong>Climate</strong> <strong>Change</strong> Teacher’s <strong>Guide</strong>
Pages 43-44<br />
The purpose <strong>of</strong> these two pages is to give a better overview <strong>of</strong> the work that<br />
goes on at the Mauna Loa observatory. In the picture at top left, page 44, we see<br />
two full-time employees and learn a little about what it’s like to work in science<br />
at a remote observing site. The two individuals at the upper right, from NOAA<br />
headquarters, illustrate that although Mauna Loa is in an isolated location, it is<br />
tied into a network <strong>of</strong> scientists and technicians spread throughout the globe.<br />
A good activity to end the unit might be to ask the students to write about<br />
whether they would or would not like to work at a place like Mauna Loa. An<br />
alternative topic would be how the work that these people are doing at Mauna<br />
Loa today may affect the lives <strong>of</strong> their children and grandchildren in the future.<br />
Pages 44–47<br />
The method <strong>of</strong> measuring the concentration <strong>of</strong> carbon dioxide in the air used at Mauna<br />
Loa requires sophisticated equipment not normally available in the classroom. However, it<br />
is possible for your students to measure the relative amounts <strong>of</strong> carbon dioxide in different<br />
samples <strong>of</strong> air using a chemical method.<br />
Although the method used by your students is different from the method used on Mauna<br />
Loa, the idea that they can measure the concentration <strong>of</strong> an invisible gas in the air is very<br />
clearly communicated in this activity. Additionally, students have opportunities to practice lab<br />
skills such as sampling, use <strong>of</strong> acid/base indicators, measurement, qualitative and quantitative<br />
observation, titration, and use <strong>of</strong> a laboratory control.<br />
Furthermore, nearly all students enjoy the colorful chemistry in this experiment, and<br />
are able to obtain results that are very satisfying, so it is really worth the effort to gather<br />
the materials and have student teams do the experiment. It is much more exciting for them<br />
to do it, than to see it done as a demonstration!<br />
The step-by-step procedure is not difficult<br />
for most students to follow; but some may require<br />
assistance. It is best for you to do the experiment<br />
on your own before presenting it to the class, so<br />
that you will be prepared to answer their questions.<br />
Following are a couple <strong>of</strong> tips:<br />
• Reaction bottles. Vinegar and baking soda are<br />
mixed in the reaction bottle to produce pure<br />
carbon dioxide. We have found tall wine bottles<br />
to be excellent for this purpose. In smaller<br />
bottles, the mixture bubbles to the top and<br />
into the balloon, while in 2-liter plastic soda<br />
bottles, the thread at the top causes air to<br />
leak. If you have other bottles, experiment<br />
with them to see if you can get a good sample<br />
<strong>of</strong> carbon dioxide.<br />
• Avoid contamination. Caution the students to<br />
take care to get the reactants inside the bottle<br />
without leaving any on the lip <strong>of</strong> the bottle<br />
where the balloon will be placed. If vinegar<br />
or baking soda are in the balloon, rather than<br />
just the carbon dioxide gas sample, the results<br />
will be changed.<br />
• Preparing the BTB solution. Prepare the solution<br />
in a large gallon jug, and then pour it into small<br />
dropper bottles for the student teams. Mixing<br />
the solution all at once will ensure that all <strong>of</strong><br />
the students’ dropper bottles will contain the<br />
same concentration <strong>of</strong> BTB. Mix enough BTB with<br />
the water —usually 75-100 drops <strong>of</strong> concentrate<br />
per gallon <strong>of</strong> water—so the solution is a deep<br />
translucent blue. Test the solution by putting some<br />
in a vial and blowing bubbles in it with a straw. In<br />
a few breaths it should turn green and then yellow.<br />
Once the solution is prepared, pour it into dropper<br />
bottles for the students.<br />
• Preparing the ammonia solution. Again, prepare a<br />
dilute solution <strong>of</strong> 1 part household ammonia and 25<br />
parts water. We have found that different brands<br />
<strong>of</strong> ammonia come in different concentrations.<br />
The 1:25 ratio works well for Parson’s Ammonia.<br />
Prepare a solution and test it with a sample <strong>of</strong> pure<br />
carbon dioxide. Bubble the carbon dioxide through<br />
the BTB. If the BTB is the right concentration,<br />
the solution will turn yellow. Then titrate it<br />
with ammonia. If it requires 50-100 drops <strong>of</strong><br />
ammonia to turn the solution blue again, the<br />
concentration is about right. (If it takes just a<br />
few drops, the solution needs to be more dilute.<br />
If it takes more than 100 drops, the solution should<br />
be more concentrated.) When you are sure the<br />
concentration is right, pour the solution into<br />
dropper bottles for each team.<br />
Global Systems <strong>Science</strong> <strong>Climate</strong> <strong>Change</strong> Teacher’s <strong>Guide</strong> 35
• It will save time to distribute the materials on a tray to each team. Use the<br />
list <strong>of</strong> materials listed on page 44. Keep the bottles <strong>of</strong> ammonia in reserve<br />
until they are needed, so students do not use them accidentally.<br />
• The greatest danger from this experiment is that a student might be struck by<br />
a car when the class goes outdoors to collect an auto gas sample. Collecting<br />
the sample for the students is not nearly as effective as having them collect<br />
the samples. So, we recommend that you position the car in a safe place,<br />
possibly a parking lot, near the school, where the class can stand around and<br />
watch as a representative from each team collects the sample in a balloon.<br />
Good luck!<br />
Investigation<br />
The Balance <strong>of</strong> Carbon Dioxide in the Atmosphere<br />
by Jim Ingram, San Andreas High School, El Paso, Texas<br />
and Rich White, Cholla High School, Tucson, Arizona<br />
The solutions and equipment used for “Sampling Carbon Dioxide” can be used<br />
for these two additional activities. However, for each lab team you will also need<br />
a beaker and stirrer, two test tubes, three culture tubes with stoppers, yeast, two<br />
more balloons, and aquarium plants (such as elodea or anarchis.)<br />
Activity A. “How Much Sugar?”<br />
(Investigating Respiration)<br />
Tell the students that they will be experimenting<br />
with yeast—the substance that bakers use to make<br />
the holes in bread. Ask them to imagine that they<br />
lost their favorite recipe, which produced a very<br />
fluffy bread with lots <strong>of</strong> holes. The objective <strong>of</strong><br />
the experiment is to see how much sugar should be<br />
added to the bread.<br />
Show the students how to mix 50 ml <strong>of</strong> warm<br />
water, one package <strong>of</strong> dry yeast, and a measured<br />
amount <strong>of</strong> sugar in a beaker and stir until the yeast<br />
is dissolved. (Use water that is slightly warmer than<br />
body temperature. Hot water will kill the yeast, and<br />
cold water will not allow the yeast to reactivate.)<br />
They should then pour the mixture into a test tube<br />
so it is half full, and slip a balloon over the top <strong>of</strong><br />
the test tube.<br />
Suggest that teams compare two test tubes:<br />
one with no sugar and one with a selected amount<br />
<strong>of</strong> sugar. Each team might select a different amount<br />
<strong>of</strong> sugar to add, so that the pooled data will reveal<br />
how much sugar is optimal. Students should begin<br />
to see balloons fill after five minutes. Each team<br />
can measure the circumference <strong>of</strong> its balloon with<br />
a tape measure or a string and ruler.<br />
Have students pool their data and draw<br />
conclusions about how much sugar to add to the<br />
bread (per packet <strong>of</strong> yeast.) Have the students<br />
discuss what they think the gas is. They can then<br />
test the gas by bubbling it through BTB. (Surprise—<br />
it’s carbon dioxide!)<br />
After the experiment, you can tell the students<br />
that yeast is a living organism (a fungus) which uses<br />
sugar as food. Respiration <strong>of</strong> yeast produces alcohol<br />
and carbon dioxide. This is the same process <strong>of</strong><br />
respiration that occurs in virtually all plants and<br />
animals (including humans!)<br />
36 Global Systems <strong>Science</strong> <strong>Climate</strong> <strong>Change</strong> Teacher’s <strong>Guide</strong>
Activity B. “The Role <strong>of</strong> Plants”<br />
(Investigating Photosynthesis)<br />
Using a beaker <strong>of</strong> BTB solution and a straw,<br />
have students slowly blow bubbles until the solution<br />
turns bright yellow. (This will probably take a<br />
few breaths.) Invite them to discuss why it turns<br />
yellow. (Respiration generates carbon dioxide gas,<br />
which turns to carbonic acid in the water. BTB is<br />
an indicator. The carbonic acid causes the indicator<br />
solution to turn yellow.)<br />
Have the students divide the yellow solution<br />
into three culture tubes with airtight stoppers. One<br />
tube should be left as a control. Into each <strong>of</strong> the<br />
other tubes, place a leaf <strong>of</strong> an aquarium plant such<br />
as elodea or anarchis. Put one <strong>of</strong> the tubes with the<br />
plant into a dark place and the other into the light.<br />
Ask the students what they think will happen and<br />
leave the culture tubes overnight. The next day, it<br />
is probable that the tube with the plant in the light<br />
will turn blue, while the solution in the other two<br />
will remain yellow.<br />
Ask your students if they can explain the<br />
result. (The plant in the light absorbs the carbon<br />
dioxide from the water through the process <strong>of</strong><br />
photosynthesis. The plant in the dark does not<br />
photosynthesize because <strong>of</strong> the absence <strong>of</strong> light, so<br />
it cannot absorb carbon dioxide.)<br />
Ask the students to relate the results <strong>of</strong> their<br />
experiments to carbon dioxide in the atmosphere.<br />
What are some natural processes that add carbon<br />
dioxide to the air? What are some processes that<br />
remove carbon dioxide from the air?<br />
Chapter 6 Is the Atmosphere<br />
Really Changing?<br />
Page 48<br />
The cartoon on page 48 is meant to capture<br />
one aspect <strong>of</strong> science—data analysis. Even on the<br />
beautiful island <strong>of</strong> Hawaii, pouring through piles <strong>of</strong><br />
data and plotting points on a graph can be tedious.<br />
But when you look at your results, something<br />
wonderful might happen—a pattern that tells you<br />
something about the world!<br />
Ask the students what they think the cartoon<br />
has to say, both before and after they have<br />
completed the activities in this chapter. If their<br />
thinking seems limited to the idea that “science<br />
is boring,” ask them to imagine what might occur<br />
when the person in the cartoon wakes up and sees<br />
the patterns in the data. What might she have<br />
discovered? What might she say? What might be<br />
the value <strong>of</strong> her discoveries to other scientists? To<br />
people who live along the coasts or on islands? To<br />
her children or grandchildren?<br />
Global Systems <strong>Science</strong> <strong>Climate</strong> <strong>Change</strong> Teacher’s <strong>Guide</strong> 37
Pages 48–51<br />
Part A. Students who have experience with graphing will just need a sheet <strong>of</strong> blank graph<br />
paper. They can figure out that the vertical scale should be titled “Concentration <strong>of</strong> Carbon<br />
Dioxide in ppm,” and should run from 350 or 352 ppm to 360 ppm. The horizontal scale should<br />
be titled “Time,” and should be divided into 24 equal segments, labeled by month from 1/91 to<br />
12/92. If your students are not prepared to do this on their own, you may want to label a sheet<br />
<strong>of</strong> graph paper, copy it, and give it to the students to plot the information.<br />
(As mentioned earlier in this Teacher’s <strong>Guide</strong>, all graphs do not have to start at 0. The<br />
horizontal and vertical scales should range from the lowest value to the highest in the data, and<br />
proportions should reveal details and trends. By convention, time is on the horizontal axis.)<br />
Possible answers to the questions on page 49 are as follows:<br />
6.1. The most obvious pattern in carbon dioxide concentration is seasonal. It increases until<br />
May, 91, then decreases to a minimum in September and October, 91, then increases again<br />
to a maximum in May and June, 92, decreasing again to a minimum in September, 92. The<br />
students may also notice that the concentration <strong>of</strong> carbon dioxide is a little greater in 1992<br />
than in 1991, but that observation is not as obvious as the seasonal difference.<br />
6.2. The amount <strong>of</strong> carbon dioxide in the air increases during the months <strong>of</strong> November-May.<br />
Students may have different theories.<br />
6.3. The amount <strong>of</strong> carbon dioxide in the air decreases during the months <strong>of</strong> May-September.<br />
Listen to students’ ideas about this.<br />
6.4. In early Spring, plants begin to grow, while the last season’s growth is still decaying. By<br />
mid-Summer, plants are growing most rapidly, absorbing carbon dioxide, and incorporating<br />
the carbon into their tissues.<br />
6.5. In Fall, plants die, and by September and<br />
October, they start to decay, releasing carbon<br />
back into the atmosphere. This process<br />
continues through the Winter.<br />
6.6. The evidence does appear to support a<br />
connection between plant growth cycles<br />
and the concentration <strong>of</strong> carbon dioxide in<br />
the atmosphere; at least in the Northern<br />
Hemisphere.<br />
355<br />
354<br />
353<br />
352<br />
351<br />
Conc. <strong>of</strong> CO2 in parts 350 per million (ppm)<br />
349<br />
348<br />
347<br />
346<br />
345<br />
Part B. Allow time for the students to work<br />
in pairs to discuss their predictions in response<br />
to the questions on page 50. Write the different<br />
predictions on the chalkboard, asking students to<br />
vote on what they think will occur. If students are<br />
confused about why seasons are reversed in the two<br />
hemispheres, don’t address this just yet. Wait until<br />
after they have completed the activity. Then have<br />
them plot the data.<br />
Results <strong>of</strong> Student graph from earlier edition <strong>of</strong> <strong>Climate</strong> <strong>Change</strong> that used 1987-1988 data<br />
Result <strong>of</strong> Student Home Investigation - SEE PAGE 9<br />
Findings From Mauna Loa and the South Pole Compared<br />
Mauna Loa<br />
South Pole<br />
Jan.Feb.Mar.Apr.MayJuneJulyAug.Sept. Oct.Nov.Dec.Jan.Feb.Mar.Apr.MayJuneJulyAug.Sept. Oct.Nov.Dec.<br />
1987 1988<br />
38 Global Systems <strong>Science</strong> <strong>Climate</strong> <strong>Change</strong> Teacher’s <strong>Guide</strong>
The students will find that the seasonal pattern <strong>of</strong> carbon dioxide concentration<br />
in the Southern Hemisphere is just opposite to that in the Northern Hemisphere,<br />
but the amplitude—the difference between the highest and lowest values—is less.<br />
Invite the students to explain why they think that is the case.<br />
Responses to the questions on page 51 are as follows:<br />
6.14. About 315 ppm.<br />
6.15. About 356 ppm (midway between 352.8 and 359.3).<br />
6.16. (356-315)/315 = .13 = 13%<br />
Page 52<br />
The discussion <strong>of</strong> seasonal changes that begins on page 52 gives an explanation<br />
for the seasonal changes in carbon dioxide concentration. Students who figured<br />
it out from their own analyses will probably be gratified to see their theories<br />
confirmed. Those that did not, have an opportunity to learn about it here.<br />
The seasons are frequently misunderstood by both students and adults. The<br />
Earth is not warmer in summer because we are closer to the sun. (In fact, the<br />
Earth is slightly further from the Sun during the Northern Hemisphere winter.)<br />
Instead, the Earth’s axis is not pointed at right angles from the plane <strong>of</strong> its orbit<br />
around the Sun; but rather at a tilt <strong>of</strong> 23-1/2°. The axis keeps this orientation<br />
(pointing at the North Star) as it orbits the Sun, during one year. This causes the<br />
more light and heat from the Sun to fall on one hemisphere more during one half<br />
<strong>of</strong> the year, and on the other hemisphere during the other half-year.<br />
You may want to demonstrate this with a globe<br />
and a single lamp in a dark room. First show how<br />
the Earth spins on its axis (once a day) and orbits<br />
the Sun (once a year.) Demonstrate that if the<br />
axis were pointed straight “up” (perpendicular to<br />
its orbit around the Sun), both hemispheres would<br />
receive equal light and heat throughout the year. It<br />
would still be colder at the poles and hotter on the<br />
equator, but the weather would not change during<br />
the year.<br />
Tilt the Earth as you carry the globe around<br />
the Sun again, showing how the entire North Polar<br />
region is bathed in sunlight during the Northern<br />
Hemisphere summer, and how it is in total darkness<br />
during the Southern Hemisphere summer. Allow<br />
students to take turns demonstrating this so they<br />
can see it several times.<br />
Page 53<br />
This is a good activity for small teams <strong>of</strong> 3-4<br />
students. Have them read page 53, study the graphs,<br />
and answer the questions on that page. Different<br />
interpretations are possible. One is that the increase<br />
in carbon dioxide has caused global warming—the<br />
increased temperature <strong>of</strong> about .3°C to .6°C in the<br />
past 130 years. Another is that the increase in the<br />
Earth’s temperature is part <strong>of</strong> a natural trend, and<br />
the increase in carbon dioxide is not yet enough<br />
to cause the increase <strong>of</strong> temperature. In previous<br />
chapters the IPCC said the relationship between<br />
carbon dioxide increase and global temperature was<br />
likely, but they were careful not to say that these<br />
conclusions are definite. (Unfortunately, certainty<br />
is rarely possible in science.)<br />
Pages 54–55<br />
With pages 54–55, students can compare photo<br />
<strong>of</strong> San Francisco and the beginning and end <strong>of</strong> the<br />
20th century.<br />
If it is possible to locate photographs <strong>of</strong> your<br />
community 100 years ago, it is likely that students<br />
will see evidence <strong>of</strong> changes that have increased<br />
the addition <strong>of</strong> carbon dioxide to the air from the<br />
burning <strong>of</strong> fossil fuels. Means <strong>of</strong> transportation have<br />
changed, the population increased so that even more<br />
fuel is burned, vegetation may have been cut back<br />
so that less carbon dioxide is absorbed, and so on.<br />
Teachers have had great success by having<br />
students interview parents and grandparents for<br />
evidence <strong>of</strong> change in life-style, and then writing<br />
about what they found out. It is okay if these<br />
discussions and papers reflect general changes in the<br />
environment and ways <strong>of</strong> living, rather than narrowly<br />
focusing the students’ attention on activities which<br />
increase greenhouse gases.<br />
Global Systems <strong>Science</strong> <strong>Climate</strong> <strong>Change</strong> Teacher’s <strong>Guide</strong> 39
Chapter 7. What Are the<br />
Greenhouse Gases?<br />
Pages 56–63<br />
These pages provide an overview <strong>of</strong> the composition <strong>of</strong> the atmosphere,<br />
and put the various gases discussed so far into perspective.<br />
The alternative theories on page 57 illustrate two different feedback<br />
effects involving water vapor. If the students have used feedback diagrams in<br />
the volume GSS A New World View, have them fill in blank diagrams to illustrate<br />
these effects. These diagrams can be done in a number <strong>of</strong> different ways.<br />
Following is one interpretation.<br />
less<br />
sunlight<br />
more<br />
clouds<br />
more<br />
evaporation<br />
higher<br />
temp<br />
lower<br />
temperature<br />
less<br />
evaporation<br />
fewer<br />
clouds<br />
more<br />
sunlight<br />
Example <strong>of</strong> Positive<br />
Feedback<br />
Theory B. Increased<br />
temperature leads to more<br />
water vapor in the atmosphere.<br />
Water vapor is a greenhouse<br />
gas so it will increase global<br />
warming.<br />
Example <strong>of</strong> Negative<br />
Feedback<br />
Theory A. Increased temperature<br />
leads to more clouds which shade the<br />
Earth and decrease global warming.<br />
warming continues<br />
increased greenhouse<br />
more water vapor<br />
further warming<br />
increased<br />
greenhouse gases<br />
more water vapor<br />
increased temperature<br />
40 Global Systems <strong>Science</strong> <strong>Climate</strong> <strong>Change</strong> Teacher’s <strong>Guide</strong>
If this is a good time to further explore the concept <strong>of</strong> feedback with your<br />
students, you may want to do the activity outlined in the next few pages which<br />
illustrates a positive feedback effect that may increase global warming.<br />
Page 61<br />
Page 61 deals with a common misconception that “the hole in the ozone<br />
layer causes global warming.” Although the thinning <strong>of</strong> ozone gas in the upper<br />
atmosphere does contribute a small amount <strong>of</strong> additional radiation, it is in the<br />
ultraviolet range, and not the infrared range that causes most <strong>of</strong> the warming.<br />
This point is further complicated by the fact that ozone is a greenhouse gas<br />
and an air pollutant in the lower atmosphere. It is probably easiest to deal with<br />
this by suggesting that your students think <strong>of</strong> ozone in the same way they think<br />
<strong>of</strong> carbon dioxide. It is a greenhouse gas that appears in the lower atmosphere.<br />
Ozone in the stratosphere is the same kind <strong>of</strong> gas, but it is not significantly related<br />
to the global warming problem.<br />
Pages 62–63<br />
These pages provide a summary <strong>of</strong> all the greenhouse gases and the human<br />
activities that have increased their concentration in the atmosphere during the<br />
past 130 years.<br />
It is important that students recognize both the positive and negative<br />
aspects <strong>of</strong> the activities that lead to increased levels <strong>of</strong> greenhouse gases in the<br />
atmosphere, and the difficulty <strong>of</strong> changing these activities without increasing<br />
unemployment and poverty. You might ask the students to write two paragraphs<br />
about each <strong>of</strong> the activities listed on page 63; one describing the value that<br />
activity has had for improving the quality <strong>of</strong> human life, and the other describing<br />
how the activity might be modified so as to slow the increase <strong>of</strong> greenhouse<br />
gases.<br />
Global Systems <strong>Science</strong> <strong>Climate</strong> <strong>Change</strong> Teacher’s <strong>Guide</strong> 41
Investigation<br />
Will Melting Ice Caps Increase Global Warming?<br />
by Terry Jimarez-Leyva, Coronado High School, El Paso, TX<br />
Fernando Salvador, City As School High School, New York, NY<br />
and John Clarke, Tewksbury High School, Tewksbury, MA<br />
Inspired by an activity in Hot Water and Warm Homes from Sunlight, a<br />
Teacher’s <strong>Guide</strong> from Great Explorations in Math and <strong>Science</strong> (GEMS), <strong>Lawrence</strong><br />
<strong>Hall</strong> <strong>of</strong> <strong>Science</strong>, University <strong>of</strong> California, Berkeley, CA 94720-5200.<br />
Overview<br />
In this activity, your students will test one aspect <strong>of</strong> a theory that reduction<br />
in the polar caps will speed global warming. They simulate a polar region with<br />
pans <strong>of</strong> water—one painted white to represent a glacier, and one painted black<br />
or blue to represent the same area after the ice has melted. They place the<br />
covered pans in the sun with water in the bottom, and measuring and compare the<br />
temperature <strong>of</strong> the water in the two pans over about 30 minutes. The results are<br />
almost always startling in the degree <strong>of</strong> difference between the two surfaces.<br />
Background<br />
The Sun is the main source <strong>of</strong> energy for the<br />
Earth. However, about 25% <strong>of</strong> the Sun’s energy<br />
that reaches Earth is reflected back into space by<br />
clouds. The rest passes to the Earth’s surface where<br />
about 5% is reflected back. On average, 70% <strong>of</strong><br />
the Sun’s energy is absorbed the land, oceans, and<br />
atmosphere, and keeps our planet warm. However,<br />
the amount reflected back to space varies from<br />
place to place, ranging from almost zero in dark,<br />
forested regions, to more than 90% over the white<br />
polar regions.<br />
It is possible that a positive feedback effect<br />
involving the polar caps may enhance the effect<br />
<strong>of</strong> global warming by decreasing the 5% <strong>of</strong> the<br />
Sun’s energy that is reflected back to space from<br />
the Earth’s surface. According to this theory, if<br />
an increased greenhouse effects warms the Earth<br />
enough to melt a substantial portion <strong>of</strong> the planet’s<br />
ice caps, there will be less white snow to reflect<br />
solar energy. The Earth will absorb more energy<br />
from the Sun, and will warm even more. This, in turn<br />
will cause more <strong>of</strong> the ice caps to melt, so the Earth<br />
will absorb even more solar energy. The positive<br />
feedback effect will increase until the Earth reaches<br />
a new equilibrium temperature, possibly as hot as it<br />
was during the Cretaceous period, when there were<br />
virtually no permanent glaciers at the poles, and<br />
most <strong>of</strong> the planet had a tropical climate.<br />
NASA and the British Meteorological Service<br />
have both been monitoring glaciers at the North<br />
and South Pole, and both have reported that<br />
Antarctic ice packs are beginning to break up. It is<br />
still too early to determine if this is caused by the<br />
greenhouse effect. Also the difference is probably<br />
insufficient at this point for a positive feedback<br />
effect to kick in.<br />
Research Question<br />
In this experiment, your students will test one<br />
aspect <strong>of</strong> the “ice cap feedback hypothesis.”<br />
How much warmer will a region become if the<br />
ice has melted, and the surface has turned from<br />
white to dark?<br />
Possible Objective<br />
Depending on the specific assignment you give<br />
them, your students can improve their abilities<br />
to accomplish the following tasks:<br />
• Conduct an experiment to answer a research<br />
question.<br />
42 Global Systems <strong>Science</strong> <strong>Climate</strong> <strong>Change</strong> Teacher’s <strong>Guide</strong>
• Create a table and graph <strong>of</strong> the data.<br />
• Interpret their findings in terms <strong>of</strong> the research question.<br />
• Show how the flow <strong>of</strong> energy explains the result by drawing a diagram.<br />
• Explain how their findings relate to the positive feedback theory.<br />
• Discuss how human activities (such as the burning <strong>of</strong> fossil fuels), interact with Earth systems<br />
(such as the Earth’s absorption <strong>of</strong> solar energy).<br />
Materials for each lab group<br />
• 2 painted foil pie pans, one painted black the other white<br />
• 2 thermometers<br />
• 2 large locking plastic bags<br />
• 1 cup, beaker, or graduated cylinder for measuring water<br />
• 1 or 2 sheets <strong>of</strong> lined paper and pencil<br />
• 1 sheet <strong>of</strong> graph paper; pencils or pens <strong>of</strong> two colors<br />
• 1 watch with a second hand<br />
Procedure<br />
1. Divide the class into teams <strong>of</strong> 3-4 students.<br />
2. Demonstrate the procedure:<br />
a. Put the same amount <strong>of</strong> water in each pan (about 200 ml, enough to cover the bottom).<br />
b. Put a thermometer into the water so it can<br />
be easily viewed.<br />
c. Carefully slip a plastic bag around each pie<br />
pan and zip it closed.<br />
d. Record the initial temperature in each<br />
pan.<br />
4. Answer questions about the procedure, then have<br />
the students pick up their materials and begin.<br />
When they are finished, they can return to the<br />
e. Expose both trays to the same level <strong>of</strong><br />
sunlight for 20-30 minutes.<br />
classroom to graph the data.<br />
f. Record the temperature <strong>of</strong> each pan in a<br />
table once per minute.<br />
Conducting the Activity<br />
2. Discuss calibration <strong>of</strong> the thermometers. At<br />
the beginning <strong>of</strong> the experiment, all <strong>of</strong> the<br />
thermometers should read the same, because we<br />
know the temperature <strong>of</strong> the water in the room<br />
• Paint the pans at least a day before. Black and<br />
white spray paint is quick and easy and adheres<br />
very well to the aluminum pie pans.<br />
is the same. If they do not read the same, they • If at all possible, do the activity on a bright, sunny<br />
must be calibrated by adding a certain number day. It is also possible to do it in the classroom<br />
<strong>of</strong> degrees (usually just one or two degrees) to with bright lamps, but if so it is important to<br />
the one that reads lower. Tell the students that illuminate the pairs <strong>of</strong> pans equally.<br />
when they record the temperature in the two<br />
pans, they should always add that same amount<br />
to the thermometer that has the initial lower<br />
reading.<br />
• If the inside <strong>of</strong> the plastic bags fog up, students<br />
may have difficulty reading the temperature.<br />
The bags should be kept closed so the water<br />
does not cool <strong>of</strong>f. While it is instructive to plot<br />
3. You may want to suggest that one student be the entire warming curve, the initial and final<br />
in charge <strong>of</strong> reaching the temperature in each temperatures are most important, so it is okay<br />
pan, and one student be in charge <strong>of</strong> recording if they miss a few data points because <strong>of</strong> the<br />
the results.<br />
fogging <strong>of</strong> the plastic.<br />
Global Systems <strong>Science</strong> <strong>Climate</strong> <strong>Change</strong> Teacher’s <strong>Guide</strong> 43
Questions to guide the analysis and<br />
discussion<br />
• Which <strong>of</strong> the two surfaces absorbed more energy from the sun? The light or<br />
dark surface? How much was the difference in temperature?<br />
• Draw a diagram explaining the result by showing what happened to the<br />
sunlight in the two pans.<br />
• Do your results support or refute the positive feedback theory? Why?<br />
Going Further<br />
• Apply these results to other areas. Is it best to wear dark or light clothes in<br />
the winter? Summer? Should houses in cold northern regions be painted<br />
with dark or light colors? How about homes in tropical regions?<br />
• Over a series <strong>of</strong> lab activities, students can learn to use the “V heuristic” to<br />
summarize their lab reports on a page. Initially, you may want to fill out<br />
all but the “Results” and “Conclusions” sections. During subsequent lab<br />
activities you can give them a sheet that has less and less filled out, until<br />
they are able to fill in the entire sheet for a lab activity. A copy <strong>of</strong> the “V<br />
Heuristic” for this experiment, with all but the Results and Conclusions filled<br />
out is attached.<br />
References<br />
“Do Clouds Provide a Greenhouse Thermostat?” <strong>Science</strong> News, vol. 142, No. 5,<br />
August 1, 1992.<br />
“Greenhouse Snow: Melting Preconceptions,” <strong>Science</strong> News, vol. 140, No. 7,<br />
August 24, 1991.<br />
“Global Warming,” Earth Magazine, vol. 4, no. 3, June, 1995.<br />
Miller, Tyler, Living in the Environment, Wadsworth Publishing Co., Belmont,<br />
CA .<br />
Stern, P., Young, O., and Druckman, D., Global Environmental <strong>Change</strong>, National<br />
Academy Press, Washington, D.C., 1992.<br />
44 Global Systems <strong>Science</strong> <strong>Climate</strong> <strong>Change</strong> Teacher’s <strong>Guide</strong>
Calculation<br />
How Much CO 2 from a Gallon <strong>of</strong> Gas?<br />
by Eloise Farmer, Torrington High School, Torrington, CT<br />
Inspired by an activity from the Teacher’s Pet Project, Zero Population Growth,<br />
Incorporated<br />
This activity is designed to help students discover how much carbon<br />
dioxide their family contributes to the atmosphere.<br />
According to page 58 <strong>of</strong> <strong>Climate</strong> <strong>Change</strong>, “Just one gallon <strong>of</strong> gasoline<br />
burned in a car’s engine adds about 10 kilograms <strong>of</strong> carbon in the form <strong>of</strong><br />
carbon dioxide to the atmosphere.” As your students will find by following<br />
the instructions on the next page, this is close, but not completely<br />
accurate.<br />
Your students can calculate precisely how much carbon dioxide is in<br />
a gallon <strong>of</strong> gasoline by following the instructions on the next page.<br />
Answer Key for “How Much Carbon Dioxide in a Gallon <strong>of</strong> Gasoline?”<br />
1. 12 amu<br />
2. 6 atoms<br />
3. 96 amu<br />
4. 1 amu<br />
5. 18 atoms<br />
6. 18 amu<br />
7. 114 amu<br />
8. 1 atom<br />
9. 12 amu<br />
10. 2 atoms<br />
11. 16 amu<br />
12. 44 amu<br />
13. 114 grams<br />
14. 44 grams<br />
15. 24.6 moles<br />
16. 196 moles<br />
17. 8,645 grams<br />
18. 8.645 kilograms<br />
Global Systems <strong>Science</strong> <strong>Climate</strong> <strong>Change</strong> Teacher’s <strong>Guide</strong> 45
Name_______________________ Date_____<br />
How Much Carbon Dioxide from a Gallon <strong>of</strong> Gas?<br />
How much carbon dioxide does your family put into the air every year just by driving the car? You can find out<br />
from the Periodic Table <strong>of</strong> the Elements, and the following equation.<br />
2C 8 H 18 + 25 O 2 ——>18H 2 0 + 16 CO 2<br />
The equation shows that for every molecule <strong>of</strong> octane burned, 8 molecules <strong>of</strong> carbon dioxide are formed. How<br />
much mass is this? Start by finding the weight <strong>of</strong> atoms by using the Periodic Table <strong>of</strong> Elements, then use that<br />
information to calculate the weight <strong>of</strong> the octane molecule and the carbon dioxide molecule.<br />
1. The weight <strong>of</strong> a carbon atom is amu.<br />
2. The number <strong>of</strong> carbon atoms in octane is atoms.<br />
3. Therefore, the total weight <strong>of</strong> carbon in octane is amu.<br />
4. The weight <strong>of</strong> a hydrogen atom is amu.<br />
5. The number <strong>of</strong> hydrogen atoms in octane is atoms.<br />
6. The total weight <strong>of</strong> hydrogen in octane is amu.<br />
7. The total weight <strong>of</strong> the octane molecule is amu.<br />
8. The number <strong>of</strong> carbon atoms in carbon dioxide is atoms.<br />
9. The weight <strong>of</strong> each carbon atom is amu.<br />
10. The number <strong>of</strong> oxygen atoms in carbon dioxide is atoms.<br />
11. The weight <strong>of</strong> each oxygen atom is amu.<br />
12. The total weight <strong>of</strong> a carbon dioxide molecule is amu.<br />
A mole (short for gram molecular weight) is a certain number <strong>of</strong> molecules that has a mass in grams equivalent to<br />
the weight <strong>of</strong> a single molecule in amus. For example, since the molecular weight <strong>of</strong> water is 18 amu, we can weigh<br />
out 18 grams <strong>of</strong> water and have one mole <strong>of</strong> water.<br />
13. How much does a mole <strong>of</strong> octane weigh? grams.<br />
14. How much does a mole <strong>of</strong> carbon dioxide weigh? grams.<br />
15. One gallon <strong>of</strong> gasoline weights 2800 grams. How many moles is that? moles.<br />
16. Since 8 moles <strong>of</strong> carbon dioxide are produced for each mole <strong>of</strong> octane burned, how many moles <strong>of</strong> carbon dioxide<br />
are produced from a gallon <strong>of</strong> gasoline? moles.<br />
17. How many grams does that number <strong>of</strong> moles weigh? grams.<br />
18. How many kg <strong>of</strong> carbon dioxide are produced by a gallon <strong>of</strong> gasoline? kg.<br />
Check the annual mileage that your family car is driven. Assuming that your car averages 28 miles per gallon <strong>of</strong> gas,<br />
how many kg <strong>of</strong> carbon dioxide does your family driving add to the atmosphere every year?_______kg<br />
There are more than 200,000,000 cars in the world. If they are driven as much as your family’s car, how much carbon<br />
dioxide do these cars add to the atmosphere each year?______________________kg<br />
46 Global Systems <strong>Science</strong> <strong>Climate</strong> <strong>Change</strong> Teacher’s <strong>Guide</strong>
Investigation<br />
A Challenge for Teachers:<br />
Heat Absorption by Greenhouse<br />
It occurred to several groups <strong>of</strong> teachers at the Global Systems <strong>Science</strong><br />
institutes that an especially valuable experience would be for students to measure<br />
heat absorption by greenhouse gases. The idea was certainly promising. Scientists<br />
at Mauna Loa Observatory used a heat absorption method to accurately measure<br />
the concentration <strong>of</strong> carbon dioxide gas at a concentration <strong>of</strong> just .035%. Surely,<br />
a pure sample left in sunlight would heat faster than a sample <strong>of</strong> air! This plan<br />
was supported by a published activity in which students measured heat absorption<br />
by water vapor, a greenhouse gas.<br />
Unfortunately, all <strong>of</strong> the efforts by GSS staff and teacher participants have<br />
failed (so far) to develop a procedure, using laboratory equipment that is easily<br />
available, that will enable students to measure the differential absorption <strong>of</strong> heat<br />
energy by air and pure samples <strong>of</strong> greenhouse gases. While the results seemed<br />
reasonable in most <strong>of</strong> the pilot experiments, the class data only turned up random<br />
differences in the temperatures <strong>of</strong> the various samples. This was even the case<br />
when we tested the published activity.<br />
We have speculated on several reasons why it may be difficult to find<br />
consistent differences among the samples. Perhaps the gas samples were too<br />
small to absorb enough energy so that we could measure a difference. Perhaps<br />
heat was lost through the walls <strong>of</strong> the containers. Perhaps our methods <strong>of</strong><br />
measurement were not sensitive enough. We won’t know for sure, until we find<br />
a method that works!<br />
We still believe that there’s a simple answer out there, somewhere, and<br />
we invite you to join in the search! To get you started, we’d like to share the<br />
excellent work done by the high school teachers at the GSS institutes, so that<br />
you can benefit from their experience. If you develop a method that seems to<br />
show consistent differences when the experiment is done by an entire class <strong>of</strong><br />
students, please tell us how to do it!<br />
Global Systems <strong>Science</strong> <strong>Climate</strong> <strong>Change</strong> Teacher’s <strong>Guide</strong> 47
Atmospheric Composition and <strong>Climate</strong> <strong>Change</strong><br />
by Pat Owens, Homewood High School,<br />
Birmingham, Alabama<br />
and Alan Sills, West Essex Regional High School,<br />
North Caldwell, New Jersey<br />
This experiment involves lab teams in comparing a sample <strong>of</strong> room air with one <strong>of</strong> the<br />
greenhouse gases, either carbon dioxide, nitrous oxide, or methane. The question posed<br />
to students was: What changes in the temperature <strong>of</strong> the gases do you expect when the<br />
light is shining on each sample? Will each sample absorb the same amount <strong>of</strong> heat? Will<br />
each sample cool equally after the light is removed? Record your hypotheses now.<br />
Materials for each lab team<br />
1 250 watt heat lamp (emits IR radiation)<br />
2 2-liter soda pop bottles (they must be clear and<br />
colorless, with the labels removed, think about<br />
why this is important)<br />
2 #4 one hole rubber stoppers<br />
1 apparatus to set the bulb over the bottles: this<br />
may include support stands, clamps, a cross bar<br />
and a clamp for the bulb.<br />
1 stop watch<br />
Procedure<br />
1. Compare air vs. air. Set up two soda bottles with<br />
stoppers and thermometers. Set these in bright<br />
sunlight for 20 minutes. Record and graph the<br />
temperature change in each bottle. Discuss the<br />
heating and cooling curves, and the concept <strong>of</strong><br />
equilibrium temperature. Discuss the accuracy<br />
<strong>of</strong> the two thermometers and the sensitivity <strong>of</strong><br />
the system.<br />
2. Compare air vs. a pure sample <strong>of</strong> greenhouse<br />
gas. All three gases are available in tanks from<br />
vendors <strong>of</strong> compressed gasses. (Check the Yellow<br />
Pages.) Nitrous oxide can also be obtained from<br />
dental supply stores. (It is sometimes called<br />
“laughing gas” and is used by dentists as a mild<br />
anesthetic.) Carbon dioxide can be generated by<br />
mixing vinegar and baking soda, or by allowing<br />
a piece <strong>of</strong> dry ice to sublime. Methane is <strong>of</strong>ten<br />
used for gas jets in a chemistry lab.<br />
1 lump <strong>of</strong> modeling clay or some other material to<br />
“stop” a hole in the plastic bottles<br />
2 mercury thermometers (be sure to check for<br />
consistent readings between the two) or,<br />
preferably, a microcomputer based laboratory<br />
interface with two temperature probes.<br />
• soapy water or glycerine for inserting<br />
thermometers into rubber stoppers<br />
3. Do not discuss the expected results before<br />
conducting the activity. Ask the students to<br />
summarize their data, comparing the results <strong>of</strong><br />
different groups who may have tested different<br />
gases. Encourage the students to generalize.<br />
What might occur if there were more <strong>of</strong> the<br />
greenhouse gases in the atmosphere.<br />
References<br />
Activities for the Changing Earth System (ACES),<br />
1993, “How do Greenhouse Gases Affect Heat<br />
Absorption?”<br />
Ward’s Natural <strong>Science</strong> Establishment, Inc, Rochester,<br />
NY; Wards Bulletin 1989; Global Warming<br />
48 Global Systems <strong>Science</strong> <strong>Climate</strong> <strong>Change</strong> Teacher’s <strong>Guide</strong>
A Comparative Study <strong>of</strong> Common<br />
Atmospheric Gases<br />
by Ellen Strother-Pitts,<br />
Western Senior High School, Baltimore, MD<br />
This laboratory investigation could be used to stimulate discussion in answer to a<br />
variety <strong>of</strong> questions, such as: What would happen to the temperature <strong>of</strong> our planet<br />
if the atmosphere consisted <strong>of</strong> 100% <strong>of</strong> each <strong>of</strong> the gases used in the experiment?<br />
What adaptations would humans have to make to survive in such an atmosphere<br />
(both mutationally and artificially)?<br />
Materials for each lab team<br />
Same materials above with the addition <strong>of</strong> silica gel (or other drying agent)<br />
Procedure<br />
1. Humid air sample. Create a sample <strong>of</strong> humid air by pouring enough water into<br />
the bottle to cover the bottom. Put on the stopper with thermometer inserted.<br />
Allow the bottle to stand overnight so the air becomes saturated with water<br />
vapor. It is then at 100% humidity.<br />
2. Dry air sample. Cover the bottom <strong>of</strong> a clean dry bottle with silica gel and cap<br />
the bottle tightly.<br />
3. Other greenhouse gas samples—carbon dioxide, methane, or nitrous oxide—may<br />
be prepared as described above and compared with the samples <strong>of</strong> humid and<br />
dry air.<br />
4. Record the temperature in each bottle every two<br />
minutes until the temperature stops changing.<br />
Make a temperature vs. time graph, showing the<br />
results for each bottle in a different color. Answer<br />
the following questions:<br />
• Which gas absorbed energy the fastest?<br />
• Which gas retained heat the longest?<br />
• How do these results help you to answer the<br />
questions above?<br />
Global Systems <strong>Science</strong> <strong>Climate</strong> <strong>Change</strong> Teacher’s <strong>Guide</strong> 49
Measuring the Heat Capacity <strong>of</strong><br />
Greenhouse Gases<br />
by Hector Montano, Canutillo High School, Canutillo, TX<br />
More advanced students can do a similar experiment, with two additions:<br />
1) use <strong>of</strong> more sophisticated laboratory equipment; and 2) calculating heat<br />
capacity <strong>of</strong> the various gases.<br />
Materials<br />
4 Centigrade thermometers<br />
3 volumetric flasks <strong>of</strong> 1 liter<br />
3 1 hole rubber stoppers<br />
1 infrared heat lamp with clamp<br />
1 CO gas cylinder with regulator<br />
CH4 gas (lab table gas jets will do)<br />
2 feet rubber tubing<br />
Safety Notes:The 1 liter volumetric glass flasks are very thin and should be handled<br />
with extreme care. Also, methane is flammable so any flames or sparks could<br />
ignite it causing a fire or burn to the student. Insert thermometers for the<br />
students as they can break easily and cause injury. High pressure gas cylinders<br />
can be dangerous if they tip over. Place the carbon dioxide cylinder on the<br />
floor, and tie it to the table leg.<br />
Procedure<br />
1. Make sure the volumetric flasks are clean and<br />
thoroughly dry. Label each flask: CO , CH , and<br />
2 4<br />
H O. Dampen each thermometer with glycerine<br />
2<br />
and drive it through the rubber stopper so that<br />
2 inches are sticking out being ever careful not<br />
to break the thermometer.<br />
2. Fill each flask as follows:<br />
a. H O: Pour 5 ml <strong>of</strong> water into a flask and<br />
2<br />
place it underneath the heat lamp until<br />
moisture appears on the neck near the<br />
opening. Incline the flask so that air will<br />
not displace H2O vapor , which tends to<br />
rise. When this occurs, immediately insert<br />
the thermometer-rubber stopper assembly<br />
onto the flask.<br />
b. CO : Connect one end <strong>of</strong> the rubber tubing<br />
2<br />
to the regulator <strong>of</strong> the CO gas cylinder and<br />
2<br />
insert the opposite end <strong>of</strong> the tube into the<br />
volumetric flask. Keep the flask is upright<br />
as CO is denser than air. Turn the regulator<br />
2<br />
valve so the gas flows for about 20 seconds,<br />
then immediately place the thermometerrubber<br />
stopper assembly onto the mouth<br />
<strong>of</strong> the flask.<br />
c. CH : Connect the rubber tubing to the lab<br />
4<br />
table gas jet in order to collect a sample<br />
<strong>of</strong> methane. Fill for 30 seconds with the<br />
flask inverted as CH is less dense than air.<br />
4<br />
Immediately insert the thermometer-rubber<br />
stopper assembly and have a classmate close<br />
the gas jet valve.<br />
3. Take the temperature <strong>of</strong> each flask before<br />
starting. Record in the table next to Start.<br />
4. Expose the 3 flasks to an infrared light source<br />
and start taking readings. Take care that the 3<br />
volumetric flasks are getting the same amount<br />
<strong>of</strong> light. The lamp should be 4 inches from the<br />
top <strong>of</strong> the thermometers. Take a temperature<br />
reading every minute for ten minutes.<br />
5. Graph the temperature versus time on the graph.<br />
Plot your data for all 3 gases on the same graph.<br />
Draw a smooth line or curve for each gas and<br />
label each curve.<br />
50 Global Systems <strong>Science</strong> <strong>Climate</strong> <strong>Change</strong> Teacher’s <strong>Guide</strong>
Data Analysis<br />
1. Calculate Δ T (change in temperature) for each gas.<br />
2. Calculate the heat absorbed by each gas in calories. The specific heat for each gas is as follows:<br />
CO - 8.9 calories / mole °C<br />
2<br />
CH 4 - 8.4 calories / mole °C<br />
H 2 O - 7.2 calories / mole °C<br />
a. Step 1 - Calculate the calories, per gram °C <strong>of</strong> each gas<br />
calories/gram°C X mole /weight <strong>of</strong> gas = calories /gram °C<br />
b. Step 2 - Calculate the calories per gram <strong>of</strong> each gas.<br />
calories / gram °C X Δ temp = calories / gram<br />
c. Step 3 - Calculate the weight <strong>of</strong> 1 liter <strong>of</strong> each gas<br />
1 mole / mole weight X 22.4 liters / mole = liters / gram<br />
d. Step 4 - Calculate the calories in one liter <strong>of</strong> each gas:<br />
grams / 1 liter X calories / gram °C = calories / liter<br />
3. Answer the following questions about your results.<br />
a. Which temperature rose more slowly?<br />
b. Which gas absorbed the greatest amount <strong>of</strong> energy?<br />
c. How is the concept <strong>of</strong> heat capacity related to the greenhouse effect?<br />
d. What do the results <strong>of</strong> your experiment reveal about which are the most effective greenhouse<br />
gases?<br />
Global Systems <strong>Science</strong> <strong>Climate</strong> <strong>Change</strong> Teacher’s <strong>Guide</strong> 51
Chapter 8. What Are<br />
Governments Doing About<br />
Global Warming?<br />
Pages 64–73<br />
Included in this chapter are excerpts from a Congressional hearing on<br />
President Clinton’s plan to reduce the U.S. Contribution to global warming.<br />
The dialogue lends itself to a dramatic presentation rather than just having the<br />
students read the material on their own. Assign roles and have the students<br />
read the various parts with feeling. If you like, they can dress up for the<br />
presentations, and the room can be arranged as in a committee hearing, with<br />
an elevated table for the members <strong>of</strong> Congress, and a lower table facing them<br />
for the witnesses.<br />
For more advanced groups, you may want to get the entire 145-page<br />
transcript <strong>of</strong> the hearing from a library or the U.S. Government Printing Office,<br />
for students to dramatize. (Refer to the title on page 65 for a complete<br />
reference.) In addition to the dialogue are prepared papers by all <strong>of</strong> the<br />
witnesses. Groups <strong>of</strong> students could be assigned to read these and report to<br />
the class.<br />
The excerpts were selected for several reasons. In addition to providing<br />
information on the President’s Action Plan, they also deal with common<br />
misconceptions. For example, the question asked by Congressman Minge<br />
provides a wonderful opportunity for Dr. Mahlman to clarify the theory that we<br />
are headed for another ice age. (As he says, we are headed for another ice age,<br />
but that is thousands <strong>of</strong> years in the future. Global cooling due to the Earth’s<br />
slowly changing orbit will not help us in the next couple <strong>of</strong> centuries.)<br />
Questions 8.1, 8.2, and 8.3 are designed to help the students think further<br />
about the hearing. Alternatively—or in addition—you may want to have a class<br />
discussion so students can express their reactions to the chapter. A good focus<br />
for the discussion is the information provided on page 67, which shows that all <strong>of</strong><br />
our nation’s best efforts to reduce the emission <strong>of</strong> greenhouse gases undertaken<br />
so far are being swamped because <strong>of</strong> the changing tastes <strong>of</strong> American auto<br />
consumers. Most <strong>of</strong> these people are probably unaware <strong>of</strong> how their choice<br />
<strong>of</strong> a new car, or their decision to take a summer camping trip may affect the<br />
future climate <strong>of</strong> the Earth. What do the students think about this? Should<br />
anything be done? If so, what?<br />
52 Global Systems <strong>Science</strong> <strong>Climate</strong> <strong>Change</strong> Teacher’s <strong>Guide</strong>
Chapter 9. What Do You Think<br />
About Global <strong>Climate</strong> <strong>Change</strong>?<br />
Pages 74–80<br />
You might want to break the class into groups <strong>of</strong> 3-4 students to read over<br />
the next few sections, answer questions 9.1-9.6 and come to consensus about<br />
the level <strong>of</strong> action they think is necessary, on a scale <strong>of</strong> 1 to 5. You may also<br />
want to make the assignment more involved, asking each group to propose<br />
a set <strong>of</strong> actions that they think should be taken that is consistent with their<br />
position about the possibility <strong>of</strong> global warming.<br />
If possible, permit the entire class to discuss questions such as the<br />
following:<br />
1) Are one or more <strong>of</strong> the plans presented acceptable to everyone?<br />
2) If not, could different parts <strong>of</strong> the plans be put together so it could be<br />
enacted by the entire “Congress?”<br />
Page 80<br />
The Final Essay recognizes that individual thoughts and ideas may not<br />
have been expressed during the group discussions. The essay asks students to<br />
provide an informed personal opinion about the possibility <strong>of</strong> global warming.<br />
This might be considered a final project, and included in the students’ portfolios<br />
as part <strong>of</strong> their assessment; and as data in evaluating the effectiveness <strong>of</strong> the<br />
module on <strong>Climate</strong> <strong>Change</strong>.<br />
Page 81<br />
In this book we have adopted the Celsius scale, because it is the one<br />
preferred by scientists. The Celsius and Fahrenheit Temperature Scale on page<br />
98 shows students how to convert from one scale to the other.<br />
Pages 82-83<br />
The Selected Bibliography provides some <strong>of</strong> the books and articles that<br />
we found helpful in creating this Student <strong>Guide</strong>. (A complete list is include on<br />
the next few pages <strong>of</strong> this Teacher’s <strong>Guide</strong>.) Students who wish to do further<br />
research can read some <strong>of</strong> these selections.<br />
Global Systems <strong>Science</strong> <strong>Climate</strong> <strong>Change</strong> Teacher’s <strong>Guide</strong> 53
Resources for Teaching<br />
<strong>Climate</strong> <strong>Change</strong><br />
Television<br />
Infinite Voyage (Crisis in the Atmosphere).<br />
Watch for a rebroadcast <strong>of</strong> this PBS program<br />
which deals with connections between many<br />
GSS phenomena but focuses mainly on global<br />
warming. It shows evidence for the phenomena,<br />
current research, and <strong>of</strong>fers solutions. One 15<br />
minute segment deals with DR. Rosenfeld <strong>of</strong><br />
the University <strong>of</strong> California at Berkeley and his<br />
research on ways <strong>of</strong> conserving energy. It’s an<br />
excellent video.<br />
S<strong>of</strong>tware<br />
The Knowledge Tree, from the <strong>Climate</strong> Protection<br />
Institute, 5833 Balmoral Drive, Oakland, CA<br />
94619. This is a HyperCard stack (for Macintosh<br />
computers) which provides information about<br />
the Earth’s <strong>Climate</strong> System, showing the<br />
relationships among all <strong>of</strong> the different Earth<br />
systems and processes. The introductory<br />
screen shows the Earth with five main realms<br />
<strong>of</strong> information: Oceans, Atmosphere, Land<br />
Features, Cycles, and Energy Flow, and four<br />
or five topics related to each. All words on<br />
this page are active buttons that take students<br />
deeper into each topic. The s<strong>of</strong>tware comes on<br />
floppy disks for copying to your hard disk. (1996<br />
price is $15.00.)<br />
SimEarth, Maxis Corporation, Two Theatre Square,<br />
Orinda, CA 94563-3346, 510-254-9700. SimEarth<br />
is a computer simulation <strong>of</strong> the grand cycles<br />
which maintain a livable environment on Earth.<br />
The program tracks atmospheric gases, air and<br />
water temperatures, crustal movement, biomass<br />
and biodiversity, and many other indicators. It<br />
was released as a best selling game. Maxis now<br />
publishes a teachers manual to accompany it.<br />
The Environment, from Tom Snyder Productions,<br />
90 Sherman Street, Cambridge, MA 02140, (800)<br />
342-0236. This program comes with twentyeight<br />
student reference books that are packed<br />
with advisors’ facts and opinions about hundreds<br />
<strong>of</strong> actual case studies <strong>of</strong> environmental issues. A<br />
simulation <strong>of</strong> a town, and you’re the mayor.<br />
CD-ROM<br />
World Weather Disc, from CD-ROM Inc., Contains<br />
massive meteorological data base that describes<br />
the climate <strong>of</strong> the Earth today and during the past<br />
few hundred years. The disc includes many <strong>of</strong> the<br />
sought after meteorological data sets held in the<br />
archives <strong>of</strong> the National Climatic Data Center and<br />
the National Center for Atmospheric Research.<br />
The data sets <strong>of</strong>fer information on a wide variety<br />
<strong>of</strong> questions ranging from the nature <strong>of</strong> global<br />
temperature trends to inquires about the weather<br />
at specific locations around the world.<br />
Greenhouse Effect Detection Experiment, from<br />
Data Management Systems Center, Goddard Space<br />
Flight Center, Greenbelt, MD 20071, 301-286-9460;<br />
FAX: 301-286-3221. Data sets <strong>of</strong> atmospheric<br />
constituents, solar irradiances, Earth radiation,<br />
cloud data, and temperatures. IBM/compatible<br />
or Macintosh.<br />
Internet Addresses<br />
http://www.lhs.berkeley.edu/gss—GSS website<br />
http://www.ucar.edu/ National Center for Atmospheric<br />
Research (NCAR), Curriculum modules developed<br />
by teachers at NSF Institute.<br />
http://www.giss.nasa.gov/ NASA’s global information<br />
system, provides data on global climate change<br />
from Goddard Space <strong>Science</strong> Institute.<br />
http://www.cru.ura.ac.uk/ British Meteorological<br />
Office, University <strong>of</strong> East Anglia<br />
Print Material<br />
Biological Consequences <strong>of</strong> Global <strong>Climate</strong> <strong>Change</strong>,<br />
by Christine A. Ennis and Nancy H. Marcus, Global<br />
<strong>Change</strong> Instruction Program, NCAR Information<br />
and Outreach Program, P.O. Box 3000, Boulder,<br />
CO 80307-3000. This well-written monograph,<br />
suitable reading for teachers and high school<br />
students, shows how various life forms may be<br />
affected by changes in various aspects <strong>of</strong> climate,<br />
including global warming and ozone depletion.<br />
54 Global Systems <strong>Science</strong> <strong>Climate</strong> <strong>Change</strong> Teacher’s <strong>Guide</strong>
<strong>Climate</strong> System (The), National Center for Atmospheric Research (NCAR),<br />
Office for Interdisciplinary Earth Studies, PO Box 3000 Boulder, CO 80307-<br />
3000, 303-497-1682. Written for high school students. Great graphics and<br />
clear writing.<br />
<strong>Climate</strong> <strong>Change</strong>: The IPCC Scientific Assessment, Cambridge University Press,<br />
New York. This is THE “scientific consensus” about global warming and<br />
the greenhouse effect. It is full <strong>of</strong> all the details and figures you’ll ever<br />
want to know about climate change processes, effects, uncertainties,<br />
modelling, etc. Put together by a team <strong>of</strong> several hundred renowned<br />
scientists from around the world. A “Policymakers’ Summary” for this<br />
nicely summarizes the guts <strong>of</strong> the main volume extremely well. A new<br />
edition will be available in 1996.<br />
Environmental Data Report (United Nations Environment Programme, 1989),<br />
from Blackwell, Inc., Cambridge, MA. Graphs and data tables by continent<br />
and country for numerous trends in pollution, resources, population,<br />
health, energy, waste, transportation, and natural disasters.<br />
Global <strong>Change</strong> Education Technology Fact Sheets, School <strong>of</strong> Natural Resources,<br />
Ohio State University, 2021 C<strong>of</strong>fey Rd., Columbus, OH 43210, Attn: Dr.<br />
Rosanne W. Fortner, 614-292-2265; FAX: 614-292-7162. Produced jointly by<br />
the School <strong>of</strong> Natural Resources and the Department <strong>of</strong> Educational Studies<br />
at OSU. These sheets were used to find other resources in this guide.<br />
How to Build a Habitable Planet, by Wallace Broecker, Eldigio Press, LDGO<br />
Box 2, Palisades, NY 10964. An excellent book on the physical evolution <strong>of</strong><br />
the solar system and the Earth. Much about the chemical evolution <strong>of</strong> the<br />
Earth, including the carbon cycle. A few chapters on Earth’s temperature<br />
controls, water systems, resources for civilization, and the future <strong>of</strong> the<br />
Earth at the hands <strong>of</strong> humans. Broecker, from<br />
Columbia University, is one <strong>of</strong> the premier socalled<br />
Earth System scientists. He is a chemical<br />
oceanographer who works a lot with biologist,<br />
geologists, and climatologists.<br />
State <strong>of</strong> the World, 1995 (World Resources<br />
Institute), from World Resources Institute,<br />
Washington, DC. Annual summary <strong>of</strong> global<br />
trends in specific environmental issues. Some<br />
graphs, but mostly experts’ analyses <strong>of</strong> a wide<br />
body <strong>of</strong> research on the topics. Probably the<br />
most widely quoted source <strong>of</strong> information on<br />
environmental trends.<br />
Volcanism and <strong>Climate</strong> <strong>Change</strong>, American<br />
Geophysical Union, 2000 Florida Ave., NW,<br />
Washington, DC 20009. A nice, short volume<br />
that explains how volcanoes can control climate,<br />
with much <strong>of</strong> the focus on the recent Mt.<br />
Pinatubo eruptions in the Philippines. Cheap!<br />
Useful for discussion <strong>of</strong> energy, suspensions, and<br />
reactions in the atmosphere.<br />
World Resources. Copyright by World Resources<br />
Institute, Washington, D.C., published by<br />
Oxford University Press, New York. A report by<br />
the World Resources Institute in collaboration<br />
with the United Nations Environment Pragramme<br />
and United Nations Development Programme. A<br />
thorough look at conditions and trends in the world<br />
environment, health, economies, population, climate,<br />
and so on. Neatly summarizes issues and problems<br />
and provides copious amounts <strong>of</strong> data. Updated<br />
every two years, each edition with analysis <strong>of</strong> trends<br />
in certain issues as well as data tables to support the<br />
text. The 1990-1991 version had special section on<br />
<strong>Climate</strong> <strong>Change</strong>. A teachers guide is available. Not<br />
all environmental issues in every edition.<br />
Magazines and Newsletters<br />
<strong>Climate</strong> and Global <strong>Change</strong> Education Resource<br />
<strong>Guide</strong>, Office <strong>of</strong> Global <strong>Change</strong>, Graduate School <strong>of</strong><br />
Oceanography, University <strong>of</strong> Rhode Island. Selected<br />
Annotated Bibliography put out by the University <strong>of</strong><br />
Rhode Island.<br />
Earth Pulse, 100 East Francis, Aspen, Colorado<br />
81611-1424, (303)925-7376. K-12 Newsletter with<br />
educational articles and lab activities on global<br />
climate. Interdisciplinary activities based on current<br />
happenings.<br />
Global Systems <strong>Science</strong> <strong>Climate</strong> <strong>Change</strong> Teacher’s <strong>Guide</strong> 55
In Context, A Journal <strong>of</strong> Hope, Sustainability, and <strong>Change</strong>, PO Box 11470,<br />
Bainbridge Island, WA 98110. This quarterly magazine is the best<br />
optimistic view <strong>of</strong> the future I’ve seen. It has many articles by leaders<br />
in science politics, futures studies, history, economics, psychology and<br />
history. Each issue has statistics that lend themselves to debate and<br />
encourages creative/alternative thinking. This is a journal you will not<br />
want to lose. I constantly use it in ALL my classes grades 9-12.<br />
PLESE Note..., Ohio State Univ., College <strong>of</strong> Education and Natural<br />
Resources, 29 W. Woodruff Ave., Columbus, OH 43210, 614-292-7888.<br />
A newsletter for the Program for Leadership in Earth Systems Education,<br />
a project <strong>of</strong> Ohio State University’s College <strong>of</strong> Education and Natural<br />
Resources. A newsletter for a group that is trying to increase the<br />
teaching <strong>of</strong> Earth Systems <strong>Science</strong>.<br />
The Greenhouse Gassette, <strong>Climate</strong> Protection Institute, 5833 Balmoral<br />
Dr., Oakland, CA 94619. Newsletter which contains information and<br />
activities for high school teachers interested in teaching about global<br />
environmental change. Published and edited by former staff members<br />
<strong>of</strong> the GSS project, Richard Golden and Chris Harper.<br />
OMNI magazine (June, 1993 “Air Repair”). Nice article the wild ideas<br />
proposed to mitigate global warming and ozone depletion through<br />
technical, geoengineering methods. Some <strong>of</strong> them are crazy, others<br />
feasible.<br />
Network Newsletter, NCAR, Environmental and Societal Impacts Group<br />
(ESIG), PO Box 3000, Boulder, CO 80307. An information clearing house<br />
newsletter on climate-related impacts to earth system and earth’s<br />
inhabitants.<br />
Bibliographies<br />
Global Warming and the Greenhouse Effect,<br />
United States Department <strong>of</strong> Agriculture,<br />
National Agricultural Library, Beltsville, MD<br />
20705. Select bibliography put out by the<br />
Department <strong>of</strong> Agriculture.<br />
Educational Programs and Sets <strong>of</strong> Activities<br />
Activities for the Changing Earth System, 1993, by<br />
Rosanne W. Fortner and Victor J. Mayer, Project<br />
Directors, Earth Systems Education Program,<br />
Ohio State University, 59 West Woodruff Ave.,<br />
Columbus, OH 43210. Contains a variety <strong>of</strong><br />
activities concerning Earth systems and global<br />
environmental change.<br />
Global <strong>Change</strong>, from the U.S. Geological Survey,<br />
Department <strong>of</strong> the Interior. Call (800) USA-<br />
MAPS. This packet contains a large poster with<br />
several activities and a short teacher’s guide.<br />
Global <strong>Change</strong> Education Resource <strong>Guide</strong>, 1994,<br />
Lynn Mortensen, Editor, Office <strong>of</strong> Global Programs,<br />
National Oceanic and Atmospheric Administration,<br />
1100 Wayne Avenue, Suite 1225, Silver Spring,<br />
Maryland 20910. This is a compilation <strong>of</strong> activities<br />
from many different sources, related to: Natural<br />
<strong>Climate</strong> Variability, the Greenhouse Effect, Sea<br />
Level Rise, and other topics.<br />
The Greenhouse Effect: Global <strong>Climate</strong> <strong>Change</strong><br />
Curriculum Materials, Summer, 1990, <strong>Science</strong><br />
Education Center, <strong>Lawrence</strong> Livermore National<br />
Laboratory, P.O. Box 808, Livermore, CA 94550,<br />
(415) 422-1100. This resources provides a variety<br />
<strong>of</strong> activities for students in grades 7-10 about<br />
global warming and the greenhouse effect. It is<br />
recommended that the program be presented over<br />
a period <strong>of</strong> 17 days.<br />
56 Global Systems <strong>Science</strong> <strong>Climate</strong> <strong>Change</strong> Teacher’s <strong>Guide</strong>
Project ATMOSPHERE, from AMS-Project ATMOSPHERE, 1701 K St., NW,<br />
Suite 300, Washington, DC 20006-1509. This program deals with cloud<br />
formation, and the meaning and motion involved in cloud shapes. Gives<br />
a “hands-on” use by students investigating temperature, pressure, and<br />
cloud formation relationships. Activities involving water vapor and its<br />
formation and importance in cloud formation.<br />
Project LEARN, from Project LEARN Office, NCAR, P.O. Box 3000, Boulder,<br />
CO 80307, (303) 497-8107<br />
This program seeks to improve understanding <strong>of</strong> the atmospheric sciences<br />
and related mathematics and to improve science teaching methodology<br />
through experiential training.<br />
<strong>Science</strong> for Understanding Tomorrow’s World: Global <strong>Change</strong>, 1994,<br />
from the International Council <strong>of</strong> Scientific Unions, 51 Boulevard de<br />
Montmorency, 75016 Paris, France. This looseleaf guide for teachers<br />
contains activities for students in the age range 16-20 years old. Six<br />
units are included: The Changing Atmosphere; Clues from Our Past, The<br />
Global Carbon Cycle, Population and Land Use, Oceans, and Remote<br />
Sensing.<br />
Solar Physics and Terrestrial Effects: A Curriculum <strong>Guide</strong> for Teachers<br />
Grades 7-12, Space Environment Laboratory, National Oceanic and<br />
Atmospheric Administration, U.S. Government Printing Office 1993—<br />
574-133. This looseleaf notebook provides a variety <strong>of</strong> activities related<br />
to the Sun and its relationship to the Earth. Chapters include: 1. How<br />
the Sun Came to Be, 2. The Structure <strong>of</strong> the Sun, 3. Studying the Sun,<br />
and 4. Solar-Terrestrial Interactions.<br />
Global Systems <strong>Science</strong> <strong>Climate</strong> <strong>Change</strong> Teacher’s <strong>Guide</strong> 57
Bibliography for<br />
<strong>Climate</strong> <strong>Change</strong><br />
The following books and articles provided the information and<br />
perspectives on which <strong>Climate</strong> <strong>Change</strong> is based. We are grateful to the many<br />
authors and researches who have made these materials available.<br />
Adler, Jerry, with Hager, Mary, “Inside the Greenhouse: Heat Waves,” Newsweek,<br />
pp. 16-24, July 11, 1988.<br />
Aubrecht, Gordon J., “Trace Gases, CO 2 , <strong>Climate</strong> and the Greenhouse Effect,”<br />
The Physics Teacher, March, 1988.<br />
Beiswenger, Jane M., and Brewer, Carol A., “Predicting Biological Response to<br />
Global Warming: A Laboratory Activity to Promote Discussion,” The American<br />
Biology Teacher, Volume 55, No. 4, April, 1993.<br />
Berner, R.A. and Lasaga, A.C., “Modeling the Geochemical Carbon Cycle,” Scientific<br />
American, March, 1989.<br />
Boden, Thomas A, Sepanski, Robert J., and Stoss, Frederick W., Trends ‘91: A<br />
Compendium <strong>of</strong> Data on Global <strong>Change</strong>, Carbon Dioxide Information Analysis<br />
Center, Environmental <strong>Science</strong>s Division, Oak Ridge National Laboratory, Oak<br />
Ridge, Tennessee, 1992.<br />
Boden, Thomas A.,. Kanciruk, Paul, and Farrell, Michael P., Trends ‘90: A<br />
Compendium <strong>of</strong> Data on Global <strong>Change</strong>, Carbon Dioxide Information Analysis<br />
Center, Environmental <strong>Science</strong>s Division, Oak Ridge National Laboratory, Oak<br />
Ridge, Tennessee, 1991.<br />
Brewer, Carol A., and Briswenger, Jane M., “Carbon<br />
Dioxide and the Greenhouse Effect: A Problem<br />
Evaluation Activity, The American Biology<br />
Teacher, Volume 55, No. 4, April, 1993.<br />
Brown, Lester R., Building a Sustainable<br />
Society, W.W. Norton & Co.: New York,<br />
London, 1981.<br />
Brown, Lester R., State <strong>of</strong> the World, 1994, W.W.<br />
Norton & Co.: New York, London, 1994.<br />
Carr, Kate, Managing Editor, <strong>Science</strong> Activities Special<br />
Issue on “Understanding Global Atmosphere in the<br />
Classroom,” Vol. 29, No. 1, Spring, 1992.<br />
Clark, William C., Editor, Carbon Dioxide Review:<br />
1982, Clarenden Press: Oxford, Oxford University<br />
Press: Oxford, New York, 1982.<br />
<strong>Climate</strong> Institute, <strong>Climate</strong> Alert, Newsletter,<br />
Washington, D.C., 1991.<br />
<strong>Climate</strong> Protection Institute, Greenhouse Gassette,<br />
Quarterly Newsletter, Oakland, CA, 1988-1994.<br />
Committee on the Atmosphere and Biosphere,<br />
Board on Agriculture and Renewable Resources,<br />
Commission on Natural Resources, National<br />
Research Council, Atmosphere-Biosphere<br />
Interactions: Toward a Better Understanding<br />
<strong>of</strong> the Ecological Consequences <strong>of</strong> Fossil<br />
Fuel Combustion, National Academy Press:<br />
Washington, D.C., 1981.<br />
Copnservation Council <strong>of</strong> Victoria, “State Gives Up<br />
on the Greenhouse Challenge,” Environment<br />
Victoria, Issue 73, October, 1989.<br />
Davis, Gil, Greenhouse California, Golden State<br />
Report, ppl. 24-31, March, 1987.<br />
Earth Observing System, Program Office, EOS: A<br />
Mission to Planet Earth, National Aeronautics and<br />
Space Administration, Washington, D.C., 1990.<br />
Earth System <strong>Science</strong> Committee, NASA Advisory<br />
Council, Earth System <strong>Science</strong>: Overview,<br />
National Aeronautics and Space Administration,<br />
Washington, D.C., 1986.<br />
Ember, Lois R., Layman, Patricia, Lepkowski, Wil,<br />
Zurer, Pamela S., Tending the Global Commons,<br />
Chemical and Engineering News, pp. 14-64,<br />
November, 1986.<br />
GISP2 <strong>Science</strong> Management Office, Greenland<br />
Ice Sheet Project Two, GISP2 Contribution<br />
Series, lists research articles, University <strong>of</strong> New<br />
Hampshire, Durham, NY, Spring, 1993.<br />
Golden, Richard, and Sneider, Cary, “The Greenhouse<br />
Effect in a Vial,” The <strong>Science</strong> Teacher, May,<br />
1989.<br />
58 Global Systems <strong>Science</strong> <strong>Climate</strong> <strong>Change</strong> Teacher’s <strong>Guide</strong>
Gribbin, John, “The Oceanic Key to Climatic <strong>Change</strong>,” New Scientist, May<br />
19, 1988.<br />
Gribbin, John, Future Weather and the Greenhouse Effect, Delta, Dell<br />
Publishing, Co., New York, 1982.<br />
Gross, M. Grant, Oceanography: A View <strong>of</strong> the Earth, 5th Edition, Prentice-<br />
<strong>Hall</strong>: Englewood Cliffs, New Jersey, 1990.<br />
Hammond, Allen L., Editor in Chief, World Resources: 1990-91, The<br />
World Resources Institute, in collaboration with The United Nationsl<br />
Environment Programme and The United Nations Development<br />
Programme, Oxford University Press: Oxford, NY, 1990.<br />
Hammond, Allen L., Editor in Chief, World Resources: 1992-93, The<br />
World Resources Institute, in collaboration with The United Nationsl<br />
Environment Programme and The United Nations Development<br />
Programme, Oxford University Press: Oxford, New York, 1990.<br />
Hansen, James and Lebedeff, Sergej, “Global Surface Air Temperatures:<br />
Update Through 1987, Geophysical Research Letters, Vol. 15, no. 4,<br />
pages 323-326, April, 1988.<br />
Hicks, Craig, “Global Problems Demand a National Commitment, National<br />
Research Council, News Report, Vol. XLIII, No. 3, page 13.<br />
Houghton, R.A., and Woodwell, G.M., “Global <strong>Climate</strong> <strong>Change</strong>,” Scientific<br />
American, April, 1989.<br />
Jager, Jill, Climatic <strong>Change</strong>: Floating New Evidence in the CO2 Debate,”<br />
Environment, Vol. 28, No. 7, pp. 6-41, September, 1986.<br />
Jones, Philip D., and Wigley, M.L.,“Global Warming<br />
Trends,” Scientific American, August, 1990.<br />
Kasting, James F., Toon, Owen B., and Pollack,<br />
James, “How <strong>Climate</strong> Evolved on the Terrestrial<br />
Planets,” Scientific American Vol. 258, No. 2,<br />
pp. 90-97, February, 1988.<br />
Kerr, R., “How to Fix the Clouds in Greenhouse<br />
Models,” <strong>Science</strong>, January 6, 1989.<br />
Kerr, Richard A., “Linking Earth, Ocean, and Air at<br />
the AGU,” Research News, pg. 259-260, January<br />
15, 1988.<br />
Kerr, Richard, “Is the Greenhouse Here?” Research<br />
News, pp. 559-561, February 5, 1988.<br />
Knox, Joseph, Chair, Research Needs and<br />
Recommendations: Global <strong>Climate</strong> <strong>Change</strong> and<br />
Its Effects on California, National Institute for<br />
Global Environmental <strong>Change</strong>, University <strong>of</strong><br />
California at Davis, 1989.<br />
Kornberg, Warren, Editor, Global <strong>Change</strong>, a Mosaic<br />
Double Issue, Vol. 19, No. 3/4, National <strong>Science</strong><br />
Foundation, Washington, D.C., Fall/Winter,<br />
1988.<br />
LaMacchia, Diane, “A <strong>Climate</strong> <strong>of</strong> Uncertainty,” LBL<br />
Research Review, Summer, 1992.<br />
Lean, Ge<strong>of</strong>frey, Hinrichsen, Don, and Markham,<br />
Adam, World Wildlife Fund, Atlas <strong>of</strong> the<br />
Environment, Prentice <strong>Hall</strong> Press: New York,<br />
London, Toronto, Sydney, Tokyo, Singapore,<br />
1990.<br />
Leggett, Jeremy, Editor, Global Warming: The<br />
Greenpeace Report, Oxford University Press:<br />
Oxford, New York.<br />
Lemonick, Michael D., and Nash, Madeleine J., “The<br />
Heat Is On,” Time, October 19, 1987.<br />
Leutwyler, Kristin, “No Global Warming?” Scientific<br />
American, page 24, February, 1994.<br />
Ludlum, David M., The Climythology <strong>of</strong> America,<br />
Weatherwise, pp. 255-259, October, 1987.<br />
Lyman, Francesca, with Mintzer, Irving, Courrier,<br />
Kathleen, and Mackenzie, James, The Greenhouse<br />
Trap: What We’re Doing to the Atmosphere and<br />
How We Can Slow Global Warming, Beacon Press:<br />
Boston, 1990.<br />
Maranto, Gina, “Are We Close to the Road’s End?”<br />
Discover, pp. 28-50, January, 1986.<br />
Monastersky, R., “<strong>Climate</strong> Still Reeling from Pinatubo<br />
Blast,” <strong>Science</strong> News, Vol. 145, page 70, January<br />
29, 1994.<br />
Global Systems <strong>Science</strong> <strong>Climate</strong> <strong>Change</strong> Teacher’s <strong>Guide</strong> 59
Monastersky, Richard, “The $1.5 Billion Question: Can the U.S. Global<br />
<strong>Change</strong> Research Program Deliver on its Promises?” <strong>Science</strong> News, Vol.<br />
144, September 4, 1993, page 158.<br />
Monastersky, Richard, “Global <strong>Change</strong>: The Scientific Challenge, <strong>Science</strong><br />
News, April 15, 1989.<br />
Monastersky, Richard, “Looking for Mr. Greenhouse,” <strong>Science</strong> News, April<br />
8, 1989.<br />
Monastersky, Richard, “Has the Greenhouse Taken Effect? <strong>Science</strong> News,<br />
Vol. 133, page 282, April 30, 1988.<br />
Myers, Norman, “The Heat Is On,” Greenpeace, Vol. 14, No. 3, pp. 8-13,<br />
May/June, 1989.<br />
National Institute for Global Environmental <strong>Change</strong>, Annual Report to<br />
the U.S. Department <strong>of</strong> Energy, 1990, University <strong>of</strong> California, Davis,<br />
CA, 1991.<br />
National Institute for Global Environmental <strong>Change</strong>, Annual Report to<br />
the U.S. Department <strong>of</strong> Energy, 1991, University <strong>of</strong> California, Davis,<br />
CA, 1992.<br />
National Center for Atmospheric Research, Annual Report, 1990, Boulder,<br />
CO, June 1991.<br />
National Geographic, “Is Our World Warming?” National Geographic Society:<br />
Washington, D.C., October, 1990.<br />
Nelson, Burton D., Aron, Robert H., and Francek, Mark A., “Clarification <strong>of</strong><br />
Selected Misconceptions in Physical Geography,” Journal <strong>of</strong> Geography,<br />
March/April, 1992.<br />
New Scientist, “Warm Oceans Dissolve the Greenhouse Effect,” June 25,<br />
1987.<br />
Office for Interdisciplinary Earth Studies, Earthquest,<br />
Quarterly Newsletter, University Corporation for<br />
Atmospheric Research (UCAR), Boulder, CO,<br />
1991, 1992.<br />
Office <strong>of</strong> Energy Research, United States Department<br />
<strong>of</strong> Energy, Atmospheric Carbon Dioxide and The<br />
Greenhouse Effect, Available from the National<br />
Technical Information Service, U.S. Department<br />
<strong>of</strong> Commerce, Springfield, VA 22161, May,<br />
1989.<br />
Paden, Mary E., Managing Editor, World Resources:<br />
1988-89, The World Resources Institute,<br />
in collaboration with The United Nationsl<br />
Environment Programme and The United Nations<br />
Development Programme, Basic Books, Inc.:<br />
New York.<br />
Panel on Policy Implications <strong>of</strong> Greenhouse<br />
Warming, Committee on <strong>Science</strong>, Engineering,<br />
and Public Policy, National Academy <strong>of</strong> <strong>Science</strong>s,<br />
Policy Implications <strong>of</strong> Greenhouse Warming:<br />
Mitigation, Adaptation, and the <strong>Science</strong> Base,<br />
National Academy Press: Washington, D.C.,<br />
1992.<br />
Penner, J.E., et. al., “Quantifying and Minimizing<br />
Uncertainty <strong>of</strong> <strong>Climate</strong> Forcing by Anthropogenic<br />
Aerosols,” U.S. Department <strong>of</strong> Energy, Office<br />
<strong>of</strong> Energy Research, Environmental <strong>Science</strong>s<br />
Division, Washington, D.C., 1993.<br />
Perry, John S., “Climatic <strong>Change</strong>: Setting Serious<br />
About Climatic <strong>Change</strong>,” Environment, Vol. 27,<br />
No. 10, pp. 2-3, December, 1985.<br />
Pitt, David E., “Computer Vision <strong>of</strong> Global Warming:<br />
Hardest on Have-Nots,” New York Times, pg. B5,<br />
January 18, 1994.<br />
Postel, Sandra, Worldwatch Paper 71, Alterning<br />
the Earth’s Chemistry: Assessing the Risks,<br />
Worldwatch Institute, 1986.<br />
Ramanathan, et. al., “Cloud-Radiative Forcing and<br />
<strong>Climate</strong>, <strong>Science</strong>, January 6, 1989.<br />
Sagan, Carl, “The Warming <strong>of</strong> the World,” Parade,<br />
February 3, 1985.<br />
Samz, Jane, “Keeping the Chill Off,” <strong>Science</strong> World,<br />
March 25, 1988.<br />
Schneider, Stephen H., and Londer, Randi,<br />
Coevolution <strong>of</strong> <strong>Climate</strong> and Life, Sierra Club<br />
Books: San Francisco, 1984.<br />
60 Global Systems <strong>Science</strong> <strong>Climate</strong> <strong>Change</strong> Teacher’s <strong>Guide</strong>
Schneider, Stephen H., “The Global Warming Debate Heats Up: An Analysis<br />
and Perspective.<br />
Schneider, Stephen H., Global Warming: Are We Entering the Greenhouse<br />
Century? Sierra Club Books: San Francisco, 1989.<br />
Schneider, Stephen H., The Genesis Strategy: <strong>Climate</strong> and Global Survival,<br />
New York: Plenum Press, 1976.<br />
<strong>Science</strong> News, “Global Warming: Checking Out the Sun,” <strong>Science</strong> News,<br />
Vol. 140, December 7, 1991.<br />
Silver, Cheryl Simon, and DeFries, Ruth S., One Earth, One Future, National<br />
Academy Press: Washington, D.C., 1990.<br />
Smith, Emily T., and Bluestone, Mimi, “The Global Greenhouse Finally has<br />
Leaders Sweating,” Business Week, pp. 74-76, August 1, 1988.<br />
Stevens, William K., “Threat <strong>of</strong> Encroaching Deserts May be More Myth<br />
Than Fact,” New York Times, pg. B5, January 18, 1994.<br />
Stowe, Keith, Essentials <strong>of</strong> Ocean <strong>Science</strong>, John Wiley and Sons: New York,<br />
Chichester, Brisbane, Toronto, Singapore, 1987.<br />
Sundquist, Eric T., “The Global Carbon Dioxide Budget,” <strong>Science</strong>, Vol. 259,<br />
February 12, 1993.<br />
The Open University, Ocean Circulation, Pergamon Press: Oxford, New<br />
York, Beijing, Frankfurt, Sao Paolo, Sydney, Tokyo, Toronto, 1989.<br />
Titus, James G., “Greenhouse Effect, Sea Level Rise, and Barrier Islands:<br />
Case Study <strong>of</strong> Long Beach Island, New Jersey, Coastal Management,<br />
Vol. 18, pp. 65-90, 1990.<br />
Titus, James G., “Strategies for Adapting to the Greenhouse Effect,” APA<br />
Journal, pp. 311-323, Summer, 1990.<br />
Udall, James R., “Turning Down the Heat,” Sierra, pp. 26-40, July/August,<br />
1989.<br />
Warrick, Bolin and Jager, Doos, Scope 29, The Greenhouse Effect, Climatic<br />
<strong>Change</strong>, and Ecosystems, John Wiley & Sons, Chichester, New York,<br />
Brisbane, Toronto, Singapore, 1986.<br />
White, Richard M., “The Great <strong>Climate</strong> Debate,” Scientific American,<br />
July, 1990.<br />
Williamson, Phillip, and Gribbin, John, “How Plankton <strong>Change</strong> the <strong>Climate</strong>,”<br />
New Scientist, March 16, 1991.<br />
Wright, W. Redwood, “Currents <strong>of</strong> the Sea,” Natural History, pages 31-37,<br />
August-September, 1976.<br />
Williams, A., “Control <strong>of</strong> Nitrogen Oxides,” Nature, Vol. 324, December<br />
25, 1986.<br />
Global Systems <strong>Science</strong> <strong>Climate</strong> <strong>Change</strong> Teacher’s <strong>Guide</strong> 61
Index <strong>of</strong> Investigations/Activities<br />
Activities Related to <strong>Climate</strong> <strong>Change</strong> ....................................... 13<br />
What Drives the Global Conveyor Belt? .................................... 20<br />
How Does Ocean Temperature Affect Absorption <strong>of</strong> CO2? .............. 25<br />
The Next Great Super Hero ................................................... 26<br />
Resonance Activity Modifications ............................................ 32<br />
Observing Carbon Dioxide Gas ............................................... 33<br />
Will Melting Ice Caps Increase Global Warming? .......................... 42<br />
How Much CO2 from a Gallon <strong>of</strong> Gas? ....................................... 45<br />
A Challenge for Teachers: Heat Absorption by Greenhouse ............ 47<br />
Atmospheric Composition and <strong>Climate</strong> <strong>Change</strong> ....................... 48<br />
A Comparative Study <strong>of</strong> Common Atmospheric Gases ................ 49<br />
Measuring the Heat Capacity <strong>of</strong> Greenhouse Gases .................. 50<br />
62 Global Systems <strong>Science</strong> <strong>Climate</strong> <strong>Change</strong> Teacher’s <strong>Guide</strong>