Download the charts from my presentation. - TTI Inc.
Download the charts from my presentation. - TTI Inc.
Download the charts from my presentation. - TTI Inc.

Create successful ePaper yourself
Turn your PDF publications into a flip-book with our unique Google optimized e-Paper software.
20111031<br />
60<br />
50<br />
40<br />
30<br />
20<br />
$ Billion<br />
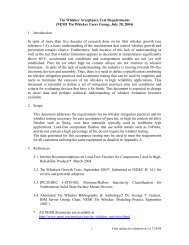
World PCB Shipments (with forecast)<br />
Converted @ Constant 2010 Exchange Rates<br />
Growth calculations:<br />
Europe = composite European SIA & local PCB<br />
assoc data<br />
Japan & N. America <strong>from</strong> JPCA & IPC data<br />
Taiwan/China:44 rigid & flex company<br />
composite<br />
Rest of Asia growth = Taiwan/China 44<br />
company composite<br />
+19%<br />
-14%<br />
31.6 38.6 31.2 29.4 31.7 37.6 42.9 51.7 54.3 53.2 45.9 54.5<br />
1 3 5 7 9111 3 5 7 9111 3 5 7 9111 3 5 7 9111 3 5 7 9111 3 5 7 9111 3 5 7 9111 3 5 7 9111 3 5 7 9111 3 5 7 9111 3 5 7 9111 3 5 7 9111 3 5 7 9111 3 5 7 9111<br />
99 00 01 02 03 04 05 06 07 08 09 10 11 12 13<br />
CALENDAR YEAR<br />
Source: Custer Consulting Group - 2010 base year expanded by monthly growth of N. American,<br />
European, Japanese & Taiwan/China monthly PCB shipments<br />
0%<br />
54.9<br />
+3%<br />
56.5