Monthly Index Chart Book
Monthly Index Chart Book
Monthly Index Chart Book

Create successful ePaper yourself
Turn your PDF publications into a flip-book with our unique Google optimized e-Paper software.
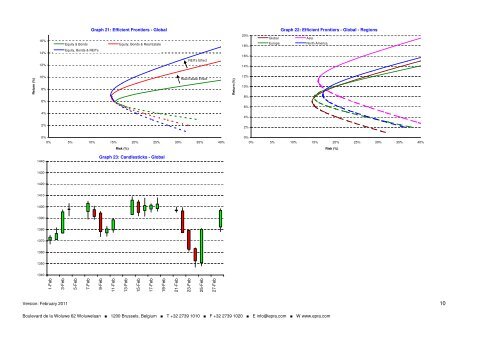
Return (%)<br />
16%<br />
14%<br />
12%<br />
10%<br />
8%<br />
6%<br />
4%<br />
2%<br />
Version: February 2011<br />
Graph 21: Efficient Frontiers - Global<br />
0%<br />
0% 5% 10% 15% 20% 25% 30% 35% 40%<br />
1440<br />
1430<br />
1420<br />
1410<br />
1400<br />
1390<br />
1380<br />
1370<br />
1360<br />
1350<br />
1340<br />
1-Feb<br />
3-Feb<br />
Equity & Bonds Equity, Bonds & Real Estate<br />
Equity, Bonds & REITs<br />
5-Feb<br />
7-Feb<br />
Risk (%)<br />
Graph 23: Candlesticks - Global<br />
9-Feb<br />
11-Feb<br />
13-Feb<br />
15-Feb<br />
17-Feb<br />
19-Feb<br />
21-Feb<br />
REITs Effect<br />
Real Estate Effect<br />
Graph 22: Efficient Frontiers - Global - Regions<br />
Boulevard de la Woluwe 62 Woluwelaan ■ 1200 Brussels, Belgium ■ T +32 2739 1010 ■ F +32 2739 1020 ■ E info@epra.com ■ W www.epra.com<br />
23-Feb<br />
25-Feb<br />
27-Feb<br />
Return (%)<br />
20%<br />
18%<br />
16%<br />
14%<br />
12%<br />
10%<br />
8%<br />
6%<br />
4%<br />
2%<br />
Global Asia<br />
Europe North America<br />
0%<br />
0% 5% 10% 15% 20% 25% 30% 35% 40%<br />
Risk (%)<br />
10