Monthly Index Chart Book
Monthly Index Chart Book
Monthly Index Chart Book
You also want an ePaper? Increase the reach of your titles
YUMPU automatically turns print PDFs into web optimized ePapers that Google loves.
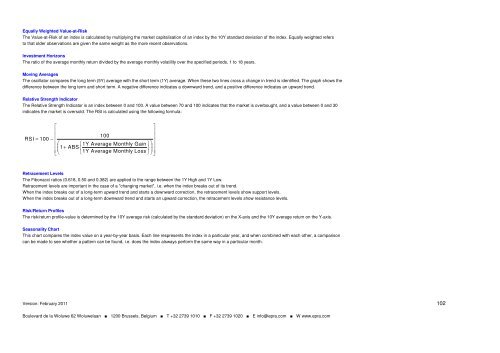
Equally Weighted Value-at-Risk<br />
The Value-at-Risk of an index is calculated by multiplying the market capitalisation of an index by the 10Y standard deviation of the index. Equally weighted refers<br />
to that older observations are given the same weight as the more recent observations.<br />
Investment Horizons<br />
The ratio of the average monthly return divided by the average monthly volatility over the specified periods, 1 to 18 years.<br />
Moving Averages<br />
The oscillator compares the long term (5Y) average with the short term (1Y) average. When these two lines cross a change in trend is identified. The graph shows the<br />
difference between the long term and short term. A negative difference indicates a downward trend, and a positive difference indicates an upward trend.<br />
Relative Strength Indicator<br />
The Relative Strength Indicator is an index between 0 and 100. A value between 70 and 100 indicates that the market is overbought, and a value between 0 and 30<br />
indicates the market is oversold. The RSI is calculated using the following formula:<br />
⎡<br />
⎤<br />
⎢<br />
⎥<br />
⎢<br />
100<br />
⎥<br />
RSI<br />
= 100 − ⎢<br />
⎛<br />
⎥<br />
⎢<br />
⎧<br />
⎞<br />
⎜<br />
1Y Average <strong>Monthly</strong> Gain ⎫<br />
⎟ ⎥<br />
⎢ ⎜<br />
1 + ABS ⎨<br />
⎬ ⎟<br />
⎣ ⎝ ⎩1Y<br />
Average <strong>Monthly</strong> Loss ⎭ ⎠ ⎥<br />
⎦<br />
Retracement Levels<br />
The Fibonacci ratios (0.618, 0.50 and 0.382) are applied to the range between the 1Y High and 1Y Low.<br />
Retracement levels are important in the case of a "changing market", i.e. when the index breaks out of its trend.<br />
When the index breaks out of a long-term upward trend and starts a downward correction, the retracement levels show support levels.<br />
When the index breaks out of a long-term downward trend and starts an upward correction, the retracement levels show resistance levels.<br />
Risk/Return Profiles<br />
The risk/return profile-value is determined by the 10Y average risk (calculated by the standard deviation) on the X-axis and the 10Y average return on the Y-axis.<br />
Seasonality <strong>Chart</strong><br />
This chart compares the index value on a year-by-year basis. Each line respresents the index in a particular year, and when combined with each other, a comparison<br />
can be made to see whether a pattern can be found, i.e. does the index alsways perform the same way in a particular month.<br />
Version: February 2011<br />
Boulevard de la Woluwe 62 Woluwelaan ■ 1200 Brussels, Belgium ■ T +32 2739 1010 ■ F +32 2739 1020 ■ E info@epra.com ■ W www.epra.com<br />
102


