REPORT OF THE EXPERT COMMITTEE ON TECHNICAL ... - smallB
REPORT OF THE EXPERT COMMITTEE ON TECHNICAL ... - smallB
REPORT OF THE EXPERT COMMITTEE ON TECHNICAL ... - smallB

Create successful ePaper yourself
Turn your PDF publications into a flip-book with our unique Google optimized e-Paper software.
<strong>REPORT</strong><br />
<strong>OF</strong> <strong>THE</strong><br />
<strong>EXPERT</strong> <strong>COMMITTEE</strong><br />
<strong>ON</strong><br />
<strong>TECHNICAL</strong> TEXTILES<br />
Volume - II<br />
Government of India<br />
Ministry of Textiles<br />
Udyog Bhavan<br />
New Delhi – 110 011<br />
July, 2004
Appendices<br />
(5A to 5C)
Appendix<br />
No.<br />
C<strong>ON</strong>TENTS<br />
5A Project profiles made by TECS<br />
i<br />
Page No.<br />
1. Needlepunch project 1<br />
2. Geogrid project 39<br />
3. Automotive seat belt and other rigid webbings project 65<br />
4. Multipurpose coating project 87<br />
5. Circular warp knitting project 109<br />
6(a). Sanitary napkins project (converting line) 129<br />
6(b). Incontinence (adult) diapers project (converting line) 157<br />
6(c). Baby diapers project (converting line) 177<br />
7. Healthcare disposables project 195<br />
8. Spunbond project 227<br />
9. Spunlace project 249<br />
10. Surgical dressings complex project 275<br />
5B Project profile made by M/s. Kusumgar Corporates 305<br />
11. Taffeta fabrics<br />
5C Project profiles made by SASMIRA<br />
12. Agro shade net project 329<br />
13. Fibrefill project 339<br />
14. Industrial filter fabrics project 359<br />
15. Woven geotextiles project 371<br />
16. Safety and protective textiles project 381<br />
17. Shoe uppers project 395<br />
18. Double needle bar spacer project 407
NEEDLE-PUNCH PROJECT<br />
Appendix – 5A<br />
SECTI<strong>ON</strong> I : PRODUCT BRIEF, APPLICATI<strong>ON</strong> AREAS AND<br />
MARKET POTENTIAL<br />
1.1 Needlepunching is the oldest method of producing nonwoven products. The first<br />
needle loom produced in the United States was made by the James Hunter Machine Co. in<br />
1948. Then, in 1957, James Hunter produced the first high - speed needle loom, the “Hunter<br />
Model 8” which is still used today. This was the first needle loom completely counter-<br />
balanced with eccentrics running opposed to each other and mounted in pairs, it was also the<br />
first to operate at 800 strokes per minute.<br />
1.2 The Needle punch webs offer a wide range of product characteristics such as :<br />
• Unique physical properties i.e., elongation in the X, Y & Z direction for<br />
mouldable applications,<br />
• Ability to attach layers of different type fibre webs to produce composites,<br />
• High opacity per unit area,<br />
• High strength makes them overwhelming choice for geotextile fabric,<br />
Major Application and End-usages :<br />
• Geotextiles : Needle punch geotextiles are used in functions like separation,<br />
filtration, reinforcement, drainage & erosion control and find applications in<br />
roads, railways, air runways, coastal shore protection, etc.<br />
• Needle punch carpets : They are used in passenger cars as flooring material.<br />
• Other Miscellaneous Applications : Headliners, Filtration, Insulation Felts, etc.<br />
Emerging Market Potential - Global and Indian<br />
Global Market Potential :<br />
1.3 In 1970, the consumption of geotextiles was 10 million sq. mt. which rose to 110<br />
million sq. mt. in 1980 & 700 million sq. Mts. in 1990 and further to around 1400 million sq.<br />
mt. in 2000 as shown overleaf:
TREND IN <strong>THE</strong> GLOBAL C<strong>ON</strong>SUMPTI<strong>ON</strong> <strong>OF</strong> GEOTEXTILES<br />
1400<br />
1200<br />
1000<br />
800<br />
600<br />
400<br />
200<br />
0<br />
10<br />
30<br />
(1970 TO 2000)<br />
C ons um ption (M illion S q.m ts .)<br />
110<br />
1970 1975 1980 1990 1995 2000<br />
700<br />
1000<br />
Appendix – 5A (Contd..)<br />
1.4 The broad consumption pattern of geotextiles of different materials, is shown<br />
below :<br />
Total Consumption in the year 2000 : 1400 million<br />
sq.mtrs.<br />
Jute<br />
1%<br />
Synthetic Materials<br />
94%<br />
Other Natural<br />
Fibres<br />
5%<br />
1400<br />
2
Regional consumption of geotextiles is shown below :<br />
REGI<strong>ON</strong>AL C<strong>ON</strong>SUMPTI<strong>ON</strong> <strong>OF</strong> GEOTEXTILES<br />
Europe<br />
40%<br />
Japan, Asia,<br />
Australia& the rest<br />
20%<br />
North America<br />
40%<br />
Appendix – 5A (Contd..)<br />
The future development of the geotextile industry will be in the developing<br />
economies of China and India.<br />
1.5 Global Geotextile industry is expected to maintain an annual growth rate of 8.6%.<br />
Accordingly the market potential will be as follows :<br />
Global Market Potential<br />
Year By Volume By Value<br />
Mn. sq. mt. (‘000 MT) (Rs. Crores) ($ MN.)<br />
(#) 2000-2001 1400 224 2912 633<br />
2001-2002 (Proj.) 1520 243 3162 687<br />
2003-2004 (Proj.) 1793 287 3730 811<br />
2007-2008 (Proj.) 2494 399 5188 1128<br />
(#) Source: Internet sourcing. For the subsequent years market potential has been projected.<br />
US MARKET POTENTIAL :<br />
US Market Split-up for Geosynthetics : (% wise) 2001-02 (1)<br />
Geogrid<br />
5%<br />
Geomembrane<br />
12%<br />
Geonet<br />
3%<br />
Others<br />
5%<br />
(1) Source: Freedonia Group.<br />
Geotextiles<br />
75%<br />
3
US Market Split-up for Geosynthetics : (tonnes) 2001-02 (1)<br />
G e o g rid<br />
6 8 7 5<br />
G e o m e m b ra n e<br />
1 7 7 6 0<br />
(1) Source: Freedonia Group.<br />
G e o n e t<br />
5 0 3 2<br />
O th e r<br />
7 2 5 2<br />
Appendix – 5A (Contd..)<br />
G e o te xtile<br />
1 1 1 0 0 0<br />
Notes: Geosynthetics is the family name for the products like: Geotextile, Geogrid, Geomembrane,<br />
Geonet etc.<br />
INDIAN MARKET POTENTIAL :<br />
Geotextiles:<br />
(I) ROAD PROJECTS<br />
Projects Infrastructure<br />
Investments<br />
Market Potential<br />
(2001-02 to 2007-08)<br />
Planned<br />
Rs. Cr.<br />
Quantity Value ( @ 3%)<br />
( upto 2007-08) (tonnes)<br />
(Rs. Cr.)<br />
National Highway Development<br />
Program<br />
58000 133846 1740<br />
Pradhan Mantri Gram Sadak<br />
Yojana (PMGSY)<br />
60000 138461 1800<br />
Expressways 18884 43615 567<br />
State & District Roads 7520 17384 226<br />
Total Roads (I) 144404 333307<br />
(2563 mn sq. mt.)<br />
4333<br />
(II) RAILWAY PROJECTS<br />
Infrastructure<br />
Projects<br />
Market Potential<br />
Investments Planned<br />
(2001-02 to 2007-08)<br />
Rs. Cr.<br />
Quantity Value (@ 3%)<br />
(upto 2007-08)<br />
(tonnes)<br />
(Rs. Cr.)<br />
Central Projects<br />
(NRVY, Port, connectivity)<br />
15984 36923 480<br />
State Level Projects 10279 23692 308<br />
Metro Projects 13194 30461 396<br />
Total Railways (II) 39457 91076<br />
(700 mn sq. mt.)<br />
1184<br />
Total Roads + Railways (I + II ) 183861 246250<br />
(3263 mn sq. mt.)<br />
5517<br />
Notes: NRVY - National Rail Vikas Yojana.<br />
4
(III) PAVEMENT OVERLAY<br />
Projects Infrastructure<br />
Appendix – 5A (Contd..)<br />
Investments Planned<br />
Market Potential<br />
(2001-02 to 2007-08)<br />
Rs. Cr.<br />
Quantity Value ( @ 3%)<br />
(upto 2007-08) (tonnes) (Rs. Cr.)<br />
Paved Road Network 17500 40384<br />
(310 mn sq. mt.)<br />
525<br />
Grand Total<br />
201361 464769<br />
6042<br />
(I + II + III )<br />
(3574 mn sq. mt.)<br />
(IV) O<strong>THE</strong>R INFRASTRUCTURE PROJECTS<br />
Projects Infrastructure<br />
Market Potential<br />
Investments Planned (2001-02 to 2007-08)<br />
Rs. Cr.<br />
Quantity Value ( @ 3%)<br />
(upto 2007-08) (tonnes) (Rs. Cr.)<br />
Accelerated Irrigation Benefit<br />
8500 19615<br />
525<br />
Programme (AIBP)<br />
(151 mn sq. mt.)<br />
National Coastal Protection Plan<br />
1800 4153<br />
54<br />
(NCPP)<br />
(32 mn sq. mt.)<br />
Flood Control 8000 18461<br />
(142 mn sq. mt.)<br />
240<br />
Grand Total<br />
2,19,661 506996<br />
6591<br />
( I + II + III + IV )<br />
(3898 mn sq. mt.)<br />
Source : Ministry of Road Transport and Highways - Annual Report and other published documents)<br />
Market potential for geotextiles in Industrial road development as per discussions<br />
with organisations like MIDC, GIDC, APIDC is not significant when compared<br />
with other road development projects.<br />
1.6 Further split up of market potential for Geo Textiles on annualised basis is shown<br />
below :<br />
INDIAN MARKET POTENTIAL FOR GEOTEXTILES<br />
Projects Value<br />
Rs.Cr.<br />
Total Roads (National<br />
Highways, Pradhan<br />
Mantri Gram Sadak<br />
Yojana, Expressways,<br />
State & District Roads)<br />
2001 - 2002 - 2003 - 2004 - 2005 - 2006 - 2007 -<br />
02 03 04 05 06 07 08<br />
(@ 3%)<br />
4333 75 145 175 320 725 1077 1816<br />
Railways 1184 15 35 75 115 250 294 400<br />
Pavement Road Network 525 5 10 25 45 100 140 200<br />
Other Infrastructure<br />
Projects<br />
549 5 10 25 40 100 145 224<br />
Total 6591 100 200 300 520 1175 1656 2640<br />
Cumulative Total 100 300 600 1120 2295 3951 6591<br />
* The national highways projects includes golden quadrilateral (completion by<br />
2006-07) and NSEW corridors (scheduled for completion by 2007-08) also The<br />
5
Appendix – 5A (Contd..)<br />
Pradhan Mantri Gram Sadak yojana and expressways and the state and district<br />
roads will be getting over by 2009-10.<br />
* Geotextile demand potential is based on infrastructure projects likely to be<br />
implemented between 2001-02 to 2007-08 : Rs.6,591 Cr (@ 3% of investment in<br />
infrastructure projects of Rs.219661Cr.)<br />
* However, actual demand realisatiaon will depend on the extent of usage of GT in<br />
various projects.<br />
* Also, if the implementation of projects is delayed the actual realisatiton of market<br />
will spill over beyond 2007-2008.<br />
O<strong>THE</strong>R MISCELLANEOUS APPLICATI<strong>ON</strong>S :<br />
Products<br />
Auto Interior<br />
Carpets (100%<br />
TTC)<br />
(using needle punch technology)<br />
2001-2002 2003-2004 (Est.) 2007-2008 (Proj.)<br />
Quantity<br />
Value (Rs.<br />
Cr)<br />
Quantity<br />
Value (Rs.<br />
Cr)<br />
Quantity<br />
Value<br />
(Rs. Cr)<br />
2.5 mn sq. 25.00 5 mn sq. 50.00 8 mn sq. 80.00<br />
mt.<br />
mt.<br />
mt.<br />
Headliners 1.34 43.00 1.98 63.30 2.90 92.67<br />
mn.sq.mt.<br />
mn.sq.mt<br />
mn.sq.mt.<br />
Headliners 1.34 8.04 1.98 11.87 2.90 17.38<br />
Fabrics (TTC) mn.sq.mt.<br />
mn.sq.mt<br />
mn.sq.mt.<br />
Filters - 260.00 - 297.60 - 386.29<br />
Filtration<br />
Media (TTC)<br />
- 81.00 - 95.00 - 132.00<br />
Insulation 6.31 lakh 13.40 9.89 lakh 19.76 14.48 28.96<br />
Felts (100% no of cars<br />
no of<br />
lakh no of<br />
TTC)<br />
/ MUV<br />
cars /<br />
cars /<br />
MUV<br />
MUV<br />
Total<br />
341.40<br />
430.66<br />
587.92<br />
(TTC)<br />
(127.44)<br />
(176.63)<br />
(258.34)<br />
Source: Industry Sources, Field Survey feedback and Market estimates.<br />
Notes: 1. Although this project is dedicated for Geotextiles, the technology has<br />
broad base applications for other products as mentioned above.<br />
6
Jute Geo Textiles : Potential Application Areas and Consumption Pattern<br />
Jute Geo-Textiles v/s Synthetic Geo-Textiles<br />
Appendix – 5A (Contd..)<br />
1.7 Jute Geotextile can be customized to meet site-specific technical requirements as in<br />
the case of Synthetic Geotextiles. The only differences lies in its biodegradability. Technical<br />
properties of Jute Geotextiles are given in Annexure III.<br />
1.8 Production and Consumption of Jute Geotextile in India has been as follows:<br />
Year Production/ Consumption<br />
2001-2002 3,84,000 sq. mt.<br />
2002-2003 5,33,250 sq. mt.<br />
2003-2004 19,02,268 sq. mt.<br />
1.9 The consumption of Open Weave Jute Geotextile (known as Soil Saver), in the last 3<br />
years was as follows :<br />
Year Production/ Consumption<br />
2001-2002 4,894 MT<br />
2002-2003 10,023 MT<br />
2003-2004 7,163 MT<br />
1.10 Target customers and potential users of jute geotextiles are State PWDs, CPWD,<br />
State Irrigation & Water Resources Departments, Boarder Roads Organisation, Open Cast<br />
Coal Mines, Railways, State Forest & Environment Departments and State Rural &<br />
Panchayet Departments executing rural roads under PMGSY, etc..<br />
1.11 IJIRA in Kolkatta is well equipped for Common Testing Equipment for Jute<br />
Geotextiles.<br />
SECTI<strong>ON</strong> II : NEEDLE PUNCH TECHNOLOGY AND EQUIPMENT<br />
Process Description :<br />
SUPPLIERS<br />
1.12 Needle-punched nonwovens are manufactured by mechanically orienting and<br />
interlocking the fibers of a carded web. This mechanical interlocking is achieved with<br />
7
Appendix – 5A (Contd..)<br />
thousands of barbed felting needles repeatedly passing into and out of the web. The major<br />
components of the needle punch line and brief description of each are as follows :<br />
1. Blender - The machine is where the raw materials are stored at a desired<br />
proportion of different types fibers (e.g., 40% PP and 60% PET)<br />
2. Opener - It is where the raw materials are fed from the blender in order to<br />
reduce the size of fiber tufts from the blender to the hopper feed.<br />
3. Hopper - The machine where the fibers are stored and are transferred for<br />
fiber carding.<br />
4. Carding : The process where the entangled fibers are arranged into a<br />
parallel fibrous web.<br />
5. Cross Lapper - The machine that continuously lays a web so that its<br />
fibers are oriented in cross direction. The web is laid on the conveyor<br />
moving at right angles.<br />
6. Needle Punching - The process in which the web is bonded mechanically<br />
to each other by a series of needles. The design of products are being<br />
controlled in this line. The operations consists of a pre-needler, drafter and<br />
a finish needle loom.<br />
7. Calendering - In this process a smoother product by heating up to a<br />
certain (melting) temperature depending on the raw materials used.<br />
8. Winding & Cutting - The final product is being wound into rolls and<br />
being cut into a specified width in this line.<br />
FLOW DIAGRAM <strong>OF</strong> <strong>THE</strong> NEEDLE PUNCH PRODUCTI<strong>ON</strong> PROCESS<br />
BLENDER<br />
OPENNER<br />
HOPPER<br />
CARDING<br />
CROSS LAPPER<br />
PRE- NEEDLE LOOM<br />
DRAFTING UNIT<br />
FINISHING NEEDLE LOOM<br />
8
Technology and Equipment Suppliers :<br />
SINGEING PROCESS<br />
CALENDERING<br />
WINDING & CUTTING<br />
1.13 The technology suppliers contacted by TECS are :<br />
1. Dilo Maschinensystem GmbH (Germany)<br />
Local Representative - A.T.E. Marketing Pvt. Ltd.<br />
A-19 CTS No. 689 Veera Desai Road<br />
Andheri (W), Mumbai 400 053<br />
Tel: 5676 6100 Fax: 2673 2446<br />
2. Fehrer AG (Austria)<br />
Appendix – 5A (Contd..)<br />
Local Representative - Engineering & Agencies (Pvt.) Ltd.<br />
Sterling Centre (4th Floor), Dr. Annie Besant Road<br />
Worli, Mumbai - 400 018<br />
Tel: 2498 8510/2 Fax: 2498 6038<br />
3. Asselin NSC (France)<br />
4. American Textile Machinery (USA)<br />
5. Shoou Shyng (Taiwan)<br />
Notes: The list contains the leading global players in the Needle Punch Technology<br />
and as per the discussion with Industry experts the above list is exhaustive.<br />
1.14 TECS has received responses from “DILO” and “FEHRER”, both these are globally<br />
recognised players and discussions were held with their local representatives in India.<br />
Recommended Minimum Economic Size :<br />
1.15 The needle-punch project proposed to be set up in India will have a maximum carding<br />
capacity of 600 kgs per hour, with details like :<br />
Width : 5000 mm max,<br />
Fibres : PP / PSF (5-12 dtex)<br />
Fibre Length : 60-100 mm<br />
9
Appendix – 5A (Contd..)<br />
1.16 As per the discussions with the Industry Experts under Indian operating conditions it<br />
is safer to assume machine efficiency factor of 80%, and therefore the production would be<br />
480 kgs per hour.<br />
1.17 The plant would operate in three shifts, 24 hours and 300 working days (e) in a year.<br />
(e) Notes: According to the Industry Experts the cards of the carding unit have to be cleaned on<br />
regularly basis and needs annual shutdown for preventive maintenance. Hence 300<br />
working days are assumed.<br />
Investment in Process Plant and Machinery.<br />
1.18 As per the indicative budgetary quotations and assuming 25% discount from the<br />
machinery suppliers, the investment in the process plant and machinery (including<br />
coating & finishing equipment) will be Rs 26.38 crores (FOB). The additional needle<br />
boards needed for carpet making can also be covered in the same cost. The List of core<br />
machinery is attached as Annexure I. Finer details on the Equipment specifications and the<br />
formal quotations need to be discussed with the technology supplier before the project is<br />
taken up. Taking into account the CIF value(2%), the custom duties (Custom duty of 5%),<br />
inland transportation (2%), erection and commissioning (5%), the installed cost of process<br />
equipment would be Rs 30.25 crores.<br />
1.19 Other Technologies Available For Producing The Identified Product :<br />
Products Other Technologies<br />
Geotextiles Woven, Knitted, Spunbond & Spunlace For Non Woven<br />
SECTI<strong>ON</strong> III : PROJECT COST & PR<strong>OF</strong>ITABILITY PROJECTI<strong>ON</strong>S<br />
Land<br />
1.20 The total requirement of land for this project is around 12138 Sq. Mtrs. (3.0 acres).<br />
This takes into account the contingency plan for future expansion.<br />
1.21 Based on the available information the cost of land is assumed at Rs 1200 per square<br />
meter ( including the developmental cost ). Depending on the exact location of the project to<br />
be determined by the promoter the land cost could be higher or lower. Hence the total cost of<br />
developed land will be Rs 1.46 crores.<br />
10
Buildings<br />
Appendix – 5A (Contd..)<br />
1.22 The building area comprising of main factory building, godowns, office, R & D labs<br />
/ In-house Testing centre etc. would be 4500 sq. mtrs. The cost of construction would again<br />
vary depending on the structure and the materials to be used. It has been assumed that the<br />
average cost of construction would be Rs 4500 per sq. mtr. Thus the total cost of building<br />
and other civil works would be around Rs 2.03 crores.<br />
Plant and Machinery<br />
1.23 Details of Plant and machinery as well as technology required for the project have<br />
been presented in earlier Section II . The installed cost of plant and machinery would be Rs<br />
30.25 crores.<br />
1.24 Apart from the main process equipments the utilities required are:<br />
• Electricals,<br />
• Piping,<br />
• Water supply system,<br />
• Compressors,<br />
• Fire fighting equipments,<br />
• Material Handling equipment such as fork lifts etc.<br />
• Other miscellaneous equipment.<br />
1.25 The provision on this count is assumed at Rs 2.00 crores.<br />
Testing Lab (In-house)<br />
1.26 As per the Industry Experts the In-house Testing and R& D facility would call for an<br />
investment of around Rs 0.35 crore. The list of testing equipment is given in Annexure II.<br />
Miscellaneous Fixed Assets<br />
1.27 Under this head the items included are Furniture and fixtures, Office equipments,<br />
Air Conditioners etc. and the provision made is around Rs 0.15 crores.<br />
Project Engineering and Consulting<br />
1.28 Under this head the items included are the fees and expenses on account of<br />
Architect fees, project engineering and management (both local and overseas ), detailed<br />
project reports etc.<br />
11
Preliminary & Preoperative Expenses<br />
Appendix – 5A (Contd..)<br />
1.29 The items included under this head are company formation expenses, public issue<br />
expenses (if any), interest during construction, pre-production expenses, during the<br />
implementation phase etc.<br />
Contingency Expenses<br />
1.30 Depending on the gestation period and further detailing of the project cost by the<br />
promoter, the contingency provision has been made at the rate of 10%.<br />
Margin Money for Working capital<br />
1.31 The margin money for working capital forming part of the total project cost would be<br />
Rs 1.32 crores. The details of the working are shown in Exhibit 1.3.<br />
Total Project Cost<br />
1.32 The total project cost as given in Exhibit 1.1 would be Rs 46.83 crores.<br />
Project Funding And Financing Pattern<br />
1.33 It has been assumed that the project would be financed through long term funds and<br />
Equity participation by the Promoter / Public. The technical textile sector being a high<br />
priority area, it is assumed that a Debt- Equity ratio of 1.5 : 1 would be feasible. (However<br />
the sensitivity analysis has also been presented for 1 : 1 and 2 : 1 Debt Equity ratios.)<br />
Sales, Profitability And Sensitivity Analysis<br />
Sales Realisation and Turnover<br />
1.34 As per the details available from the Technology and Equipment suppliers and<br />
Industry Experts the economic size of a plant with maximum carding capacity is 600<br />
kgs/hour.<br />
1.35 As per the feedback from the Industry Experts under Indian conditions, it is assumed<br />
that the machine would operate at an efficiency level of 80 %. Hence the production from the<br />
plant would be 480 kgs/hour .<br />
12
Appendix – 5A (Contd..)<br />
1.36 The plant would operate on Three -shift basis and 300 workings days in a year.<br />
1.37 The capacity utilisation for the 1st year is assumed at 50% and thereafter for the 2 nd ,<br />
3 rd and 4 th year onwards 60%, 75% and 90% respectively.<br />
1.38 The average selling price of the geotextile would be Rs 125/kg (net of excise duties,<br />
sales tax and other incidental expenses). The prevailing international prices are in the range<br />
of $2.75 to $ 3/kg depending on the gsm range and other parameters. This line is dedicated<br />
for geotextiles. However, the machinery has the capability to manufacture other products<br />
such as carpets, headliners, filtration and needle punch felts.<br />
1.39 The details of sales turnover projected are given in Exhibit 1.2.<br />
Cost of Production<br />
Major Raw materials<br />
1.40 The main raw materials used and the corresponding prevailing indicative prices are<br />
as follows :<br />
Major Raw Material Landed Cost* ( Rs / kg )<br />
Polypropylene Staple Fibre (PPSF) 70<br />
* Inclusive of import duty of 20%<br />
# Polyester Staple Fibre (PSF) is also an alternate raw material.<br />
1.41 PPSF Specifications are as follows :<br />
Property Values<br />
Fineness 5 - 12 dtex<br />
Tenacity (gm / den) 4.4 - 5.4 (� 5%)<br />
% Elongation 25 - 60<br />
Crimps per cm 4.6 - 5.4<br />
% Oil Pick-up 0.50 � 0.05<br />
1.42 The major suppliers of these raw materials are :<br />
Indian :<br />
(a) Zenith Fibres, Gujarat<br />
(b) Sanghi Synthetics, Hyderabad<br />
13
Power Cost<br />
International :<br />
(a) Polyfil, Belgium<br />
(b) Asota, Austria<br />
(c) DOMO, Germany<br />
(d) Synthetic Fibres, USA<br />
Appendix – 5A (Contd..)<br />
1.43 The total connected load is 500kW. The power cost would be 3% of sales amounting<br />
to Rs. 1.30 Cr. (at 100% capacity utilisation)<br />
Repair & Maintenance<br />
1.44 The repair and maintenance cost would be at 1% of the Plant & Machinery cost at Rs.<br />
0.30 Cr increasing 10% yearly upto it reaches 2.5 %.<br />
Manpower, Salaries and Wages<br />
1.45 The manpower requirements and the salary structure is given in Exhibit 1.4.<br />
1.46 The total manpower requirement comprising of supervisors, machine<br />
operators, helpers and the managerial cadre would be 78 nos incurring a cost of<br />
Rs. 0.89 Cr.<br />
Factory and Overhead Expenses<br />
1.47 The items covered under this head are establishment expenses, travel expenses,<br />
packaging expenses, etc. and amount to Rs. 0.60 Cr. in the first year.<br />
Marketing and Promotional Expenses<br />
1.48 The promotion of geotextiles will call for expenditure on this account and a provision<br />
of 1.5% of sales accounting to Rs. 0.65 Cr which has been made uniformly over the years (at<br />
100% capacity utilisation).<br />
14
Interest and Depreciation<br />
Appendix – 5A (Contd..)<br />
1.49 The prevailing interest rate for long term under Technological Upgradation Fund<br />
(TUF) is 5% and short term borrowed funds is taken at 11% per annum .<br />
1.50 The repayment of loans has been assumed for 10 years with two years moratorium<br />
(2+8).<br />
1.51 The depreciation rates as per the Company Law and Income-Tax Ready Reckoner<br />
have been worked out for Straight Line and WDV Method basis.<br />
1.52 The current corporate tax rate is assumed at 35% and the surcharge is assumed at<br />
2.5% per annum.<br />
Profitability, Break-even, IRR and Payback .<br />
1.53 The Sales turnover increases from Rs 21.17 Cr in the first year to Rs 38.10 Cr. from<br />
the 4 th year onwards.<br />
1.54 The PBT increases from Rs 1.43 Cr. in the first year to Rs. 6.55 Cr. from the 4 th year<br />
onwards. (See Exhibit 1.5)<br />
1.55 The Break Even of the project is at 50.63%.<br />
1.56 The Internal Rate of Return ( IRR ) has been worked out at 12.45%.<br />
1.57 The Payback period for the project is 6.32 years .<br />
Sensitivity Analysis<br />
1.58 The sensitivity analysis has been presented in the Exhibit 1.6<br />
Common Testing Facilities :<br />
1.59 Indian testing centres like IIT (Mumbai, Delhi), Central Road Research Institute<br />
(CRRI), BTRA, SASMIRA, etc. currently cater to the testing requirements.<br />
15
1.60 Some of the leading International Geosynthetic Test Laboratories are :<br />
Testing Centre Country<br />
Geosynthetic Testing Services Australia<br />
Ghent University Belgium<br />
Activation Laboratories Ltd. Canada<br />
LGA Geosynthetic Institute Germany<br />
tBU Germany<br />
Appendix – 5A (Contd..)<br />
Geospec Ltd. United Kingdom<br />
SGS Testing Services L.L.C. United States<br />
TRI/Environmental Inc. United States<br />
1.61 The various properties that need to be tested and researched for Geotextiles and<br />
Geogrids are listed below:<br />
Properties Tests<br />
Physical Properties • Mass per unit area (thickness)<br />
• Determination of apparent opening<br />
size of geotextiles<br />
Mechanical Properties • Tensile properties of geotextiles and<br />
geogrid.<br />
• Grab breaking load and elongation<br />
for geotextiles.<br />
• Index puncture testing.<br />
• Evaluating the unconfined tension<br />
creep behaviour of geotextiles.<br />
• Pyramid puncture resistance for<br />
geotextiles.<br />
• Connectivity testing for geogrids.<br />
• Mullen burst test.<br />
Hydraulic Properties • Inplane flow testing.<br />
• Cross plane flow testing.<br />
• Measuring the soil geotextile<br />
clogging system.<br />
• Emersion procedures for evaluating<br />
the chemical resistance of<br />
geotextiles.<br />
• Ultraviolet testing for polymers<br />
• Building of road pavement for simulating real life testing.<br />
16
Appendix – 5A (Contd..)<br />
1.62 TECS, interaction with tBU, Germany one of the Testing Centre for<br />
geotextiles/geogrids has shown interest in collaborating to set-up a testing centre in India. For<br />
further follow-up, the address is given below:<br />
tBU<br />
Gutenberg Str. 29<br />
48268 Greven, Germany<br />
Tel: +(49) 2571/9872-0<br />
Email: tbu@tbu-gmbh.de<br />
website: www.tbu-gmbh.de<br />
DEVELOPMENT AND PROMOTI<strong>ON</strong>AL MEASURES :<br />
1.63 Global consumption of geotextiles has grown phenomenally during the last three<br />
decades from 30 mn mtr. in 1975 to 1400 mn mtr. in 2000-01 and expected to touch 1650<br />
mn mtr. in 2003-04 and further to 2490 mn mtr. by 2007-08.<br />
1.64 The developed regions of N. America & Europe accounted for 80% of the total<br />
consumption reflecting the importance of geotextiles in the road and other infrastructure<br />
projects.<br />
1.65 The new emerging markets are China and India.<br />
Global Practices:<br />
1.66 In Germany the Regulatory Framework can be understood in the light of the<br />
regulations since 1970s titled as “GEOSYN<strong>THE</strong>TICS IN ROAD C<strong>ON</strong>STRUCTI<strong>ON</strong> -<br />
GERMAN REGULATI<strong>ON</strong>S.”<br />
1.67 Germany tested geotextiles for road construction work in 1970s on large-scale tests<br />
on-site. In 1977, at the first International Conference on the Use of Fabrics in Geotechnics,<br />
held in Paris, the Norwegian Road Research Laboratory developed a system to test the<br />
mechanical strength of the textiles by a so called CBR-tensile-test and in addition by a cone-<br />
drop-test and used the results to define the suitability for the use under 4 different classes of<br />
fill over soft soil.<br />
1.68 The Germans adopted the CBR-tensile-test as Plunger-Puncture-Test and classified<br />
the nonwovens in five Geotextile-Robustness-Classes (GRC). To find out the necessary GRC<br />
for a given site, they classified the fill in 5 classes on the basis of the diameter and the<br />
coarseness/sharpness of aggregates. The table below shows the GRC classification.<br />
17
GRC classification:<br />
Product Group Nonwovens<br />
Geotextile-Robustness-<br />
Classes<br />
Plunger-puncture-force<br />
(kN)<br />
Appendix – 5A (Contd..)<br />
Mass per unit area<br />
(gsm)<br />
GRC1 >= 0.5 >= 80<br />
GRC2 >= 1.0 >= 100<br />
GRC3 >= 1.5 >= 150<br />
GRC4 >= 2.5 >= 250<br />
GRC5 >= 3.5 >= 300<br />
1.69 The German regulations or for that matter the regulations anywhere in the<br />
developed countries don’t mandate the usage of geotextiles but it is mostly based on the<br />
benefits derived like, increase in road life to 4 -5 times than the roads built today, minimising<br />
road maintenance (7 to 8 years) and improving riding quality without potholes and reflective<br />
cracking.<br />
1.70 China is under mass infrastructure construction and hence the largest market of<br />
geosynthetics in the current decade (2001-2010). In recent years, China has invested $ 86.7<br />
billion in improving its road- railway network, new airports, water conservancy projects, etc.<br />
1.71 At the same time the promotional effort done by the Chinese government to increase<br />
the usage of geosynthetics in these infrastructure projects are to be appreciated. China<br />
International Geosynthetics Exhibition is held every year.<br />
1.72 The Chinese are using an integrated approach within various agencies in the<br />
promotion of geosynthetics. There are atleast 15 agencies (as listed below) co-operating with<br />
each other to create awareness and promote usage of geosynthetics. Numerous discussion<br />
meetings are held throughout China each year to discuss the applications of geosynthetic<br />
products.<br />
1.73 In 2002 alone, 130 national level technical communications have been issued, in<br />
which research, experimental works, manufacturing, the use of geosynthetics in engineering<br />
projects and issues are reported.<br />
1.74 List of Chinese Agencies collaborating with each other are as follows:<br />
18
1. China Technology Market Association (CTMA)<br />
2. IGS-China Chapter<br />
3. Chinese Technical Association on Geosynthetics (CTAG)<br />
4. China Nonwovens Technical Association (CNTA)<br />
5. Shanghai Geosynthetics Technical Association (SGTA)<br />
6. China Association for Science & Technology<br />
7. China Hydraulic Engineering Society<br />
8. China Communication Association<br />
9. China Railway Society<br />
10. Chinese Society for Hydroelectric Engineering<br />
11. Chinese Society for Environmental Science<br />
12. China Civil Engineering Society<br />
13. China Textile Engineering Society<br />
14. CNTA Science & Technology Co. Ltd.<br />
15. CMP Asia Exhibitions & Paperloop Inc.<br />
Appendix – 5A (Contd..)<br />
1.75 It is interesting to note here that after the disastrous flooding of Yangste River in<br />
1998, Prime Minister, Zhu Rong Yi issued a document in which he encouraged Engineers<br />
to use geosynthetic products in their work. This shows the level of involvement in<br />
increasing the usage of geosynthetics in China. In 2001-02 China alone consumed 250 mn<br />
sq. mtrs of geosynthetics.<br />
PROMOTI<strong>ON</strong>AL EFFORTS IN INDIA:<br />
1.76 In India poor road conditions and high maintenance cost requires serious attention and<br />
the solution lies in use of geotextiles which gives increased road life to 4 - 5 times than the<br />
roads built today, minimising road maintenance (7 to 8 years) and improving riding quality<br />
without potholes and reflective cracking.<br />
1.77 Indian investment in the infrastructure projects like Roads & Railways alone stands at<br />
Rs. 1,84,000 Cr. ($ 40 bn) and the usage of geosynthetics (geotextiles & geogrids) has not<br />
been significant compared to the initiatives taken by developed/developing countries like<br />
China, Korea, etc.<br />
1.78 Indian Road Congress publication on “SPECIFICATI<strong>ON</strong>S FOR ROAD AND<br />
BRIDGE WORKS” (Fourth Revision) under section 700 gives the use Geosynthetics<br />
(Geotextile/Geogrid/Geonet/Geomembrane/Geocomposite) under Clause nos. 701, 702, 703<br />
& 704.<br />
19
Appendix – 5A (Contd..)<br />
1.79 Indian Road Congress Special Publication 59 (IRC: SP: 59 - 2002) has published<br />
“GUIDELINES FOR USE <strong>OF</strong> GEOTEXTILES IN ROAD PAVEMENTS AND<br />
ASSOCIATED WORKS” which gives the details of the properties and installation of<br />
geotextiles for various soil conditions.<br />
1.80 Under Section 700 of the Indian Road Congress Clause no. 704 “PROTECTI<strong>ON</strong><br />
WORKS WITH GEOSYN<strong>THE</strong>TICS” give the use of Geogrids for various applications and<br />
the details about construction and installation.<br />
1.81 Special Publication for Geogrids does not exist which should be drafted by the Indian<br />
Road Congress (IRC)<br />
1.82 Ministry of Road Transport and Highways (MORTH) should encourage the usage of<br />
geotextiles. The factors that affect the potential usage of geotextiles in the Indian context are :<br />
� Traditional geotechnical and civil engineering practices.<br />
� Resistance to adapt to geotextiles than conventional methods.<br />
1.83 As per the industry feedback mandation should exist to incorporate geotextile<br />
layer in the road works from design stages itself as it increases the road life by 30%<br />
hence reducing maintenance. Such mandation should exist for geogrid also.<br />
1.84 All geotextiles and geogrids should be enforced with mandatory testing clause<br />
before installation.<br />
1.85 The Inter-Ministerial Co-ordination is one of the workable solutions for the<br />
promotion of geotextiles and geogrids in the country with Ministry of Textiles taking the<br />
lead role.<br />
1.86 All those concerned like, Ministry of Road Transport & Highway (MORTH),<br />
Ministry of Environment & Forests (MOEF), Ministry of Water Resources (MOWR),<br />
Ministry of Railways (MOR) & Ministry of Urban Affairs are important government bodies<br />
need to play active role in the promotion of geotextiles and geogrids.<br />
1.87 The Indian Geotextile and Geogrid manufacturers should be given representation<br />
for all the inter-ministerial and departmental committees as well as Bureau of Indian<br />
Standards for participation in the policy matters.<br />
20
Appendix – 5A (Contd..)<br />
1.88 In view of the ongoing infrastructural development activities in the country the usage<br />
of geotextiles / geogrids should be made mandatory within the next three to six months.<br />
1.89 The technical expertise exists in the country for conceptualising the requirement of<br />
the geotextile and geogrid fabric in applications like roads, railways, bridges, embankments,<br />
etc.<br />
1.90 Expertise in Design of Civil and Geotechnical structures exists with research<br />
institutes like CRRI, RDSO, BTRA etc. and institutions like SASMIRA, IIT - Delhi &<br />
Mumbai, NHAI, etc. Thus the country possess human resource talent pool.<br />
1.91 The Ministry of Human Resource Development can introduce specialisation courses<br />
for Geosynthetics (geotextiles and geogrids) in Civil & Textile Engineering courses at<br />
graduation and post-graduation levels for churning professionals in this sector.<br />
1.92 GoI should relax the criteria for domestic players like long term testing clause of<br />
10,000 hrs for Creep Behaviour Test to 2,000 hrs giving them an opportunity to prove their<br />
product.<br />
1.93 To advocate the usage of geotextiles and geogrids, GoI can give concessions like the<br />
absorption of the additional project cost on account of usage of geotextiles and geogrids.<br />
1.94 Imported geotextile and geogrid should be levied with additional customs duty (to<br />
be decided by the government) to protect the Indian players who would be in the nascent<br />
stages of development. This would also encourage International collaborations with Indian<br />
players to increase the competitiveness.<br />
21
Appendix – 5A (Contd..)<br />
22
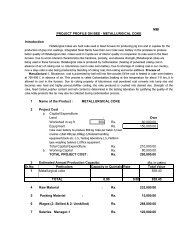
EXHIBIT 1.1<br />
Appendix – 5A (Contd..)<br />
PROJECT COST<br />
(LAND, BUILDINGS, PROCESS PLANT & MACHINERY, UTILITIES & O<strong>THE</strong>R<br />
ASSETS)<br />
Project Cost<br />
1<br />
2<br />
3<br />
4<br />
Land<br />
Area: 3.0 acres ( 12138 Sq Mtrs)<br />
Rate: (Rs.1200 /Sq. Mtr)<br />
Buildings<br />
Plant Area, Office, Godown, Lab, Service Area etc.)<br />
Built-up Area : 4500 Sq. Mtrs<br />
Avg Rate : Rs. 4500 /Sq. Mtrs<br />
Process Plant & Equipment<br />
(including Finishing & Coating Equipment)<br />
Utility & Other equipments<br />
(Electricals, Piping, Water supply system, Compressors<br />
Fire Fighting, Material Handling etc.)<br />
5 Testing Facilities (In-house)<br />
6<br />
Misc. Fixed Assets<br />
(Furniture & Fixtures, Office Equipment,etc.)<br />
7 Project Engineering & Consultancy charges (2.5%)<br />
8<br />
Preliminary & Pre-operative Expenses (12%)<br />
(Company Formation, Interest during construction,<br />
pre-production expenses, etc.)<br />
9 Contingency (10 %)<br />
10 Total<br />
11 Margin Money for Working Capital<br />
12 Total Project Cost<br />
(Rs. Cr.)<br />
1.46<br />
2.03<br />
30.25<br />
2.00<br />
0.35<br />
0.15<br />
0.84<br />
4.29<br />
4.14<br />
45.50<br />
1.32<br />
46.83<br />
23
ITEM<br />
EXHIBIT 1.2<br />
Appendix – 5A (Contd..)<br />
ESTIMATI<strong>ON</strong> <strong>OF</strong> SALES REVENUE<br />
(Rs. Cr.)<br />
YEAR <strong>OF</strong> OPERATI<strong>ON</strong><br />
I II III IV V VI VII VIII IX X<br />
Maximum Carding Capacity (Kg/hr) 600 600 600 600 600 600 600 600 600 600<br />
80% efficiency 480 480 480 480 480 480 480 480 480 480<br />
Capacity Utilisation 50% 60% 75% 90% 90% 90% 90% 90% 90% 90%<br />
Actual Production per hour 240 288 360 432 432 432 432 432 432 432<br />
Production per day (kg) 5760 6912 8640 10368 10368 10368 10368 10368 10368 10368<br />
Production for 300 working days (kg) 1728000 2073600 2592000 3110400 3110400 3110400 3110400 3110400 3110400 3110400<br />
Selling Price (Rs/kg) 125.00 125.00 125.00 125.00 125.00 125.00 125.00 125.00 125.00 125.00<br />
Sales Revenue (Rs. Cr) 21.60 25.92 32.40 38.88 38.88 38.88 38.88 38.88 38.88 38.88<br />
Value Loss ( 2% ) 0.43 0.52 0.65 0.78 0.78 0.78 0.78 0.78 0.78 0.78<br />
Net Sales Revenue (Rs. Cr) 21.17 25.40 31.75 38.10 38.10 38.10 38.10 38.10 38.10 38.10<br />
24
ITEM<br />
Factory Related<br />
NO. <strong>OF</strong><br />
M<strong>ON</strong>THS<br />
MARGIN<br />
(%)<br />
W.CAP<br />
REQMT<br />
EXHIBIT 1.3<br />
REQUIREMENT <strong>OF</strong> WORKING CAPITAL<br />
Appendix – 5A (Contd..)<br />
YEAR I YEAR II YEAR III YEAR IV YEAR V<br />
MARGIN<br />
M<strong>ON</strong>EY<br />
BANK<br />
FINANCE<br />
W.CAP<br />
REQMT<br />
MARGIN<br />
M<strong>ON</strong>EY<br />
Raw materials & other<br />
commodities<br />
2.00 25.00 2.12 0.53 1.59 2.54 0.64 1.91 3.18 0.79 2.38 3.81 0.95 2.86 3.81 0.95 2.86<br />
Goods in process 0.10 25.00 0.13 0.03 0.09 0.15 0.04 0.11 0.19 0.05 0.14 0.22 0.06 0.17 0.22 0.06 0.17<br />
Finished Goods 1.00 25.00 1.29 0.32 0.97 1.53 0.38 1.15 1.90 0.47 1.42 2.27 0.57 1.70 2.28 0.57 1.71<br />
A/c Receivable 1.00 25.00 1.76 0.44 1.32 2.12 0.53 1.59 2.65 0.66 1.98 3.18 0.79 2.38 3.18 0.79 2.38<br />
Cash in hand<br />
Salaries & wages 1.00 0.00 0.07 0.00 0.07 0.08 0.00 0.08 0.08 0.00 0.08 0.09 0.00 0.09 0.09 0.00 0.09<br />
Power 1.00 0.00 0.05 0.00 0.05 0.06 0.00 0.06 0.08 0.00 0.08 0.10 0.00 0.10 0.10 0.00 0.10<br />
Repairs & Maintenance 1.00 0.00 0.03 0.00 0.03 0.03 0.00 0.03 0.04 0.00 0.04 0.05 0.00 0.05 0.06 0.00 0.06<br />
Sales, Marketing & Training<br />
Expenses<br />
1.00 0.00 0.03 0.00 0.03 0.03 0.00 0.03 0.04 0.00 0.04 0.05 0.00 0.05 0.05 0.00 0.05<br />
Factory & Office overheads 1.00 0.00 0.05 0.00 0.05 0.06 0.00 0.06 0.07 0.00 0.07 0.08 0.00 0.08 0.08 0.00 0.08<br />
Total Requirement 5.48 1.32 4.15 6.53 1.58 4.95 8.15 1.98 6.17 9.75 2.37 7.39 9.79 2.37 7.42<br />
BANK<br />
FINANCE<br />
W.CAP<br />
REQMT<br />
MARGIN<br />
M<strong>ON</strong>EY<br />
BANK<br />
FINANCE<br />
W.CAP<br />
REQMT<br />
MARGIN<br />
M<strong>ON</strong>EY<br />
BANK<br />
FINANCE<br />
W.CAP<br />
REQMT<br />
MARGIN<br />
M<strong>ON</strong>EY<br />
(Rs.Cr)<br />
BANK<br />
FINANCE<br />
25
ITEM<br />
Factory Related<br />
NO. <strong>OF</strong><br />
M<strong>ON</strong>THS<br />
MARGIN<br />
(%)<br />
W.CAP<br />
REQMT<br />
EXHIBIT 1.3 (Contd..)<br />
REQUIREMENT <strong>OF</strong> WORKING CAPITAL<br />
Appendix – 5A (Contd..)<br />
YEAR VI YEAR VII YEAR VIII YEAR XI YEAR X<br />
MARGIN<br />
M<strong>ON</strong>EY<br />
BANK<br />
FINANCE<br />
W.CAP<br />
REQMT<br />
MARGIN<br />
M<strong>ON</strong>EY<br />
Raw materials & other<br />
commodities<br />
2.00 25.00 3.81 0.95 2.86 3.81 0.95 2.86 3.81 0.95 2.86 3.81 0.95 2.86 3.81 0.95 2.86<br />
Goods in process 0.10 25.00 0.22 0.06 0.17 0.22 0.06 0.17 0.22 0.06 0.17 0.23 0.06 0.17 0.23 0.06 0.17<br />
Finished Goods 1.00 25.00 2.29 0.57 1.72 2.29 0.57 1.72 2.30 0.57 1.72 2.30 0.58 1.73 2.31 0.58 1.73<br />
A/c Receivable 1.00 25.00 3.18 0.79 2.38 3.18 0.79 2.38 3.18 0.79 2.38 3.18 0.79 2.38 3.18 0.79 2.38<br />
Cash in hand<br />
Salaries & wages 1.00 0.00 0.09 0.00 0.09 0.10 0.00 0.10 0.10 0.00 0.10 0.11 0.00 0.11 0.12 0.00 0.12<br />
Power 1.00 0.00 0.10 0.00 0.10 0.10 0.00 0.10 0.10 0.00 0.10 0.10 0.00 0.10 0.10 0.00 0.10<br />
Repairs & Maintenance 1.00 0.00 0.06 0.00 0.06 0.06 0.00 0.06 0.06 0.00 0.06 0.06 0.00 0.06 0.06 0.00 0.06<br />
Sales, Marketing & Training<br />
Expenses<br />
1.00 0.00 0.06 0.00 0.06 0.06 0.00 0.06 0.06 0.00 0.06 0.06 0.00 0.06 0.06 0.00 0.06<br />
Factory & Office overheads 1.00 0.00 0.05 0.00 0.05 0.05 0.00 0.05 0.05 0.00 0.05 0.05 0.00 0.05 0.05 0.00 0.05<br />
Total Requirement 9.86 2.37 7.49 9.87 2.38 7.50 9.88 2.38 7.51 9.89 2.38 7.52 9.91 2.38 7.53<br />
BANK<br />
FINANCE<br />
W.CAP<br />
REQMT<br />
MARGIN<br />
M<strong>ON</strong>EY<br />
BANK<br />
FINANCE<br />
W.CAP<br />
REQMT<br />
MARGIN<br />
M<strong>ON</strong>EY<br />
BANK<br />
FINANCE<br />
W.CAP<br />
REQMT<br />
MARGIN<br />
M<strong>ON</strong>EY<br />
(Rs.Cr)<br />
BANK<br />
FINANCE<br />
26
EXHIBIT 1.4<br />
MANPOWER REQUIREMENTS<br />
Nos Monthly Total Monthly Annual<br />
General Manager 1 30000 30000 360000<br />
Production Manager 1 20000 20000 240000<br />
Machine Operators 24 6000 144000 1728000<br />
Machine Helper (Semi Skilled) 15 3000 45000 540000<br />
Material Handling 3 6000 18000 216000<br />
R&D, Testing<br />
Marketing & Sales<br />
6 8000 48000 576000<br />
Marketing Head 1 25000 25000 300000<br />
Sales Team 3 12000 36000 432000<br />
Clerical Staff (Admin, Accounts etc) 10 6000 60000 720000<br />
Other Staff (Peon, Security) 5 3000 15000 180000<br />
Maintenance Department 9 10000 90000 1080000<br />
TOTAL 78 531000 6372000<br />
Fringe Benefits (40 % of the above) 2548800<br />
Total Wage Bill (Annual) Rs. :<br />
Total Wage Bill (Annual) Rs. Cr. :<br />
Salary + Other Benefits =<br />
8920800.00<br />
0.89208<br />
Appendix – 5A (Contd..)<br />
27
EXHIBIT 1.5<br />
Appendix – 5A (Contd..)<br />
PR<strong>OF</strong>ITABILITY STATEMENT AND COMPUTATI<strong>ON</strong> <strong>OF</strong> TAX<br />
(Rs.Cr)<br />
FINANCIAL YEAR <strong>OF</strong> OPERATI<strong>ON</strong><br />
ACCOUNT HEAD<br />
I II III IV V VI VII VIII IX X<br />
Revenue<br />
Net Sales Turnover 21.17 25.40 31.75 38.10 38.10 38.10 38.10 38.10 38.10 38.10<br />
Total Revenue<br />
Expenses<br />
21.17 25.40 31.75 38.10 38.10 38.10 38.10 38.10 38.10 38.10<br />
Raw Materials 12.70 15.24 19.05 22.86 22.86 22.86 22.86 22.86 22.86 22.86<br />
Power 0.65 0.78 0.97 1.17 1.17 1.17 1.17 1.17 1.17 1.17<br />
Repair & Maintenance 0.30 0.30 0.45 0.61 0.76 0.76 0.76 0.76 0.76 0.76<br />
Salaries & wages 0.89 0.94 0.98 1.03 1.08 1.14 1.20 1.26 1.32 1.38<br />
Marketing & Promotional Expenses 0.32 0.38 0.48 0.57 0.57 0.57 0.57 0.57 0.57 0.57<br />
Factory & Office Overheads 0.60 0.70 0.85 0.95 0.95 0.95 0.95 0.95 0.95 0.95<br />
Interest on S.T. Loans 0.46 0.54 0.68 0.81 0.82 0.82 0.82 0.83 0.83 0.83<br />
Cost of Sales 15.92 18.88 23.47 28.00 28.21 28.27 28.33 28.39 28.45 28.52<br />
Depreciation (St.Line) 2.27 2.27 2.27 2.27 2.27 2.27 2.27 2.27 2.27 2.27<br />
Amort. of Expenses 0.14 0.14 0.14 0.14 0.14 0.14 0.00 0.00 0.00 0.00<br />
Interest on L.T Loan 1.40 1.40 1.32 1.14 0.97 0.79 0.61 0.44 0.26 0.09<br />
Profit Before Tax 1.43 2.70 4.56 6.55 6.52 6.63 6.89 7.00 7.12 7.22<br />
Tax 0.15 0.28 0.48 0.69 0.56 2.21 2.51 2.72 2.88 3.01<br />
Profit After Tax 1.28 2.42 4.08 5.86 5.95 4.42 4.37 4.29 4.24 4.22<br />
Dividend 0.00 0.00 0.94 0.94 0.94 1.87 1.87 1.87 1.87 1.87<br />
Profits For Appropriation 1.28 2.42 3.14 4.92 5.02 2.55 2.50 2.42 2.37 2.34<br />
28
EXHIBIT 1.5 (Contd..)<br />
Appendix – 5A (Contd..)<br />
PR<strong>OF</strong>ITABILITY STATEMENT AND COMPUTATI<strong>ON</strong> <strong>OF</strong> TAX<br />
(Rs.Cr)<br />
FINANCIAL YEAR <strong>OF</strong> OPERATI<strong>ON</strong><br />
ACCOUNT HEAD<br />
COMPUTATI<strong>ON</strong> <strong>OF</strong> TAX<br />
I II III IV V VI VII VIII IX X<br />
Profit after interest before depreciation 3.71 4.97 6.83 8.82 8.79 8.90 9.16 9.28 9.39 9.50<br />
Depr.(WDV) to be claimed 10.16 14.15 15.01 12.62 7.18 2.58 1.98 1.52 1.17 0.90<br />
Depreciation claimed 3.71 4.97 6.83 8.82 7.18 2.58 1.98 1.52 1.17 0.90<br />
Depr. carried forward 6.45 9.17 8.18 3.80 0.00 0.00 0.00 0.00 0.00 0.00<br />
Taxable Profit 0.00 0.00 0.00 0.00 1.61 6.32 7.19 7.76 8.22 8.59<br />
Profit Before Tax (Book) 1.43 2.70 4.56 6.55 6.52 6.63 6.89 7.00 7.12 7.22<br />
Minimum Alternate Tax 0.15 0.28 0.48 0.69 0.00 0.00 0.00 0.00 0.00 0.00<br />
Tax (Actual) 0.00 0.00 0.00 0.00 0.56 2.21 2.51 2.72 2.88 3.01<br />
Tax Provision 0.15 0.28 0.48 0.69 0.56 2.21 2.51 2.72 2.88 3.01<br />
29
Items<br />
EXHIBIT NO. 1.6<br />
SENSITIVITY ANALYSIS<br />
Profit after Tax (PAT)<br />
( assumed at 90 %<br />
capacity )<br />
Break Even<br />
(%)<br />
Internal<br />
Rate of<br />
Return<br />
(IRR) (%)<br />
Payback Period<br />
(Years)<br />
NORMAL VALUES 5.86 50.63 12.45 6.32<br />
Debt Equity Ratios<br />
(a) 2:1<br />
(b) 1:1<br />
Increase in Project Cost by<br />
10 %<br />
Decrease in Selling Price to<br />
Rs. 120/kg<br />
Increase in Selling Price to<br />
Rs. 130/kg<br />
Decrease in Raw Material<br />
Prices by 10%<br />
5.75<br />
51.58 12.55<br />
6.28<br />
6.03<br />
49.19 12.31<br />
6.39<br />
5.49 53.74 11.09 6.84<br />
4.53 56.95 10.23 7.23<br />
7.19 45.60 14.44 5.73<br />
7.73 43.04 15.72 5.38<br />
Appendix – 5A (Contd..)<br />
30
EXHIBIT NO. 1.6<br />
SENSITIVITY ANALYSIS<br />
Items Profit after Tax<br />
(PAT)<br />
( assumed at 90 %<br />
capacity )<br />
Break<br />
Even<br />
(%)<br />
Internal<br />
Rate of<br />
Return<br />
(IRR)<br />
(%)<br />
Appendix – 5A (Contd..)<br />
Payback<br />
Period<br />
(Years)<br />
NORMAL VALUES 5.86 50.63 12.45 6.32<br />
Debt Equity Ratios<br />
(a) 2:1<br />
(b) 1:1<br />
Increase in Project Cost<br />
by 10 %<br />
Decrease in Selling Price<br />
to Rs. 120/kg<br />
Increase in Selling Price<br />
to Rs. 130/kg<br />
Decrease in Raw<br />
Material Prices by 10%<br />
5.75<br />
51.58 12.55 6.28<br />
6.03<br />
49.19 12.31 6.39<br />
5.49 53.74 11.09 6.84<br />
4.53 56.95 10.23 7.23<br />
7.19 45.60 14.44 5.73<br />
7.73 43.04 15.72 5.38<br />
31
EXHIBIT NO. 1.7<br />
Appendix – 5A (Contd..)<br />
INTEGRATED APPROACH & INTER-MINISTERIAL CO-ORDINATI<strong>ON</strong> FOR<br />
USE <strong>OF</strong> GEOTEXTILES / GEOGRIDS IN VARIOUS PROJECTS<br />
Ministry of Road<br />
Transport &<br />
Highway(MORTH)<br />
Highways &<br />
Expressways<br />
Ministry of<br />
Environment &<br />
Forests (MOEF)<br />
Ministry Of Textile<br />
(MOT)<br />
To Lead & Coordinate<br />
Ministry of Water<br />
Resources<br />
(MOWR)<br />
For Policy changes &<br />
regulatory<br />
framework<br />
Landfill Irrigation<br />
Flood Control<br />
For Using Products<br />
Ministry of<br />
Railways<br />
(MOR)<br />
Track bed<br />
stabilisation<br />
Boulder<br />
Protection<br />
Ministry of<br />
Urban Affairs<br />
City Roads<br />
Landfill,<br />
Shore<br />
embankments<br />
Retaining<br />
Walls<br />
GT, GG GT, GG GT, GG GT, GG GT, GG<br />
Note : GT - Geotextile, GG - Geogrid.<br />
32
ANNEXURE I<br />
NEEDLE PUNCH PROJECT - LIST <strong>OF</strong> EQUIPMENTS<br />
1.0 1 Fibre Opening and Blending Plant<br />
4 Bale Opener Bx<br />
1 Tuft Blender FML 5<br />
1 Station for Separation SCB<br />
1 Blending Hopper BXM<br />
1 Fine Opener FOL<br />
2.0 1 Card Feeding Unit<br />
1 Chute feeder<br />
(for card working width : 3000 mm)<br />
1 Vibration Chute Feed, Type RS<br />
(for card working width : 3000 mm)<br />
1 Belt Weigher ME 2<br />
3.0 1 Carding Machine<br />
1 Super Servo-Card SSC 4-5 PC<br />
(working width : 3000 mm)<br />
Set Card Underframe and Platforms<br />
4.0 1 Crosslapper, Type Topliner CL 4002<br />
working width : 3000 mm<br />
layering width : 6000 mm<br />
5.0 1 Needle Felting Line<br />
1 Compressive Batt Feeder, CBF T 60<br />
1 Needle Loom, Di-Loom OD-II 60<br />
1 Drafting Unit, VE 4-60<br />
1 Feeding System<br />
Appendix – 5A (Contd..)<br />
33
1 Needle Loom, Di-Loom OUG-II 55<br />
1 Tension Control, TCW 55<br />
1 Cutting and Winding Device<br />
6.0 1 Thermo-Heat-Setting Stenter and Two-Bowl-Calender<br />
1 Santaframe - High Efficiency Single - Layer Drying Stenter<br />
1 Santabond - Two-Bowl Calender<br />
7.0 1 Electrical Drive Equipment<br />
Appendix – 5A (Contd..)<br />
AC and AC-S drives for all process influencing parts include. PLC, control<br />
cabinets, control desks and cable material are included in the machine prices.<br />
8.0 Optional Items<br />
1 Process-Control-System<br />
control of the plant by means of PC with 3 monitors<br />
1 Suction and Filter Unit, Type TD 30<br />
1 Thermal-Oil Generator/Chiller<br />
9.0 Finishing & Coating Equipment to be sourced separately from Technology<br />
suppliers like - Menzel<br />
Total Investment would be -- Rs. 26.38 Cr.<br />
(Machinery wise break-up could be obtained at the time of finalisation of project)<br />
Note: Includes cost of needle boards required for Carpet making.<br />
34
ANNEXURE II<br />
TEST LABORATORY EQUIPMENT (IN-HOUSE)<br />
No. Machine Name<br />
1. Universal Testing Machine<br />
2. Template & Weighing Scale<br />
3. Glass Beads & Others<br />
4. Permittivity Tester<br />
5. Thickness Tester<br />
6. Other miscellaneous items<br />
Total Investment required - Rs. 35,00,000 (Rs. 0.35 Cr.) approx.<br />
Appendix – 5A (Contd..)<br />
Note: Laboratory should be maintained for temperature and humidity control.<br />
35
Appendix – 5A (Contd..)<br />
36
Specifications/Properties<br />
Jute Geotextiles for<br />
Control of Surface Soil<br />
Erosion by Rain and Wind<br />
1. Weight<br />
(g/m2) at<br />
20% M.R.<br />
2. Threads/dm<br />
(MD x CD)<br />
3. Thickness<br />
(mm)<br />
292<br />
500<br />
730<br />
12 x 12<br />
6.5 x 4.5<br />
7 x 7<br />
2<br />
4<br />
6<br />
4. Width (cm) 122<br />
122<br />
122<br />
5. Open area<br />
(%)<br />
60<br />
50<br />
40<br />
ANNEXURE III<br />
PROPERTIES <strong>OF</strong> JUTE GEOTEXTILES<br />
Jute Geotextile<br />
for Separation<br />
and Filtration<br />
Weight<br />
(g/m2) at 20%<br />
M.R.<br />
Threads/dm<br />
(MD x CD)<br />
Thickness<br />
(mm)<br />
760<br />
760<br />
1200<br />
102 x 39<br />
102 x 39<br />
102 x 39<br />
2<br />
2<br />
2<br />
Width (cm) 76<br />
76<br />
76<br />
Strength<br />
(kN/m)<br />
(MD x CD)<br />
20 x 20<br />
20 x 20<br />
21 x 21<br />
Jute Geotextile<br />
for Filtration<br />
and Drainage<br />
Weight<br />
(g/m2) at<br />
20% M.R.<br />
Thickness<br />
(mm)<br />
500<br />
1000<br />
4<br />
8<br />
Width (cm) 150<br />
150<br />
Strength<br />
(kN/m)<br />
(MD x CD)<br />
Elongation<br />
at break (%)<br />
(MD x CD)<br />
4 x 5<br />
6 x 7<br />
20 x 25<br />
20 x 25<br />
Appendix – 5A (Contd..)<br />
Prefabricated Drains<br />
for Accelerated<br />
Consolidation of Soft Soil<br />
Material ¾ Coirwicks<br />
within<br />
jute sheath<br />
Width (mm) ¾ 100<br />
Thickness<br />
(mm)<br />
Strength<br />
(kN)/100<br />
mm<br />
Pore size<br />
(O90)<br />
(micron)<br />
¾ 5<br />
¾ 45<br />
¾ 300<br />
37
Jute Geotextiles for<br />
Control of Surface Soil<br />
Erosion by Rain and Wind<br />
6. Strength<br />
(kN/m)<br />
(MD x CD)<br />
7. Water<br />
holding<br />
capacity (%)<br />
on dry<br />
weight<br />
10 x 10<br />
10 x 7.5<br />
12 x 12<br />
400<br />
500<br />
500<br />
Jute Geotextile<br />
for Separation<br />
and Filtration<br />
Elongation at<br />
break (%)<br />
(MD x CD)<br />
Pore size<br />
(O90)<br />
Micron<br />
Water<br />
permeability<br />
at 10 cm<br />
water head<br />
(l/m2/s)<br />
Puncture<br />
resistance<br />
(N/cm2)<br />
10 x 10<br />
10 x 10<br />
10 x 10<br />
300<br />
300<br />
150<br />
50<br />
50<br />
20<br />
380<br />
380<br />
400<br />
Jute Geotextile<br />
for Filtration<br />
and Drainage<br />
Pore size<br />
(O90)<br />
Micron<br />
Co-eff. of<br />
water<br />
permitivity<br />
(m/s)<br />
500<br />
300<br />
3.4 x 10 -3<br />
3.4 x 10 -4<br />
Appendix – 5A (Contd..)<br />
Prefabricated Drains<br />
for Accelerated<br />
Consolidation of Soft Soil<br />
Discharge ¾ 13<br />
capacity at<br />
50 kPa (l/s)<br />
38
GEOGRID PROJECT<br />
Appendix – 5A (Contd...)<br />
SECTI<strong>ON</strong> I : PRODUCT BRIEF, APPLICATI<strong>ON</strong> AREAS & MARKET<br />
POTENTIAL<br />
2.1 Geogrids are matrix like materials with large open spaces called apertures, which<br />
are typically 10 to 100 mm between the ribs called longitudinal and transverse<br />
respectively. Geogrids can be manufactured from different materials such as PE,<br />
polyester, aramide, glass, etc.<br />
2.2 Geogrid can be manufactured by extrusion, weaving, knitted, welding etc.<br />
2.3 Woven Geogrid are made from high tenacity, high modules polyester yarns and<br />
are coated with any one of the materials like PVC, latex, bitumen etc.<br />
2.4 Reinforcement is the main function of geogrids.<br />
2.5 Geogrids can be produced in wide ranges with strength parameters assumed are 20<br />
kN/m to 200 kN/m with aperture size varying from 10x10 mm to 100x100 mm.<br />
Major Application and End-usages :<br />
• Geogrids : are used for re-enforcement applications like :<br />
Why Woven Geogrid?<br />
o Reinforcement of steep slopes,<br />
o Embankment of soft soils,<br />
o Stabilisation of shallow clay slopes,<br />
o Support and capping of landfills,<br />
o As gabions for wall construction,<br />
o As asphalt reinforcement in pavements<br />
2.6 There are around 15 renowned geogrid manufacturers in the world, of which 9 are<br />
producing woven geogrids. The list is given below* :<br />
No. Name of the Company Manufacturing Process<br />
1. ACE Geosynthetics Enterprises Co. Ltd. Woven<br />
2. Amoco Fabric & Fibres Co. Ltd. Composite, non-woven, cross-bonded grid<br />
3. Hueskar Inc. Woven, knitted<br />
4. Luchenhaus North America Inc. Woven, knitted<br />
5. Macaferri Woven, knitted, extruded<br />
6. Mirafi Construction Products Woven<br />
7. Naue Fasertechnik Laid and Welded Flat bars<br />
8. Synteen Technical Fabrics Woven<br />
9. Saint Gobain Technical Fabrics America Inc. Knitted, non- wovens<br />
10. SI Geosolutions Woven<br />
39
Appendix – 5A (Contd...)<br />
No. Name of the Company Manufacturing Process<br />
11. Strata Systems Inc. Knitted<br />
12. Tennax Corporation Extrusion<br />
13. Tensar Earth Technologies Inc. Integrally Formed<br />
14. Webtec Inc. Woven<br />
15. Xtec Inc. Woven<br />
* Source : GFR 2004<br />
2.7 From the above list it can be concluded that India should also follow the global<br />
trend and encourage woven geogrid usage.<br />
2.8 It should also be noted that the project cost required to set-up a woven geogrid<br />
project is less compared to alternate geogrids produced by different technologies like<br />
knitted or extrusion. The project cost aspects are covered in section II.<br />
2.9 Presented below is the comparative analysis of geogrids produced by Woven,<br />
Knitted and Extruded process* :<br />
Properties<br />
Ultimate tensile strength<br />
Woven Knitted Extruded<br />
(US) (kN/m) {MD/CD} 152.9 / 34.6 147.60 / 30 144 / NA<br />
Creep<br />
(kN/m)<br />
Related Strength 100.5 89.2 62.9<br />
Design<br />
(kN/m)<br />
Strength (DS) 79.2 77.1 59.9<br />
Ratio of DS / US (%) 52 52 42<br />
* Source : GFR 2004<br />
Notes : MD - Machine Direction, CD - Cross Direction<br />
Creep related strength : As per ASTM D 5262, for a minimum of 10,000 hrs and<br />
extrapolate for 75 years.<br />
2.10 The machinery for woven geogrids has broad based end product coverage of the<br />
following :<br />
• Insect nets<br />
• Woven Geotextiles (upto strength 600 kN/m)<br />
• Leno Scrim Fabrics<br />
• Grids from different materials like glass, polyester, etc.<br />
2.11 As per the discussions with the Industry Experts the country has used 6 Lakhs sq.<br />
mt. of woven geogrids for the following projects :<br />
• Kanpur By-Pass<br />
• Nagpur - MSRDC Project<br />
• Indore Project<br />
• Powai Flyover Project, Mumbai<br />
• Hyderabad Flyover<br />
• Kerala State Projects<br />
40
Emerging Market Potential - Global and Indian<br />
US Market Split-up for Geosynthetics # : (Value-wise) 2001-02<br />
Geogrid<br />
5%<br />
Geomembrane<br />
12%<br />
Geonet<br />
3%<br />
Others<br />
5%<br />
US Market Split-up for Geosynthetics # : (tonnes) 2001-02<br />
Geogrid<br />
6875<br />
Geomembrane<br />
17760<br />
# Source : Freedonia Group<br />
Geonet<br />
5032<br />
USA Market Potential # : Geogrid<br />
Other<br />
7252<br />
Appendix – 5A (Contd...)<br />
Geotextiles<br />
75%<br />
Geotextile<br />
111000<br />
Year 1992 1996 2001 2006 2011 % CAGR % CAGR<br />
(92-01) (01-11)<br />
Quantity<br />
(mn sq. mt.)<br />
13 19 28 35 46 7.51 5.24<br />
Value (Mn $) 43 60 84 106 137<br />
Value (Rs. Cr.) 198 276 386 488 630<br />
# Source: Freedonia Group<br />
41
Indian Market Potential For Geogrids :<br />
2.12 The market potential for geogrids in India is calculated as under :<br />
Projects<br />
Irrigation - Accelerated<br />
Irrigation Benefit<br />
Programme (AIBP)<br />
National Coastal Protection<br />
Plan (NCPP)<br />
Appendix – 5A (Contd...)<br />
Infrastructure<br />
Market Potential<br />
Investments Planned (2003-04 to 2007-08)<br />
Rs. Cr.<br />
Quantity Value (@ 3%)<br />
(upto 2007-08) (mn sq. mt.) (Rs. Cr.)<br />
8500 25.50 255<br />
1800 5.40 54<br />
Flood Control 8000 (required) 24.00 240<br />
Retaining Wall of Bridges* NA 9.00 90<br />
Total 18300 63.90 639<br />
Source : Market Estimates and Industry feedback<br />
* Assuming around 100 flyovers would be built in the next 5 years and 2000 road<br />
embankments on the NHAI project. (Avg. 4000 sq. mt. per flyover)<br />
2.13 Further split up of market potential for Geogrid on annualised basis is shown<br />
below :<br />
Projects<br />
Planned<br />
Infrastructure<br />
Projects<br />
Rs. Cr.<br />
(Upto<br />
2007-08)<br />
MARKET POTENTIAL FOR GEOGRID<br />
Market<br />
Potential (2001-<br />
02 to 2007-08<br />
Qty.<br />
(Mn.<br />
Sq.)<br />
Value<br />
Rs. Cr.<br />
(@3%)<br />
Geogrid<br />
2001-<br />
20<br />
2002-<br />
03<br />
Projected Market Potential<br />
2003-<br />
04<br />
2004-<br />
05<br />
2005-<br />
06<br />
2006-<br />
07<br />
2007-<br />
08<br />
Geogrid 18300 63.90 639 10 20 50 70 125 150 214<br />
Cumulativ<br />
e Total<br />
10 30 80 150 275 425 639<br />
* Geogrid Projects include Irrigation projects (Rs. 8500 Cr.), Coastal protection projects (Rs.1800<br />
Cr), flood control projects (Rs. 8000 Cr.) and retaining wall of bridges. The market estimates are<br />
done assuming around 100 flyovers would be built in the next 5 years and 2000 road embankments<br />
on the NHAI project. (Avg. 4000 sq.mt. per flyover).<br />
SECTI<strong>ON</strong> II : GEOGRID TECHNOLOGY AND EQUIPMENT SUPPLIERS<br />
2.13 The woven geogrid process is discussed below as per the budgetary quotations<br />
obtained from the local representatives.<br />
Process Description :<br />
2.14 The woven geogrids are manufactured on Projectile Weaving Machine based on<br />
Weft Insertion System.<br />
2.15 The raw materials used are Synthetics (filament yarns), Polypropylene.<br />
42
Appendix – 5A (Contd...)<br />
2.16 The nominal width for weaving can be (in cm) 360, 390, 430, 460, 540.<br />
2.17 Coating material used are PVC, Acrylic depending on the end product application<br />
and other process parameters.<br />
2.18 List of machinery recommended by the equipment supplier are as follows :<br />
(I) Sectional Warping Machine (1 no)<br />
(II) Projectile Weaving Machine - P7300 (2 nos)<br />
a. Nominal weaving width - 360 to 540 cm<br />
b. Weft Insertion rate - 1000 to 1100 m/min<br />
c. Speed - 300 to 230 rpm<br />
(III) Winding & Slitting Machine (1 no)<br />
(IV) Offline Coating Line (1 no)<br />
Notes : a. Detailed specifications can be further obtained from overseas technology<br />
suppliers.<br />
b. Subsequently once the market picks up 4 to 8 loom can be added.<br />
2.19 Special characteristics of this product is as follows :<br />
• High tear resistance values which can be exactly adapted according to their<br />
application,<br />
• Geogrid gives high strength according to the aperture size and are mainly<br />
influenced by the selection of the yarn material, yarn arrangement, yarn<br />
thickness and density of filler threads and weft.<br />
2.20 Globally, the well known technology suppliers with proven track are :<br />
1. Sulzer Textil (Switzerland)<br />
Local Representative : Sultex (India) Pvt. Ltd.<br />
Karmayog Building, Parsi Panchayat Road<br />
Andheri (East), Mumbai - 400 069<br />
Tel : 26827661/62, Fax : 26827665/6<br />
2. Dornier GmbH (Germany)<br />
3. Menzel GmbH (Germany) -- For Coating<br />
Notes : The list contains the leading global players in the Woven Geogrid<br />
Technology and based on discussion with Industry experts the above list<br />
is exhaustive.<br />
43
Recommended Economic Size :<br />
Appendix – 5A (Contd...)<br />
2.21 The geogrid project proposed to be set up in India will have a designed capacity<br />
of 250 sq. mts. per hour.<br />
2.22 As per the Industry Experts under Indian operating conditions it is safer to assume<br />
machine efficiency factor of 75%, and therefore the production would be 188 sq. mts. per<br />
hour.<br />
2.23 The plant would operate in three shifts, 24 hours and 350 working days in a year.<br />
Investment in Process Plant and Machinery.<br />
2.24 As per the indicative budgetary quotations and assuming 10% discount from the<br />
machinery suppliers, the investment in the process plant and machinery (including<br />
offline coating) will be Rs 4.40 crores (FOB). Finer details on the Equipment<br />
specifications and the formal quotations need to be discussed with the technology supplier<br />
before the project is taken up. Taking into account the CIF value (2%), the custom duties<br />
(5%), inland transportation (2%), erection and commissioning (5%), the installed cost of<br />
process equipment would be Rs. 5.05 crores.<br />
2.25 Other Technologies Available For Producing Geogrid :<br />
Product Other Technologies<br />
Geogrid Knitted, Extrusion<br />
SECTI<strong>ON</strong> III : PROJECT COST & PR<strong>OF</strong>ITABILITY PROJECTI<strong>ON</strong>S<br />
Land<br />
2.26 The total requirement of land for this project keeping in mind the possible future<br />
expansion is around 4046 Sq. Mtrs. (1.0 acres ).<br />
2.27 Based on the available information the cost of land is assumed at Rs 1200 per<br />
square meter (including the developmental cost ).Depending on the exact location of the<br />
project to be determined by the promoter the land cost could be higher or lower. Hence<br />
the total cost of developed land will be Rs 0.49 crores.<br />
44
Buildings<br />
Appendix – 5A (Contd...)<br />
2.28 The building area comprising of main factory building, godowns, office, R & D<br />
labs / In-house Testing centre etc. would be 2000 sq. mtrs. The cost of construction<br />
would again vary depending on the structure and the materials to be used. It has been<br />
assumed that the average cost of construction would be Rs 4500 per sq. mtr. Thus the<br />
total cost of building and other civil works would be around Rs 0.90 crores.<br />
Plant and Machinery<br />
2.29 Details of Plant and machinery as well as technology required for the project have<br />
been presented in earlier Section II . The installed cost of plant and machinery would be<br />
Rs 5.05 crores.<br />
2.30 Apart from the main process equipments the utilities required are:<br />
• Fire fighting equipments,<br />
• Packaging Machine,<br />
• Inspection and Winding Machine<br />
• Material Handling equipment such as fork lifts etc.<br />
• Other miscellaneous equipment.<br />
2.31 The provision on this count is assumed at Rs 0.50 crores.<br />
Testing Lab (In-house)<br />
2.32 As per the Industry Experts the In-house Testing and R& D facility would call for<br />
an investment of around Rs 0.35 crore. The list of testing equipment is given in<br />
Annexure.<br />
Miscellaneous Fixed Assets<br />
2.33 Under this head the items included are Furniture and fixtures, Office equipments,<br />
Air Conditioners etc. and the provision made is around Rs 0.15 crores.<br />
Project Engineering and Consulting<br />
2.34 Under this head the items included are the fees and expenses on account of<br />
Architect fees, project engineering and management (both local and overseas), detailed<br />
project reports etc.<br />
Preliminary & Preoperative Expenses<br />
45
Appendix – 5A (Contd...)<br />
2.35 The items included under this head are company formation expenses, public issue<br />
expenses (if any ), interest during construction, pre production expenses during the<br />
implementation phase etc.<br />
Contingency Expenses<br />
2.36 Depending on the gestation period and further detailing of the project cost by the<br />
promoter, the contingency provision has been made at the rate of 10%.<br />
Margin Money for Working capital<br />
2.37 The margin money for working capital forming part of the total project cost would<br />
be Rs 0.37 crores. The details of the working are shown in Exhibit 2.3.<br />
Total Project Cost<br />
2.38 The total project cost as given in Exhibit 2.1 would be Rs. 9.59 crores .<br />
Project Funding And Financing Pattern<br />
2.39 It has been assumed that the project would be financed through long term funds<br />
and Equity participation by the Promoter / Public. The technical textile sector being a<br />
high priority area, it is assumed that a Debt- Equity ratio of 1.5 : 1 would be feasible.<br />
(However the sensitivity analysis has also been presented for 1 : 1 and 2 : 1 Debt Equity<br />
ratios.)<br />
Sales, Profitability And Sensitivity Analysis<br />
Sales Realisation and Turnover<br />
2.40 As per the discussions with the Industry Experts the economic size of a plant is<br />
250 sq. mts./hour.<br />
2.41 As per the Industry Experts under Indian operating conditions it is safer to assume<br />
machine efficiency factor of 75%, and therefore the production would be 188 sq. mts. per<br />
hour.<br />
2.42 The plant would operate on Three -shift basis and 350 workings days in a year.<br />
2.43 The capacity utilisation for the 1st year is assumed at 50% and thereafter for the<br />
2 nd , 3 rd and 4 th year onwards 60%, 75% and 90% respectively.<br />
46
Appendix – 5A (Contd...)<br />
2.44 The average selling price of the end product would be Rs 100 per sq. mt. (net of<br />
excise duties, sales tax and other incidental expenses). The international price is in the<br />
range of $2.2 to $2.75/sq. mt. depending on the gsm and other technical parameters.<br />
2.45 The details of sales turnover projected are given in Exhibit 2.2.<br />
Cost of Production<br />
Major Raw materials<br />
2.46 The main raw materials used and the corresponding prevailing prices as an<br />
indicator are as follows :<br />
Major Raw Materials Landed Cost* (Rs / kg )<br />
* Inclusive of import duty<br />
PFY 110<br />
2.47 Raw material specifications of PFY are given below:<br />
Property Value<br />
Denier 1000 2000<br />
Breaking Strength 84N 160N<br />
% elongation 12%<br />
2.48 The major suppliers of these raw materials (PFY, PVC etc.)are :<br />
Power Cost<br />
Indian (for PVC) :<br />
(a) Reliance Industries<br />
(b) IPCL (Taken over by Reliance)<br />
International (for PFY) :<br />
(a) Enka<br />
(b) Tejin<br />
(c) Corica Fibres, etc.<br />
2.49 The total connected load is 161 kW. The power cost would be Rs. 0.49 crores.<br />
Repairs & Maintenance<br />
2.50 The repair and maintenance cost would be at 2.5% of the Plant & Machinery cost<br />
i.e. Rs. 0.13 Cr.<br />
47
Manpower, Salaries and Wages<br />
Appendix – 5A (Contd...)<br />
2.51 The manpower requirements and the salary structure is given in Exhibit 2.4.<br />
2.52 The total manpower requirement comprising of supervisors, machine operators,<br />
helpers and the managerial cadre would be 33 nos incurring a cost of Rs. 0.48 Cr.<br />
Factory and Overhead Expenses<br />
2.53 The items covered under this head are repairs and maintenance, Establishment<br />
expenses, stationers, travel expenses, packaging expenses etc. and amount to Rs. 0.24 Cr.<br />
Sales, Marketing and Commission Expenses<br />
2.54 The promotion of geogrids will call for expenditure on this account and a<br />
provision of 20% of sales.<br />
Interest and Depreciation<br />
2.55 The prevailing interest rate for long term under Technological Upgradation Fund<br />
(TUF) is 5% and short term borrowed funds is taken at 11% per annum.<br />
2.56 The repayment of loans has been assumed for 10 years with two years moratorium<br />
(2+8).<br />
2.57 The depreciation rates as per the Company Law and Income-Tax Ready Reckoner<br />
have been worked out for Straight Line and WDV Method basis.<br />
2.58 The current corporate tax rate is assumed at 35 % and the surcharge is assumed at<br />
2.5% per annum.<br />
Profitability, Break-even, IRR and Payback .<br />
2.59 The Sales turnover increases from Rs 7.72 Cr in the first year to Rs<br />
13.89 Cr. from the 4 th year onwards.<br />
2.60 The PBT increases from Rs 1.91 Cr. in the first year to Rs. 4.70 Cr. from the 4 th<br />
year onwards. (Exhibit 2.5)<br />
2.61 The Break Even of the project is at 48.35%.<br />
2.62 The Internal Rate of Return (IRR) has been worked out at 31.39%.<br />
2.63 The Payback period for the project is 3.33 years.<br />
48
Sensitivity Analysis:<br />
2.64 The sensitivity analysis has been presented in the Exhibit 2.6.<br />
Common Testing Facilities :<br />
Appendix – 5A (Contd...)<br />
2.65 Indian testing centres like IIT (Mumbai, Delhi, Chennai), Central Road Research<br />
Institute (CRRI), BTRA, SASMIRA etc. currently cater to the testing requirements.<br />
2.66 Some of the leading International Geosynthetic Test Laboratories are :<br />
Testing Centre Country<br />
Geosynthetic Testing Services Australia<br />
Ghent University Belgium<br />
Activation Laboratories Ltd. Canada<br />
LGA Geosynthetic Institute Germany<br />
tBU Germany<br />
Geospec Ltd. United Kingdom<br />
SGS Testing Services L.L.C. United States<br />
TRI/Environmental Inc. United States<br />
DEVELOPMENTAL AND PROMOTI<strong>ON</strong>AL MEASURES.<br />
2.67 As per the inputs from IIT-Mumbai, a National Level Testing Facility needs to be<br />
set-up for R&D and Testing of fabrics.<br />
2.68 The various properties that need to be tested and researched for Geotextiles and<br />
Geogrids are listed below :<br />
Properties Tests<br />
Physical Properties • Mass per unit area<br />
• Thickness Test<br />
• Determination of apparent opening<br />
size of geotextiles<br />
• CBR Puncture test<br />
Mechanical Properties • Tensile properties of geotextiles and<br />
geogrid.<br />
• Grab breaking load and elongation<br />
for geotextiles.<br />
• Index puncture testing.<br />
• Evaluating the unconfined tension<br />
creep behaviour of geotextiles.<br />
• Pyramid puncture resistance for<br />
geotextiles.<br />
49
Appendix – 5A (Contd...)<br />
• Connectivity testing for geogrids.<br />
• Mullen burst test.<br />
Hydraulic Properties • Inplane flow testing.<br />
• Cross plane flow testing.<br />
• Measuring the soil geotextile<br />
clogging system.<br />
• Emersion procedures for evaluating<br />
the chemical resistance of<br />
geotextiles.<br />
• Ultraviolet testing for polymers<br />
• Building of road pavement for simulating real life testing.<br />
2.69 TECS, interaction with tBU, Germany one of the Testing Centre for<br />
geotextiles/geogrids has shown interest in collaborating to set-up a testing centre in India.<br />
For further follow-up the address is given below :<br />
tBU<br />
Gutenberg Str. 29<br />
48268 Greven, Germany<br />
Tel : +(49) 2571/9872-0<br />
Email : tbu@tbu-gmbh.de<br />
website : www.tbu-gmbh.de<br />
DEVELOPMENT AND PROMOTI<strong>ON</strong>AL MEASURES :<br />
2.70 Global consumption of geotextiles/geogrids has grown phenomenally during the<br />
last three decades from 30 mn mtr. in 1975 to 1400 mn mtr. in 2000-01 and expected to<br />
touch 1650 mn mtr. in 2003-04 and further to 2490 mn mtr. by 2007-08.<br />
2.71 The developed regions of N. America & Europe accounted for 80% of the total<br />
consumption reflecting the importance of geotextiles in the road and other infrastructure<br />
projects.<br />
2.72 The new emerging markets are China and India.<br />
Global Practices:<br />
2.73 In Germany the Regulatory Framework can be understood in the light of the<br />
regulations since 1970s titled as “GEOSYN<strong>THE</strong>TICS IN ROAD C<strong>ON</strong>STRUCTI<strong>ON</strong> -<br />
GERMAN REGULATI<strong>ON</strong>S.”<br />
2.74 Germany tested geotextiles for road construction work in 1970s on large-scale<br />
tests on-site. In 1977, at the first International Conference on the Use of Fabrics in<br />
Geotechnics, held in Paris, the Norwegian Road Research Laboratory developed a system<br />
to test the mechanical strength of the textiles by a so called CBR-tensile-test and in<br />
50
Appendix – 5A (Contd...)<br />
addition by a cone-drop-test and used the results to define the suitability for the use under<br />
4 different classes of fill over soft soil.<br />
2.75 The Germans adopted the CBR-tensile-test as Plunger-Puncture-Test and<br />
classified the nonwovens in five Geotextile-Robustness-Classes (GRC). To find out the<br />
necessary GRC for a given site, they classified the fill in 5 classes on the basis of the<br />
diameter and the coarseness/sharpness of aggregates. The table below shows the GRC<br />
classification.<br />
GRC classification:<br />
Product Group Nonwovens<br />
Geotextile-Robustness- Plunger-puncture-force Mass per unit area<br />
Classes<br />
(kN)<br />
(gsm)<br />
GRC1 >= 0.5 >= 80<br />
GRC2 >= 1.0 >= 100<br />
GRC3 >= 1.5 >= 150<br />
GRC4 >= 2.5 >= 250<br />
GRC5 >= 3.5 >= 300<br />
2.76 The German regulations or for that matter the regulations anywhere in the<br />
developed countries don’t mandate the usage of geotextiles but it is mostly based on the<br />
benefits derived like, increase in road life to 4 -5 times than the roads built today,<br />
minimising road maintenance (7 to 8 years) and improving riding quality without potholes<br />
and reflective cracking.<br />
2.77 China is under mass infrastructure construction and hence the largest market of<br />
geosynthetics in the current decade (2001-2010). In recent years, China has invested $<br />
86.7 billion in improving its road- railway network, new airports, water conservancy<br />
projects, etc.<br />
2.78 At the same time the promotional effort done by the Chinese government to<br />
increase the usage of geosynthetics in these infrastructure projects are to be appreciated.<br />
China International Geosynthetics Exhibition is held every year.<br />
2.79 The Chinese are using an integrated approach within various agencies in the<br />
promotion of geosynthetics. There are atleast 15 agencies (as listed below) co-operating<br />
with each other to create awareness and promote usage of geosynthetics. Numerous<br />
discussion meetings are held throughout China each year to discuss the applications of<br />
geosynthetic products.<br />
51
Appendix – 5A (Contd...)<br />
2.80 In 2002 alone, 130 national level technical communications have been issued, in<br />
which research, experimental works, manufacturing, the use of geosynthetics in<br />
engineering projects and issues are reported.<br />
2.81 List of Chinese Agencies collaborating with each other are as follows:<br />
1. China Technology Market Association (CTMA)<br />
2. IGS-China Chapter<br />
3. Chinese Technical Association on Geosynthetics (CTAG)<br />
4. China Nonwovens Technical Association (CNTA)<br />
5. Shanghai Geosynthetics Technical Association (SGTA)<br />
6. China Association for Science & Technology<br />
7. China Hydraulic Engineering Society<br />
8. China Communication Association<br />
9. China Railway Society<br />
10. Chinese Society for Hydroelectric Engineering<br />
11. Chinese Society for Environmental Science<br />
12. China Civil Engineering Society<br />
13. China Textile Engineering Society<br />
14. CNTA Science & Technology Co. Ltd.<br />
15. CMP Asia Exhibitions & Paperloop Inc.<br />
2.82 It is interesting to note here that after the disastrous flooding of Yangste River in<br />
1998, Prime Minister, Zhu Rong Yi issued a document in which he encouraged<br />
Engineers to use geosynthetic products in their work. This shows the level of<br />
involvement in increasing the usage of geosynthetics in China. In 2001-02 China alone<br />
consumed 250 mn sq. mtrs of geosynthetics.<br />
PROMOTI<strong>ON</strong>AL EFFORTS IN INDIA:<br />
2.83 In India poor road conditions and high maintenance cost requires serious attention<br />
and the solution lies in use of geotextiles which gives increased road life to 4 - 5 times<br />
than the roads built today, minimising road maintenance (7 to 8 years) and improving<br />
riding quality without potholes and reflective cracking.<br />
2.84 Indian investment in the infrastructure projects like Roads & Railways alone<br />
stands at Rs. 1,84,000 Cr. ($ 40 bn) and the usage of geosynthetics (geotextiles &<br />
geogrids) has not been significant compared to the initiatives taken by<br />
developed/developing countries like China, Korea, etc.<br />
52
Appendix – 5A (Contd...)<br />
2.85 Indian Road Congress publication on “SPECIFICATI<strong>ON</strong>S FOR ROAD AND<br />
BRIDGE WORKS” (Fourth Revision) under section 700 gives the use Geosynthetics<br />
(Geotextile/Geogrid/Geonet/Geomembrane / Geocomposite) under Clause nos. 701, 702,<br />
703 & 704.<br />
2.86 Indian Road Congress Special Publication 59 (IRC: SP: 59 - 2002) has published<br />
“GUIDELINES FOR USE <strong>OF</strong> GEOTEXTILES IN ROAD PAVEMENTS AND<br />
ASSOCIATED WORKS” which gives the details of the properties and installation of<br />
geotextiles for various soil conditions.<br />
2.87 Under Section 700 of the Indian Road Congress Clause no. 704 “PROTECTI<strong>ON</strong><br />
WORKS WITH GEOSYN<strong>THE</strong>TICS” give the use of Geogrids for various applications<br />
and the details about construction and installation.<br />
2.88 Special Publication for Geogrids does not exist which should be drafted by the<br />
Indian Road Congress (IRC)<br />
2.89 Ministry of Road Transport and Highways (MORTH) should encourage the usage<br />
of geotextiles. The factors that affect the potential usage of geotextiles in the Indian<br />
context are :<br />
• Traditional geotechnical and civil engineering practices.<br />
• Resistance to adapt to geotextiles than conventional methods.<br />
2.90 As per the industry feedback mandation should exist to incorporate geotextile<br />
layer in the road works from design stages itself as it increases the road life by 30%<br />
hence reducing maintenance. Such mandation should exist for geogrid also.<br />
2.91 All geotextiles and geogrids should be enforced with mandatory testing clause<br />
before installation.<br />
2.92 The Inter-Ministerial Co-ordination is one of the workable solutions for the<br />
promotion of geotextiles and geogrids in the country with Ministry of Textiles taking<br />
the lead role.<br />
2.93 All those concerned like, Ministry of Road Transport & Highway (MORTH),<br />
Ministry of Environment & Forests (MOEF), Ministry of Water Resources (MOWR),<br />
Ministry of Railways (MOR) & Ministry of Urban Affairs are important government<br />
bodies need to play active role in the promotion of geotextiles and geogrids.<br />
53
Appendix – 5A (Contd...)<br />
2.94 The Indian Geotextile and Geogrid manufacturers should be given<br />
representation for all the inter-ministerial and departmental committees as well as Bureau<br />
of Indian Standards for participation in the policy matters.<br />
2.95 In view of the ongoing infrastructural development activities in the country the<br />
usage of geotextiles / geogrids should be made mandatory within the next three to six<br />
months.<br />
2.96 The technical expertise exists in the country for conceptualising the requirement of<br />
the geotextile and geogrid fabric in applications like roads, railways, bridges,<br />
embankments, etc.<br />
2.97 Expertise in Design of Civil and Geotechnical structures exists with research<br />
institutes like CRRI, RDSO, BTRA etc. and institutions like SASMIRA, IIT - Delhi &<br />
Mumbai, NHAI, etc. Thus the country possess human resource talent pool.<br />
2.98 The Ministry of Human Resource Development can introduce specialisation<br />
courses for Geosynthetics (geotextiles and geogrids) in Civil & Textile Engineering<br />
courses at graduation and post-graduation levels for churning professionals in this sector.<br />
2.99 GoI should relax the criteria for domestic players like long term testing clause of<br />
10,000 hrs for Creep Behaviour Test to 2,000 hrs giving them an opportunity to prove<br />
their product.<br />
2.100 To advocate the usage of geotextiles and geogrids, GoI can give concessions like<br />
the absorption of the additional project cost on account of usage of geotextiles and<br />
geogrids.<br />
2.101 Imported geotextile and geogrid should be levied with additional customs duty<br />
(to be decided by the government) to protect the Indian players who would be in the<br />
nascent stages of development. This would also encourage International collaborations<br />
with Indian players to increase the competitiveness.<br />
54
EXHIBIT 2.1<br />
Appendix – 5A (Contd...)<br />
PROJECT COST<br />
(LAND, BUILDINGS, PROCESS PLANT & MACHINERY, UTILITIES &<br />
O<strong>THE</strong>R ASSETS)<br />
1<br />
2<br />
Land<br />
Area: 1.0 acres ( 4046 Sq Mtrs)<br />
Rate: (Rs.1200 /Sq. Mtr)<br />
Buildings<br />
Plant Area, Office, Godown, Lab, Service Area etc.)<br />
Built-up Area : 2000 Sq. Mtrs<br />
Avg Rate : Rs. 4500 /Sq. Mtrs<br />
3 Process Plant & Equipment<br />
4<br />
Utility & Other equipments<br />
Packaging Machine, Inspection & winding m/c<br />
Fire Fighting, Material Handling etc.)<br />
5 Testing Facilities (In-house)<br />
6<br />
Misc. Fixed Assets<br />
(Furniture & Fixtures, Office Equipment, etc.)<br />
7 Project Engineering & Consultancy charges (2.5%)<br />
8<br />
Preliminary & Pre-operative Expenses (12%)<br />
(Company Formation, Interest during construction,<br />
pre-production expenses, etc.)<br />
9 Contingency (10 %)<br />
10 Total<br />
11 Margin Money for Working Capital<br />
12 Total Project Cost<br />
Project Cost (Rs. Cr.)<br />
0.49<br />
0.90<br />
5.05<br />
0.50<br />
0.35<br />
0.15<br />
0.16<br />
0.83<br />
0.81<br />
9.23<br />
0.37<br />
9.59<br />
55
ITEM<br />
EXHIBIT 2.2<br />
Appendix – 5A (Contd...)<br />
ESTIMATI<strong>ON</strong> <strong>OF</strong> SALES REVENUE<br />
(Rs. Cr.)<br />
YEAR <strong>OF</strong> OPERATI<strong>ON</strong><br />
I II III IV V VI VII VIII IX X<br />
Production per hour (sq mt) 250 250 250 250 250 250 250 250 250 250<br />
75% efficiency 188 188 188 188 188 188 188 188 188 188<br />
Capacity Utilisation 50% 60% 75% 90% 90% 90% 90% 90% 90% 90%<br />
Actual Production per hour 94 113 141 169 169 169 169 169 169 169<br />
Production per day (sq mt) 2250 2700 3375 4050 4050 4050 4050 4050 4050 4050<br />
Production for 350 working days (sq mt) 787500 945000 1181250 1417500 1417500 1417500 1417500 1417500 1417500 1417500<br />
Selling Price (Rs/sq mt) 100.00 100.00 100.00 100.00 100.00 100.00 100.00 100.00 100.00 100.00<br />
Sales Revenue (Rs. Cr) 7.88 9.45 11.81 14.18 14.18 14.18 14.18 14.18 14.18 14.18<br />
Value Loss ( 2% ) 0.16 0.19 0.24 0.28 0.28 0.28 0.28 0.28 0.28 0.28<br />
Net Sales Revenue (Rs. Cr) 7.72 9.26 11.58 13.89 13.89 13.89 13.89 13.89 13.89 13.89<br />
56
ITEM<br />
Factory Related<br />
NO. <strong>OF</strong><br />
M<strong>ON</strong>THS<br />
MARGIN<br />
(%)<br />
W.CAP<br />
REQMT<br />
EXHIBIT 2.3<br />
REQUIREMENT <strong>OF</strong> WORKING CAPITAL<br />
Appendix – 5A (Contd...)<br />
YEAR I YEAR II YEAR III YEAR IV YEAR V<br />
MARGIN<br />
M<strong>ON</strong>EY<br />
BANK<br />
FINANCE<br />
W.CAP<br />
REQMT<br />
MARGIN<br />
M<strong>ON</strong>EY<br />
Raw materials & other<br />
commodities<br />
2.00 25.00 0.38 0.10 0.29 0.46 0.11 0.34 0.57 0.14 0.43 0.69 0.17 0.51 0.69 0.17 0.51<br />
Goods in process 0.10 25.00 0.03 0.01 0.02 0.03 0.01 0.02 0.04 0.01 0.03 0.05 0.01 0.03 0.05 0.01 0.03<br />
Finished Goods 1.00 25.00 0.41 0.10 0.31 0.48 0.12 0.36 0.58 0.15 0.44 0.69 0.17 0.52 0.69 0.17 0.52<br />
A/c Receivable 1.00 25.00 0.64 0.16 0.48 0.77 0.19 0.58 0.96 0.24 0.72 1.16 0.29 0.87 1.16 0.29 0.87<br />
Cash in hand<br />
Salaries & wages 1.00 0.00 0.04 0.00 0.04 0.04 0.00 0.04 0.04 0.00 0.04 0.05 0.00 0.05 0.05 0.00 0.05<br />
Utilities 1.00 0.00 0.02 0.00 0.02 0.02 0.00 0.02 0.03 0.00 0.03 0.04 0.00 0.04 0.04 0.00 0.04<br />
Power 1.00 0.00 0.01 0.00 0.01 0.01 0.00 0.01 0.01 0.00 0.01 0.01 0.00 0.01 0.01 0.00 0.01<br />
Repairs & Maintenance 1.00 0.00 0.01 0.00 0.01 0.01 0.00 0.01 0.01 0.00 0.01 0.01 0.00 0.01 0.01 0.00 0.01<br />
Sales, Marketing & Commision<br />
expenses<br />
1.00 0.00 0.13 0.00 0.13 0.15 0.00 0.15 0.19 0.00 0.19 0.23 0.00 0.23 0.23 0.00 0.23<br />
Factory & Office overheads 1.00 0.00 0.02 0.00 0.02 0.02 0.00 0.02 0.02 0.00 0.02 0.02 0.00 0.02 0.02 0.00 0.02<br />
Total Requirement 1.67 0.37 1.31 1.98 0.43 1.55 2.45 0.54 1.91 2.91 0.64 2.27 2.91 0.64 2.27<br />
BANK<br />
FINANCE<br />
W.CAP<br />
REQMT<br />
MARGIN<br />
M<strong>ON</strong>EY<br />
BANK<br />
FINANCE<br />
W.CAP<br />
REQMT<br />
MARGIN<br />
M<strong>ON</strong>EY<br />
BANK<br />
FINANCE<br />
W.CAP<br />
REQMT<br />
MARGIN<br />
M<strong>ON</strong>EY<br />
(Rs.Cr)<br />
BANK<br />
FINANCE<br />
57
ITEM<br />
Factory Related<br />
NO. <strong>OF</strong><br />
M<strong>ON</strong>THS<br />
MARGIN<br />
(%)<br />
W.CAP<br />
REQMT<br />
EXHIBIT 2.3 (Contd..)<br />
REQUIREMENT <strong>OF</strong> WORKING CAPITAL<br />
Appendix – 5A (Contd...)<br />
YEAR VI YEAR VII YEAR VIII YEAR XI YEAR X<br />
MARGIN<br />
M<strong>ON</strong>EY<br />
BANK<br />
FINANCE<br />
W.CAP<br />
REQMT<br />
MARGIN<br />
M<strong>ON</strong>EY<br />
Raw materials & other<br />
commodities 2.00 25.00 0.69 0.17 0.51 0.69 0.17 0.51 0.69 0.17 0.51 0.69 0.17 0.51 0.69 0.17 0.51<br />
Goods in process 0.10 25.00 0.05 0.01 0.03 0.05 0.01 0.03 0.05 0.01 0.04 0.05 0.01 0.04 0.05 0.01 0.04<br />
Finished Goods 1.00 25.00 0.69 0.17 0.52 0.70 0.17 0.52 0.70 0.18 0.53 0.71 0.18 0.53 0.71 0.18 0.53<br />
A/c Receivable 1.00 25.00 1.16 0.29 0.87 1.16 0.29 0.87 1.16 0.29 0.87 1.16 0.29 0.87 1.16 0.29 0.87<br />
Cash in hand<br />
Salaries & wages 1.00 0.00 0.05 0.00 0.05 0.06 0.00 0.06 0.06 0.00 0.06 0.07 0.00 0.07 0.07 0.00 0.07<br />
Utilities 1.00 0.00 0.00 0.00 0.00 0.00 0.00 0.00 0.00 0.00 0.00 0.00 0.00 0.00 0.00 0.00 0.00<br />
Power 1.00 0.00 0.04 0.00 0.04 0.04 0.00 0.04 0.04 0.00 0.04 0.04 0.00 0.04 0.04 0.00 0.04<br />
Repairs & Maintenance 1.00 0.00 0.04 0.00 0.04 0.04 0.00 0.04 0.04 0.00 0.04 0.04 0.00 0.04 0.04 0.00 0.04<br />
Sales, Marketing & Commision<br />
expenses 1.00 0.00 0.01 0.00 0.01 0.01 0.00 0.01 0.01 0.00 0.01 0.01 0.00 0.01 0.01 0.00 0.01<br />
Factory & Office overheads 1.00 0.00 0.23 0.00 0.23 0.23 0.00 0.23 0.23 0.00 0.23 0.23 0.00 0.23 0.23 0.00 0.23<br />
Total Requirement 2.95 0.65 2.30 2.96 0.65 2.31 2.97 0.65 2.32 2.98 0.65 2.33 2.99 0.65 2.34<br />
BANK<br />
FINANCE<br />
W.CAP<br />
REQMT<br />
MARGIN<br />
M<strong>ON</strong>EY<br />
BANK<br />
FINANCE<br />
W.CAP<br />
REQMT<br />
MARGIN<br />
M<strong>ON</strong>EY<br />
BANK<br />
FINANCE<br />
W.CAP<br />
REQMT<br />
MARGIN<br />
M<strong>ON</strong>EY<br />
(Rs.Cr)<br />
BANK<br />
FINANCE<br />
58
EXHIBIT 2.4<br />
MANPOWER REQUIREMENTS<br />
Nos Monthly Total Monthly Annual<br />
General Manager 1 30000 30000 360000<br />
Shift Supervisor 4 15000 60000 720000<br />
Machine Operator 9 6000 54000 648000<br />
Machine Helper (Semi Skilled) 5 4000 20000 240000<br />
Material Handling 2 4000 8000 96000<br />
R&D, Testing 2 12000 24000 288000<br />
Marketing Manager 1 30000 30000 360000<br />
Asst. Sales Manager 1 15000 15000 180000<br />
Finance & Adminstration<br />
Maintenance<br />
3 4000 12000 144000<br />
(Jobber+Fitter+Electronics) 5 6000 30000 360000<br />
TOTAL 33 283000 3396000<br />
Fringe Benefits (40 % of the above) 1358400<br />
Total Wage Bill (Annual) Rs. :<br />
Total Wage Bill (Annual) Rs. Cr. :<br />
Salary + Other Benefits =<br />
4754400.00<br />
0.47544<br />
Appendix – 5A (Contd...)<br />
59
EXHIBIT 2.5<br />
Appendix – 5A (Contd...)<br />
PR<strong>OF</strong>ITABILITY STATEMENT AND COMPUTATI<strong>ON</strong> <strong>OF</strong> TAX<br />
ACCOUNT HEAD<br />
I II<br />
FINANCIAL YEAR <strong>OF</strong> OPERATI<strong>ON</strong><br />
III IV V VI VII VIII IX<br />
(Rs.Cr)<br />
X<br />
Revenue<br />
Net Sales Turnover 7.72 9.26 11.58 13.89 13.89 13.89 13.89 13.89 13.89 13.89<br />
Total Revenue<br />
Expenses<br />
7.72 9.26 11.58 13.89 13.89 13.89 13.89 13.89 13.89 13.89<br />
Raw Materials 2.28 2.74 3.43 4.11 4.11 4.11 4.11 4.11 4.11 4.11<br />
Salaries & wages 0.48 0.50 0.52 0.55 0.58 0.62 0.67 0.73 0.79 0.85<br />
Power 0.24 0.29 0.37 0.44 0.44 0.44 0.44 0.44 0.44 0.44<br />
Repairs & Maintenance 0.13 0.13 0.13 0.13 0.13 0.13 0.13 0.13 0.13 0.13<br />
Sales, Marketing & Commission expenses 1.54 1.85 2.32 2.78 2.78 2.78 2.78 2.78 2.78 2.78<br />
Factory & Office Overheads 0.24 0.24 0.24 0.24 0.24 0.24 0.24 0.24 0.24 0.24<br />
Interest on S.T. Loans 0.14 0.17 0.21 0.25 0.25 0.25 0.25 0.26 0.26 0.26<br />
Cost of Sales 5.05 5.92 7.20 8.49 8.52 8.57 8.62 8.67 8.73 8.80<br />
Depreciation (St.Line) 0.44 0.44 0.44 0.44 0.44 0.44 0.44 0.44 0.44 0.44<br />
Amort. of Expenses 0.03 0.03 0.03 0.03 0.03 0.03 0.00 0.00 0.00 0.00<br />
Interest on L.T Loan 0.29 0.29 0.27 0.23 0.20 0.16 0.13 0.09 0.05 0.02<br />
Profit Before Tax 1.91 2.59 3.63 4.70 4.70 4.69 4.70 4.68 4.66 4.63<br />
Tax 0.18 0.57 1.05 1.51 1.58 1.62 1.67 1.69 1.70 1.71<br />
Profit After Tax 1.73 2.02 2.58 3.19 3.13 3.07 3.04 3.00 2.96 2.92<br />
Dividend 0.00 0.00 0.19 0.19 0.19 0.38 0.38 0.38 0.38 0.38<br />
Profits For Appropriation 1.73 2.02 2.39 3.00 2.94 2.68 2.65 2.61 2.57 2.54<br />
60
EXHIBIT 2.5 (Contd..)<br />
Appendix – 5A (Contd...)<br />
PR<strong>OF</strong>ITABILITY STATEMENT AND COMPUTATI<strong>ON</strong> <strong>OF</strong> TAX<br />
ACCOUNT HEAD<br />
COMPUTATI<strong>ON</strong> <strong>OF</strong> TAX<br />
I II<br />
FINANCIAL YEAR <strong>OF</strong> OPERATI<strong>ON</strong><br />
III IV V VI VII VIII IX<br />
(Rs.Cr)<br />
X<br />
Profit after interest before depreciation 2.35 3.03 4.08 5.14 5.15 5.14 5.15 5.13 5.11 5.08<br />
Depr.(WDV) to be claimed 1.84 1.41 1.08 0.83 0.64 0.50 0.39 0.31 0.24 0.19<br />
Depreciation claimed 1.84 1.41 1.08 0.83 0.64 0.50 0.39 0.31 0.24 0.19<br />
Depr. carried forward 0.00 0.00 0.00 0.00 0.00 0.00 0.00 0.00 0.00 0.00<br />
Export Income exempt from tax 0.00 0.00 0.00 0.00 0.00 0.00 0.00 0.00 0.00 0.00<br />
Taxable Profit 0.51 1.62 3.00 4.31 4.51 4.64 4.76 4.82 4.86 4.89<br />
Profit Before Tax (Book) 1.91 2.59 3.63 4.70 4.70 4.69 4.70 4.68 4.66 4.63<br />
Minimum Alternate Tax 0.00 0.00 0.00 0.00 0.00 0.00 0.00 0.00 0.00 0.00<br />
Tax (Actual) 0.18 0.57 1.05 1.51 1.58 1.62 1.67 1.69 1.70 1.71<br />
Tax Provision 0.18 0.57 1.05 1.51 1.58 1.62 1.67 1.69 1.70 1.71<br />
61
EXHIBIT 2.6<br />
SENSITIVITY ANALYSIS<br />
Items Profit after Tax<br />
(PAT)<br />
(assumed at 90 %<br />
capacity )<br />
Break<br />
Even<br />
(%)<br />
Internal<br />
Rate of<br />
Return<br />
(IRR)<br />
(%)<br />
Payback<br />
Period<br />
(Years)<br />
NORMAL VALUES 3.19 48.35 31.39 3.33<br />
Debt Equity Ratios<br />
(a) 2:1<br />
(b) 1:1<br />
Increase in Project Cost<br />
10 %<br />
Decrease in Selling Price<br />
Rs. 80 / sq. mt.<br />
Increase in Selling Price<br />
Rs. 120 sq. mt.<br />
Decrease in Raw<br />
Material Prices by 10%<br />
3.17<br />
3.21<br />
48.63<br />
47.92<br />
31.51<br />
31.28<br />
3.31<br />
3.34<br />
3.16 49.11 29.07 3.51<br />
1.76 60.54 18.83 4.78<br />
4.62 41.82 42.17 2.64<br />
3.46 46.21 33.66 3.16<br />
Appendix – 5A (Contd...)<br />
62
EXHIBIT NO. 2.7<br />
Appendix – 5A (Contd...)<br />
INTEGRATED APPROACH & INTER-MINISTERIAL CO-ORDINATI<strong>ON</strong> FOR<br />
USE <strong>OF</strong> GEOTEXTILES / GEOGRIDS IN VARIOUS PROJECTS<br />
Ministry of Road<br />
Transport &<br />
Highway(MORT<br />
H)<br />
Highways &<br />
Expressways<br />
Ministry of<br />
Environment<br />
& Forests<br />
(MOEF)<br />
Ministry Of Textile<br />
(MOT)<br />
To Lead & Coordinate<br />
Ministry of Water<br />
Resources<br />
(MOWR)<br />
For Policy changes<br />
& regulatory<br />
framework<br />
Landfill Irrigation<br />
Flood Control<br />
For Using Products<br />
Ministry of<br />
Railways<br />
(MOR)<br />
Track bed<br />
stabilisatio<br />
n<br />
Boulder<br />
Protection<br />
Ministry of<br />
Urban Affairs<br />
City Roads<br />
Landfill,<br />
Shore<br />
embankments<br />
Retaining<br />
Walls<br />
GT, GG GT, GG GT, GG GT, GG GT, GG<br />
Note : GT - Geotextile, GG - Geogrid.<br />
63
ANNEXURE I<br />
TEST LABORATORY EQUIPMENT (IN-HOUSE)<br />
No. Machine Name<br />
1. Universal Testing Machine<br />
2. Template & Weighing Scale<br />
3. Glass Beads & Others<br />
4. Permittivity Tester<br />
5. Thickness Tester<br />
6. Other miscellaneous items<br />
Appendix – 5A (Contd...)<br />
Total Investment required - Rs. 35,00,000 (approx. Rs. 0.35 Cr.)<br />
64
Appendix – 5A (Contd…)<br />
AUTOMOTIVE SEAT-BELT AND O<strong>THE</strong>R RIGID WEBBINGS<br />
SECTI<strong>ON</strong> I: PRODUCT BRIEF, APPLICATI<strong>ON</strong> AREAS & MARKET<br />
POTENTIAL<br />
3.1 Seat belt manufacture is basically an assembly operation comprising large number<br />
of light engineering sub components and the technical textile webbing.<br />
3.2 The technical textile portion in a seat belt is the webbing and prerequisites are:<br />
• Light weight<br />
• High abrasion resistance<br />
• Excellent recovery characteristics<br />
• Heat and light resistance<br />
• Flexibility in use, etc.<br />
3.3 For these properties mainly High Tensile Polyester Filament Yarn (PFY) (500 /<br />
750 / 1000 / 1500 dtex) is used. Globally, PFY is the most preferred synthetic yarn for<br />
seat belts.<br />
3.4 Warp direction in the belt is more important since the load is applied mainly in<br />
that direction. Normally twill or satin type finish is used. The webbing is normally of<br />
standard length 3 meters and width 50 mm woven on needle looms.<br />
3.5 Seat belts producers follow the AIS : 005 - 2000 and 015 - 2000 for safety seat<br />
Assemblies / Anchorages - specifications developed by Automotive Research Association<br />
of India (ARAI), Pune. ARAI is the pioneer organisation catering to certification and<br />
testing needs of 90% of the Indian Automobile industry. ARAI is ISO 9001 : 1994 and<br />
accredited R&D Institute.<br />
Usage and Application Areas:<br />
3.6 Seat belts are used by the four wheeler automobile sector, i.e.,<br />
• Passenger cars (Multi Utility Vehicles and taxis)<br />
• Light / Medium / Heavy trucks<br />
• Buses<br />
• Seat belts are also used in air crafts and helicopters<br />
65
Appendix – 5A (Contd…)<br />
3.7 As per the Government Notification from 1st October 2002 all four wheeler<br />
vehicles are to be equiped with front and rear seat belts.<br />
3.8 As per the Supreme Court notification all state governments are expected to<br />
ensure that the driver and co-driver use the seat belt.<br />
Producers and indigenous capacity build-up:<br />
3.9 Realising the opportunity of growing Indian market for seat belts from the<br />
automobile sector, some of the major global players have set up their shops in India as<br />
joint venture projects.<br />
3.10 The producers of seat belts are :<br />
• IFB Autoliv India, Bangalore (Collaboration with Autoliv, Sweden)<br />
• Abhishek Auto Industries Limited, Gurgaon (Collaboration with<br />
Ashimori Industries Limited, Japan)<br />
• Bond Safety Belt, Mumbai (Pioneer using indigenous technology).<br />
• TRW Rane Occupant Restraints Limited, Chennai<br />
3.11 The vehicle producers are target user customers of seat belts (OEM) are :<br />
Commercial vehicles Passenger cars / MUV*<br />
Tata Motors. Tata Motors. Fiat<br />
Ashok Leyland Maruti Mahindra &<br />
Eicher Motors Limited Mercedes Mahindra<br />
Mahindra & Mahindra Hyundai Honda<br />
Bajaj Tempo Toyota GM<br />
Swaraj Mazda Ford<br />
Volvo, etc.<br />
*MUV (Multi - Utility Vehicle)<br />
3.12 India now has the presence of almost all the major global players and the<br />
consumer has a wider choice of vehicles. The past trend and the projected market for four<br />
wheeler vehicles is shown below :<br />
Years<br />
Commercial<br />
Vehicles (A)<br />
Passenger Vehicles<br />
(Cars & Utility<br />
Vehicles) (B)<br />
(lakh nos.)<br />
Total 4 - Wheelers<br />
(A + B)<br />
1998 – 99 1.36 5.04 6.40<br />
1999 - 00 1.74 7.02 8.76<br />
2000 - 01 1.52 6.31 7.83<br />
2001 - 02 1.63 6.70 8.33<br />
2002 - 03 2.03 7.21 9.24<br />
2003-2004 (Est.) 2.75 9.89 12.64<br />
2007-2008 (Projected) 3.47 14.48 17.95<br />
66
Appendix – 5A (Contd…)<br />
Source : For past data Society of Indian Automobile Manufacturers (SIAM) Automobile Component<br />
Manufacturers Association of India (ACMA).<br />
• For Commercial Vehicles 2003-2004 to 2007-2008 growth rate assumed 6% / year.<br />
• For Passenger Vehicles 2003-2004 to 2007-2008 growth rate assumed 10% / year.<br />
Emerging Market Potential for Seat Belts & Webbing<br />
3.13 Based on the past performance and the projected market for four wheeler sector as<br />
presented in the earlier paragraphs the demand for seat belts and webbings has been<br />
worked out.<br />
3.14 It is assumed that each Passenger Car / MUV would be fitted with four seat belts<br />
and commercial vehicles with two seat belts. Provision has also been made for retail sale<br />
of seat belts for vehicles on the road but not fitted with the seat belts and also the possible<br />
replacement demand (if any). Further it is assumed that each seat belt will have a<br />
standard length of 3 meters and width of 50 mm.<br />
3.15 Accordingly market potential for seat belts and the webbings has been worked out.<br />
Market<br />
2001-2002<br />
V. (Rs.<br />
Q.<br />
Crs.)<br />
2003-2004 (Est.)<br />
V. (Rs.<br />
Q.<br />
Crs.)<br />
2007-2008<br />
(Projected)<br />
V. (Rs.<br />
Q.<br />
Crs.)<br />
Seat Belts (S.B.) 1.92 96.00 5.19 259.50 7.45 372.50<br />
million<br />
million<br />
million<br />
nos.<br />
nos.<br />
nos.<br />
Seat Belt Webbings 5.76 9.22 15.57 24.91 22.35 35.76<br />
(Average price Rs. 16 / million<br />
million<br />
million<br />
mtr.)<br />
mtrs.<br />
mtrs.<br />
mtrs.<br />
Market Potential for other rigid webbings<br />
3.16 The project has the flexibility to take up the production of other rigid narrow and<br />
heavy duty webbings such as Slings, Parachute belts, Net webbings, Break Parachute<br />
Webbings, Supply Dropping Parachute Webbing, Military belts, Cargo Lifting tape,<br />
Safety Harness, Luggage Straps, etc.<br />
3.17 These products are being manufactured by companies like, Todi and Co., Motilal<br />
Dalichand Co. Pvt. Ltd. (Kanpur), Viraj Syntex (Kanpur), India Cordage Factory, etc.<br />
Also there are units in the decentralised sector.<br />
67
Appendix – 5A (Contd…)<br />
3.18 Amongst the major producers, Todi & Co is the market leader with an annual<br />
turnover of around Rs. 10 crores, largely meeting the requirement of Defence forces and<br />
the established producers of rigid webbings for other applications. These webbings are<br />
manufactured from NFY, PFY and PP.<br />
3.19 As per the industry sources, the total market for these rigid webbings (excluding<br />
seat belt webbing) was around Rs. 24 crores in 2001-02 and nearly 40-50% is consumed<br />
by the Defence sector . The demand for these webbings is expected to increase at the rate<br />
of 8-12% per annum.<br />
3.20 Accordingly, the market potential for these webbings would increase from Rs.<br />
23.58 crores (2001-02) to Rs 27.50 crores (2003-04) and Rs. 40.26 crores<br />
(2007-08).<br />
Aggregate Market Potential for Automotive Seat Belt Webbing and other<br />
Rigid Webbings<br />
2001-2002 2003-2004 (Est.) 2007-2008 (Proj.)<br />
Market<br />
Q.<br />
V. (Rs.<br />
Crs.)<br />
Q.<br />
V. (Rs.<br />
Crs.)<br />
Q.<br />
V. (Rs.<br />
Crs.)<br />
Seat Belts 1.92 96.00 5.19 259.50 7.45 372.50<br />
million<br />
million<br />
million<br />
nos.<br />
nos.<br />
nos.<br />
Seat Belt Webbings 5.76 9.22 15.57 24.91 22.35 35.76<br />
million<br />
million<br />
million<br />
mtrs.<br />
mtrs.<br />
mtrs.<br />
Other Rigid Webbings 29.47 23.58 34.38 27.50 50.33 40.26<br />
million<br />
million<br />
million<br />
mtrs.<br />
mtrs.<br />
mtrs.<br />
Total Webbings 35.23 32.80 49.95 52.41 72.68 76.02<br />
million<br />
million<br />
million<br />
mtrs.<br />
mtrs.<br />
mtrs.<br />
3.21 All the Major seat belt producers are to a great extent dependent on the imported<br />
webbings. Thus there is scope for investment opportunities in Seat Belt Webbings project<br />
and it will also be an attempt towards indigenisation<br />
68
Appendix – 5A (Contd…)<br />
SECTI<strong>ON</strong> II: SEAT-BELT WEBBING TECHNOLOGY AND<br />
EQUIPMENTS SUPPLIERS<br />
3.22 TECS, has contacted indigenous and global technology and equipment suppliers<br />
for seat-belt webbing (rigid narrow fabric).<br />
3.23 Our study has revealed that the needle looms and processing machinery required<br />
for elastic narrow fabrics and general purpose rigid narrow fabrics is available<br />
indigenously but similar equipment for seat belt webbing needs to be imported.<br />
3.24 The technology and equipment suppliers contacted by TECS are:<br />
International:<br />
1. Mageba Textilmaschinen GmbH, (Germany)<br />
2. Jacob Muller AG (Germany)<br />
3. Kyang Yhe Delicate Machine Co. Ltd. (Taiwan)<br />
Indian Representative :<br />
S. K. Overseas<br />
Princess Street, Mumbai - 400 002<br />
Tel.: 2200 0823<br />
Fax : 2206 4687<br />
4. Comez Spa, (Italy)<br />
Indian: (do not supply machinery for seat belt webbing)<br />
1. Ravitex Machines, Ghaziabad<br />
2. Trikso Industries, Ahmedabad<br />
3. Prashant Texmach, Ahmedabad<br />
Notes: The list contains the leading global players in the seat belt webbing<br />
technology and as per the discussion with Industry experts the above list is<br />
exhaustive.<br />
3.25 The known major player who has supplied machinery for seat belt webbing to<br />
global players is Kyang Yhe, Taiwan. For comparison Mageba quotation was studied.<br />
3.26 The Process Description for the Webbing is as shown below and the stages<br />
involved in the dyeing process also follows:<br />
69
Manufacturing Process:<br />
Appendix – 5A (Contd…)<br />
RAW MATERIAL LABORATORY CHECKING<br />
(YARN) <strong>OF</strong> RAW MATERIAL<br />
PREPARATI<strong>ON</strong> <strong>OF</strong><br />
CHEMICALS FOR<br />
DYEING<br />
Process Flow of Dyeing:<br />
FEEDING <strong>OF</strong> YARN<br />
<strong>ON</strong> CREEL (WARPING)<br />
WEAVING<br />
DYEING & STRETCHING<br />
& SETTING<br />
QUALITY CHECKING<br />
WINDING<br />
PACKING<br />
WARE HOUSE<br />
GREY FABRIC FROM WEAVING<br />
PRE FEED-IN DEVICE WITH TENSI<strong>ON</strong> C<strong>ON</strong>TROL<br />
DYEING TANK<br />
INFRARED PRE-DRYING<br />
HIGH TEMPERATURE CHAMBER (GAS TYPE) 80 Y<br />
HIGH TEMPERATURE EXTENSI<strong>ON</strong> CHAMBER 50 Y<br />
DYEING TANK<br />
CHAMBER (STEAM TYPE) 80 Y<br />
HOT WASHING TANK<br />
DRYING CYLINDER 30 * 650 MM<br />
TAKE <strong>OF</strong>F DEVICE<br />
ELECTRIC C<strong>ON</strong>TROL BOX<br />
AC INVERTER MOTOR<br />
FINISHED TAPE<br />
70
Process Systems and Equipments<br />
3.27 The machinery items required for the webbing project are:<br />
1. High Speed Automatic Needle Looms.<br />
2. Warp Yarn Tension Control Device.<br />
3. Tape Collection Device.<br />
4. Cone Creel of 600 ends.<br />
5. Continous Dyeing Machine.<br />
Appendix – 5A (Contd…)<br />
6. Steam Boiler, Compressor & Effluent Treatment Plant.<br />
7. Packing Machine<br />
8. Testing Lab Equipment (Breaking Strength, Colour Fastness,<br />
etc.)<br />
Minimum Recommended Economic Size:<br />
3.28 The seat-belt webbing project proposed to be set up in India will have a designed<br />
capacity of 1111 mt per hour ( 18.52 mtr / min) based on Dyeing and processing<br />
equipment meant for seat belt webbing project.<br />
3.29 Under Indian operating conditions it is safer to assume machine efficiency factor<br />
of 75%, and therefore the production would be 833.33 mt per hour (833 mt per hour).<br />
3.30 The plant would operate in three shifts, 24 hours and 300 working days in a year.<br />
Investment in Process Plant and Machinery<br />
3.31 As per the indicative budgetary quotations, the investment in the process plant<br />
and machinery will be Rs 0.92 crores (CIF) including 10% discount. Finer details on the<br />
Equipment specifications and the formal quotations need to be discussed with the<br />
technology supplier before the project is taken up. Taking into account the custom duties<br />
(5%), inland transportation, loading and unloading (2%), erection and commissioning<br />
(5%), the installed cost of process equipment would be Rs 1.04 crores.<br />
3.32 Seat belt webbing can also be manufactured using Dope Dyed High Tenasity<br />
Polyester Filament Yarn (HTPFY). thereby reducing the project cost by eliminating<br />
certain sections in the processing equipments. The highlights of Option II are presented<br />
separately at the end of section III of this chapter. However, the selection of webbing for<br />
seat belt by different technologies is finally left to the seat belt manufacturers.<br />
71
Appendix – 5A (Contd…)<br />
SECTI<strong>ON</strong> III : PROJECT COST & PR<strong>OF</strong>ITABILITY<br />
PROJECTI<strong>ON</strong>S<br />
Land<br />
3.33 The total requirement of land for this project keeping in mind the possible future<br />
expansion is around 2000 Sq. Mtrs. ( 0.5 acres ).<br />
3.34 Based on the available information the cost of land is assumed at Rs 1200 per<br />
square meter ( including the developmental cost ).Depending on the exact location of the<br />
project to be determined by the promoter the land cost could be higher or lower. Hence<br />
the total cost of developed land will be Rs 0.24 crores.<br />
Buildings<br />
3.35 The building area comprising of main factory building, godowns, office , R & D<br />
labs / In-house Testing centre etc. would be 1000 sq. mtrs. The cost of construction<br />
would again vary depending on the structure and the materials to be used. It has been<br />
assumed that the average cost of construction would be Rs 4500 per sq. mtr. Thus the<br />
total cost of building and other civil works would be around Rs 0.45 crores.<br />
Plant and Machinery<br />
3.36 Details of Plant and machinery as well as technology required for the project have<br />
been presented in earlier Section II . The installed cost of plant and machinery would be<br />
Rs 1.04 crores.<br />
3.37 Apart from the main process equipments the utilities required are:<br />
• Electricals,<br />
• Piping,<br />
• Power,<br />
• Water supply,<br />
• Compressors,<br />
• Fire Fighting Equipments etc.<br />
3.38 The provision on this count is taken as 5 % of the cost of machinery which works<br />
out to Rs 0.15 crores.<br />
Miscellaneous Fixed Assets<br />
3.39 Under this head the items included are Furniture and fixtures, Office equipments,<br />
Air Conditioners etc. and the provision made is around Rs 0.10 crores (Rs 10 lakhs).<br />
72
Testing Equipments<br />
Appendix – 5A (Contd…)<br />
3.40 The following testing equipments are required for the Narrow Fabric plant:<br />
• Tensile Strength,<br />
• Crockometer : To check the colour fastness to rubbing and perspiration,<br />
• Stiffness testing : Softness,<br />
• Thickness Guaze<br />
3.41 The Testing and R&D facilities would call for an investment of around Rs 0.10<br />
crores (Rs 10 lakhs)<br />
Project Engineering and Consulting<br />
3.42 Under this head the items included are the fees and expenses on account of<br />
Architect fees, project engineering and management (both local and overseas ), detailed<br />
project reports etc.<br />
Preliminary & Preoperative Expenses<br />
3.43 The items included under this head are company formation expenses, public issue<br />
expenses (if any), interest during construction, pre-production expenses, during the<br />
implementation phase etc. .<br />
Contingency Expenses<br />
3.44 Depending on the gestation period and further detailing of the project cost by the<br />
promoter, the contingency provision has been made at the rate of 10%.<br />
Margin Money for Working capital<br />
3.45 The margin money for working capital forming part of the total project cost would<br />
be Rs 0.23 crores .[Exhibit 3.3]<br />
Total Project Cost (Total Investment)<br />
3.46 The total project cost as given in Exhibit 3.1 would be Rs 2.80 crores.<br />
Project Funding And Financing Pattern<br />
3.47 It has been assumed that the project would be financed through long term funds<br />
and Equity participation by the Promoter / Public. The technical textile sector being a<br />
high priority area, it is assumed that a Debt- Equity ratio of 1.5 : 1 would be feasible.<br />
73
Appendix – 5A (Contd…)<br />
(However the sensitivity analysis has also been presented for 1 : 1 and 2 : 1 Debt Equity<br />
ratios.)<br />
Sales , Profitability And Sensitivity Analysis<br />
Sales Realisation and Turnover<br />
3.48 As per the details available from the Technology and Equipment suppliers the<br />
economic size of a plant is 1111 mt per hour.<br />
3.49 Under the Indian conditions, it is assumed that the machine would operate at an<br />
efficiency level of 75 %. Hence the production from the plant would be 833.33 mt per<br />
hour (833 mt. per hr.).<br />
3.50 The plant would operate on Three -shift basis and 300 workings days in a year.<br />
3.51 The capacity utilisation for the 1st year is assumed at 50% and thereafter for the<br />
2nd, 3rd and 4th year onwards 60%, 75% and 90% respectively.<br />
3.52 The average selling price of the end product would be Rs 15/mt (net of excise<br />
duties, sales tax and other incidental expenses). The current price of imported webbing is<br />
Rs 15-20 per mt.<br />
3.53 The details of sales turnover projected are given in Exhibit 3.2.<br />
Cost of Production<br />
Major Raw materials and their specifications<br />
3.54 The main raw materials used and the corresponding prevailing indicative prices<br />
are as follows:<br />
Major Raw Materials Basic Price Remarks ( Imp. duty)<br />
Polyester High Tenacity Yarn<br />
(for Warp 1500 denier<br />
for Weft 750 denier)<br />
$1.80 per kg (CIF )<br />
Landed Cost : Rs 110 per kg<br />
Dyestuff Rs 1.50 per mtr. ( Landed Cost )<br />
20%<br />
(BCD : 20 %)<br />
3.55 High Tenacity Poly Filament Yarn ( PFY ) is not available locally and is currently<br />
imported.<br />
74
International Suppliers:<br />
(a) Enka , USA<br />
(b) Teijin , Japan<br />
(c) Corica Fibres , Korea.<br />
Conversion Cost<br />
Appendix – 5A (Contd…)<br />
3.56 The conversion cost will include the cost of power, water, consumables, etc.<br />
which is assumed at Rs 0.60 per mtr.<br />
Manpower, Salaries and Wages<br />
3.57 The manpower requirements and the salary structure is given in Exhibit 3.4.<br />
3.58 The total manpower requirement comprising of supervisors , machine operators,<br />
helpers and the managerial cadre would be 64 nos. and the annual expenses on this count<br />
would be Rs 0.70 crores<br />
Factory and Overhead Expenses<br />
3.59 The items covered under this head are repairs and maintenance, establishment<br />
expenses, travel expenses, packaging expenses, etc.<br />
Marketing and Promotional Expenses<br />
3.60 The promotion of seat-belt webbing will call for expenditure on this account and a<br />
provision of 2.5% of sales has been made uniformly over the years.<br />
Interest and Depreciation<br />
3.61 The prevailing interest rate for long term and short term borrowed funds is<br />
assumed at 5% and 11% per annum respectively. (Technology Upgradation Fund).<br />
3.62 The repayment of loans has been assumed for 10 years with two years moratorium<br />
(2+8).<br />
3.63 The depreciation rates as per the Company Law and Income-Tax Ready Reckoner<br />
have been worked out for Straight Line and WDV Method basis.<br />
3.64 The current corporate tax rate is assumed at 35 % and the surcharge is assumed at<br />
2.5% per annum.<br />
75
Profitability, Break-even, IRR and Payback .<br />
Appendix – 5A (Contd…)<br />
3.65 The Sales turnover increases from Rs 4.41 Cr. in the first year to Rs 7.94 Cr.<br />
from the 4th year onwards.<br />
3.66 The PBT increases from Rs 0.03 Cr. in the first year to Rs. 0.82 Cr. from the<br />
fourth year onwards. (See Exhibit 3.5)<br />
3.67 The Break Even of the project is at 62.39%.<br />
3.68 The Internal Rate of Return ( IRR ) has been worked out at 16.00%.<br />
3.69 The Payback period for the project is 5.31 years .<br />
Sensitivity Analysis:<br />
3.70 The sensitivity analysis has been presented in the Exhibit 3.6<br />
DEVELOPMENTAL AND PROMOTI<strong>ON</strong>AL MEASURES<br />
3.71 At a Selling price of Rs 15 per meter and the existing custom duty structure of<br />
20% on High Tenacity Poly Filament Yarn ( Rs 110 per kg - Landed Cost ), the project is<br />
not very attractive.<br />
3.72 Hence the sensitivity of the project at lower landed cost of HTPFY at Rs 100 per<br />
kg will give an IRR of 24.50%. (Against 16.00% IRR for Landed Cost of PFY at Rs 110<br />
per kg ).<br />
3.73 The duty on the HT PFY has to be reduced and made lower than the Finished<br />
Goods (Seat Belts) or else it becomes difficult to compete due to similar duty structure<br />
(i.e., 20%) on both the items.<br />
3.74 The desired duty on the raw material HTPFY should be reduced to 5% from the<br />
prevailing 20%.<br />
3.75 Similarly, at a selling price of Rs 18 and Rs 20 per mtr the IRR comes to 43.07%<br />
and 58.19% as against an IRR of 16.00% at selling price of Rs 15 per mt.<br />
3.76 The European and US markets require OEKOTEX Certificate for the exported<br />
products (proof of the absence of any harmful dyes) from the European laboratories only.<br />
However in India, nonstandard products (webbing) enter the domestic market killing the<br />
webbing market.<br />
3.77 Most of the existing players have their own testing facilities for the raw material<br />
and finished goods testing. SASMIRA, BTRA carry out Grip Testing.<br />
76
Appendix – 5A (Contd…)<br />
3.78 This machinery is not recommended for Tape required for Zip fasteners because<br />
such tapes can be manufactured using the local low cost machinery.<br />
3.79 The regulatory measures for the mandatory installation of Four Seat Belts for<br />
passenger cars are in place under the Motor Vehicles Act. However the use of seat belts<br />
has not been enforced in all the states.<br />
3.80 The Automotive Research Association of India (ARAI) , Pune has the latest<br />
testing facilities for Webbing as well as Seat Belts. All the existing seat belt<br />
manufacturers have their in-house testing facilities, both for Seat Belt and Webbing.<br />
3.81 Keeping in mind the rapid changes in the automobile industry, the Ministry of<br />
Heavy Industries and Public Enterprise proposes to set up two new testing centres for<br />
the automobile industry.<br />
3.82 The globally recognised automotive testing agencies are IDIADA Automotive<br />
Technology (Spain), AIB - Vincotte International (Belgium), MIRA (UK), LTC Ltd.<br />
(UK) and Millbrook (UK).<br />
OPTI<strong>ON</strong> - II (Seat Belt Webing Project Based On Purchased Dope Dyed HTPFY)<br />
3.83 There is a second option of using purchased HTPFY Dope Dyed Yarn (Tenacity<br />
7.6-7.8, Filaments 96, Elongation 16) in denier range of 500/700/1000/1500. This is not<br />
being manufactured in the country and Far Eastern Textiles, Taiwan is the well-known<br />
supplier. The indicative price of the yarn is $2.50 per kg and the landed cost works out to<br />
Rs 140 per kg.<br />
3.84 The modified process chart for Dope Dyed Yarn is as follows:<br />
GREY FABRIC FROM WEAVING<br />
PRE FEED-IN DEVICE WITH TENSI<strong>ON</strong> C<strong>ON</strong>TROL<br />
HIGH TEMPERATURE EXTENSI<strong>ON</strong> CHAMBER 50 Y<br />
TAKE <strong>OF</strong>F DEVICE<br />
ELECTRIC C<strong>ON</strong>TROL BOX<br />
AC INVERTER MOTOR<br />
FINISHED TAPE<br />
3.85 This eliminates the dyeing machine, thus reducing the project cost from Rs 2.80 cr<br />
to Rs 1.82 crore.<br />
77
Appendix – 5A (Contd…)<br />
3.86 The PBT increases from Rs 0.06 Cr. in the first year to Rs. 0.76 Cr. from the<br />
fourth year onwards.<br />
3.87 The Break Even of the project is at 61.24%. The Internal Rate of Return ( IRR )<br />
has been worked out at 20.20%. The Payback period for the project is 4.67 years .<br />
COMPARISI<strong>ON</strong> <strong>OF</strong> ALTERNATE TECHNOLOGIES FOR SEAT BELT<br />
Technology / Particulars<br />
WEBBING PROJECT<br />
OPTI<strong>ON</strong> - I<br />
With dying &<br />
processing plant<br />
Seat Belt Webbing Project<br />
OPTI<strong>ON</strong> - II<br />
Using dope dyed yarn<br />
(HTPFY)<br />
Capacity (18.52 mtrs / min) 1111 mt. / hr 1111 mt. / hr<br />
Project Cost Rs. 2.80 Cr. Rs. 1.82 Cr.<br />
Revenue (1st year) Rs. 4.41 Cr. Rs. 4.41 Cr.<br />
BEP 62.39% 61.24%<br />
IRR 16.00% 20.20%<br />
Payback 5.31 years 4.67 years<br />
78
EXHIBIT 3.1<br />
Appendix – 5A (Contd…)<br />
PROJECT COST<br />
(LAND, BUILDINGS, PROCESS PLANT & MACHINERY, UTILITIES &<br />
O<strong>THE</strong>R ASSETS)<br />
1<br />
2<br />
Land<br />
(Area: 2000 Sq. Mtrs.)<br />
Rate: (Rs.1200 /Sq. Mtr)<br />
Buildings<br />
(Plant Area, Office, Godown, Lab, Service Area etc.)<br />
Built-up Area : 1000 Sq. Mtrs<br />
Avg Rate : Rs.4500 /Sq. Mtrs<br />
3 Process Plant & Equipment<br />
4<br />
Utility & Other equipments<br />
(Compressor, Stem Boiler, Effluent Treatment Plant, etc.)<br />
5 Testing Equipments<br />
6<br />
Misc. Fixed Assets<br />
(Furniture & Fixtures, Office Equipment, etc.)<br />
7 Project Engineering & Consultancy charges (2.5%)<br />
8<br />
Preliminary & Pre-operative Expenses (12%)<br />
(Company Formation, Interest during construction,<br />
pre-production expenses, etc.)<br />
9 Contingency (10 %)<br />
10 Total<br />
11 Margin Money for Working Capital<br />
12 Total Project Cost<br />
Project Cost (Rs. Cr.)<br />
0.24<br />
0.45<br />
1.04<br />
0.15<br />
0.10<br />
0.10<br />
0.04<br />
0.22<br />
0.23<br />
2.58<br />
0.23<br />
2.80<br />
79
ITEM<br />
EXHIBIT 3.2<br />
Appendix – 5A (Contd…)<br />
ESTIMATI<strong>ON</strong> <strong>OF</strong> SALES REVENUE<br />
(Rs. Cr.)<br />
YEAR <strong>OF</strong> OPERATI<strong>ON</strong><br />
I II III IV V VI VII VIII IX X<br />
Average Production per hr (mt.) 1111 1111 1111 1111 1111 1111 1111 1111 1111 1111<br />
75% efficiency 833 833 833 833 833 833 833 833 833 833<br />
Capacity Utilisation 50% 60% 75% 90% 90% 90% 90% 90% 90% 90%<br />
Actual Production per hr (mt.) 417 500 625 750 750 750 750 750 750 750<br />
Production per day (mt.) 9999 11999 14999 17998 17998 17998 17998 17998 17998 17998<br />
Production for 300 working days (mt.) 2999700 3599640 4499550 5399460 5399460 5399460 5399460 5399460 5399460 5399460<br />
Selling Price (Rs/mt.) 15.00 15.00 15.00 15.00 15.00 15.00 15.00 15.00 15.00 15.00<br />
Sales Revenue (Rs. Cr) 4.50 5.40 6.75 8.10 8.10 8.10 8.10 8.10 8.10 8.10<br />
Value Loss ( 2% ) 0.09 0.11 0.13 0.16 0.16 0.16 0.16 0.16 0.16 0.16<br />
Net Sales Revenue (Rs. Cr) 4.41 5.29 6.61 7.94 7.94 7.94 7.94 7.94 7.94 7.94<br />
80
ITEM<br />
Factory Related<br />
Raw materials & other<br />
commodities<br />
NO. <strong>OF</strong><br />
M<strong>ON</strong>THS<br />
MARGIN<br />
(%)<br />
W.CAP<br />
REQMT<br />
EXHIBIT 3.3<br />
REQUIREMENT <strong>OF</strong> WORKING CAPITAL<br />
Appendix – 5A (Contd…)<br />
YEAR I YEAR II YEAR III YEAR IV YEAR V<br />
MARGIN<br />
M<strong>ON</strong>EY<br />
BANK<br />
FINANCE<br />
W.CAP<br />
REQMT<br />
MARGIN<br />
M<strong>ON</strong>EY<br />
BANK<br />
FINANCE<br />
W.CAP<br />
REQMT<br />
MARGIN<br />
M<strong>ON</strong>EY<br />
BANK<br />
FINANCE<br />
W.CAP<br />
REQMT<br />
MARGIN<br />
M<strong>ON</strong>EY<br />
BANK<br />
FINANCE<br />
W.CAP<br />
REQMT<br />
MARGIN<br />
M<strong>ON</strong>EY<br />
1.00 25.00 0.21 0.05 0.16 0.25 0.06 0.19 0.31 0.08 0.23 0.37 0.09 0.28 0.37 0.09 0.28<br />
Finished Goods 1.00 25.00 0.34 0.09 0.26 0.40 0.10 0.30 0.48 0.12 0.36 0.56 0.14 0.42 0.57 0.14 0.43<br />
A/c Receivable 1.00 25.00 0.37 0.09 0.28 0.44 0.11 0.33 0.55 0.14 0.41 0.66 0.17 0.50 0.66 0.17 0.50<br />
Cash in hand<br />
Salaries & wages 1.00 0.00 0.06 0.00 0.06 0.06 0.00 0.06 0.06 0.00 0.06 0.07 0.00 0.07 0.07 0.00 0.07<br />
Utilities 1.00 0.00 0.05 0.00 0.05 0.06 0.00 0.06 0.08 0.00 0.08 0.09 0.00 0.09 0.09 0.00 0.09<br />
Advertising & Promotional<br />
Expenses<br />
1.00 0.00 0.01 0.00 0.01 0.01 0.00 0.01 0.01 0.00 0.01 0.02 0.00 0.02 0.02 0.00 0.02<br />
Admin. Overheads 1.00 0.00 0.01 0.00 0.01 0.01 0.00 0.01 0.01 0.00 0.01 0.01 0.00 0.01 0.01 0.00 0.01<br />
Total Requirement 1.04 0.23 0.81 1.22 0.27 0.95 1.50 0.34 1.17 1.78 0.40 1.38 1.79 0.40 1.39<br />
(Rs.Cr)<br />
BANK<br />
FINANCE<br />
81
ITEM<br />
Factory Related<br />
Raw materials & other<br />
commodities<br />
NO. <strong>OF</strong><br />
M<strong>ON</strong>THS<br />
MARGIN<br />
(%)<br />
W.CAP<br />
REQMT<br />
EXHIBIT 3.3 (Contd..)<br />
REQUIREMENT <strong>OF</strong> WORKING CAPITAL<br />
Appendix – 5A (Contd…)<br />
YEAR VI YEAR VII YEAR VIII YEAR XI YEAR X<br />
MARGIN<br />
M<strong>ON</strong>EY<br />
BANK<br />
FINANCE<br />
W.CAP<br />
REQMT<br />
MARGIN<br />
M<strong>ON</strong>EY<br />
BANK<br />
FINANCE<br />
W.CAP<br />
REQMT<br />
MARGIN<br />
M<strong>ON</strong>EY<br />
BANK<br />
FINANCE<br />
W.CAP<br />
REQMT<br />
MARGIN<br />
M<strong>ON</strong>EY<br />
BANK<br />
FINANCE<br />
W.CAP<br />
REQMT<br />
MARGIN<br />
M<strong>ON</strong>EY<br />
1.00 25.00 0.37 0.09 0.28 0.37 0.09 0.28 0.37 0.09 0.28 0.37 0.09 0.28 0.37 0.09 0.28<br />
Finished Goods Stock 1.00 25.00 0.57 0.14 0.43 0.58 0.14 0.43 0.59 0.15 0.44 0.59 0.15 0.45 0.60 0.15 0.45<br />
A/c Receivable 1.00 25.00 0.66 0.17 0.50 0.66 0.17 0.50 0.66 0.17 0.50 0.66 0.17 0.50 0.66 0.17 0.50<br />
Cash in hand<br />
Salaries & wages 1.00 0.00 0.08 0.00 0.08 0.08 0.00 0.08 0.09 0.00 0.09 0.10 0.00 0.10 0.10 0.00 0.10<br />
Utilities 1.00 0.00 0.00 0.00 0.00 0.00 0.00 0.00 0.00 0.00 0.00 0.00 0.00 0.00 0.00 0.00 0.00<br />
Advertising & Promotional<br />
Expenses<br />
1.00 0.00 0.00 0.00 0.00 0.00 0.00 0.00 0.00 0.00 0.00 0.00 0.00 0.00 0.00 0.00 0.00<br />
Admin. Overheads 1.00 0.00 0.02 0.00 0.02 0.02 0.00 0.02 0.02 0.00 0.02 0.02 0.00 0.02 0.02 0.00 0.02<br />
Total Requirement 1.80 0.40 1.40 1.81 0.40 1.41 1.82 0.41 1.42 1.84 0.41 1.43 1.85 0.41 1.44<br />
(Rs.Cr)<br />
BANK<br />
FINANCE<br />
82
EXHIBIT 3.4<br />
MANPOWER REQUIREMENTS<br />
Nos Monthly Total Monthly Annual<br />
General Manager 1 30000 30000 360000<br />
Production Manager 1 20000 20000 240000<br />
Supervisor -Dyeing 3 10000 30000 360000<br />
Supervisor -Weaving 3 10000 30000 360000<br />
Labour for Looms 18 5000 90000 1080000<br />
Labour for Dyeing 9 5000 45000 540000<br />
Labour for Packing 9 5000 45000 540000<br />
Machine Operators 3 6000 18000 216000<br />
Machine Helper (Semi Skilled) 8 3000 24000 288000<br />
R&D, Testing 1 10000 10000 120000<br />
Marketing Head 1 25000 25000 300000<br />
Marketing & Sales Staff 2 12000 24000 288000<br />
Clerical Staff 2 6000 12000 144000<br />
Other Staff 2 3000 6000 72000<br />
Maintenance (Elec. & Mech.) 1 10000 10000 120000<br />
TOTAL 64 419000 5028000<br />
Fringe Benefits (40 % of the above) 2011200<br />
Total Wage Bill (Annual) Rs. :<br />
Total Wage Bill (Annual) Rs. Cr. :<br />
Salary + Other Benefits =<br />
7039200.00<br />
0.70392<br />
Appendix – 5A (Contd…)<br />
83
EXHIBIT 3.5<br />
Appendix – 5A (Contd…)<br />
PR<strong>OF</strong>ITABILITY STATEMENT AND COMPUTATI<strong>ON</strong> <strong>OF</strong> TAX<br />
ACCOUNT HEAD<br />
I II<br />
FINANCIAL YEAR <strong>OF</strong> OPERATI<strong>ON</strong><br />
III IV V VI VII VIII IX<br />
(Rs.Cr)<br />
X<br />
Revenue<br />
Net Sales Turnover 4.41 5.29 6.61 7.94 7.94 7.94 7.94 7.94 7.94 7.94<br />
Total Revenue<br />
Expenses<br />
4.41 5.29 6.61 7.94 7.94 7.94 7.94 7.94 7.94 7.94<br />
Raw Materials 2.49 2.99 3.74 4.48 4.48 4.48 4.48 4.48 4.48 4.48<br />
Salaries & wages 0.70 0.74 0.78 0.81 0.86 0.92 1.00 1.08 1.16 1.26<br />
Conversion Cost 0.62 0.75 0.93 1.12 1.12 1.12 1.12 1.12 1.12 1.12<br />
Repairs & Maintenance 0.02 0.02 0.02 0.02 0.02 0.02 0.02 0.02 0.02 0.02<br />
Marketing & Promotional Expenses 0.11 0.13 0.17 0.20 0.20 0.20 0.20 0.20 0.20 0.20<br />
Factory & Office Overheads 0.14 0.14 0.14 0.14 0.14 0.14 0.14 0.14 0.14 0.14<br />
Interest on S.T. Loans 0.09 0.10 0.13 0.15 0.15 0.15 0.15 0.16 0.16 0.16<br />
Cost of Sales 4.17 4.87 5.90 6.92 6.97 7.04 7.11 7.19 7.28 7.37<br />
Depreciation (St.Line) 0.12 0.12 0.12 0.12 0.12 0.12 0.12 0.12 0.12 0.12<br />
Amort. of Expenses 0.01 0.01 0.01 0.01 0.01 0.01 0.00 0.00 0.00 0.00<br />
Interest on L.T Loan 0.08 0.08 0.08 0.07 0.06 0.05 0.04 0.03 0.02 0.01<br />
Profit Before Tax 0.03 0.22 0.52 0.82 0.79 0.73 0.67 0.60 0.53 0.44<br />
Tax 0.00 0.02 0.05 0.25 0.26 0.25 0.24 0.22 0.20 0.17<br />
Profit After Tax 0.03 0.19 0.46 0.57 0.53 0.48 0.44 0.38 0.33 0.27<br />
Dividend 0.00 0.00 0.06 0.06 0.06 0.11 0.11 0.11 0.11 0.11<br />
Profits For Appropriation 0.03 0.19 0.41 0.51 0.48 0.37 0.32 0.27 0.21 0.15<br />
84
EXHIBIT 3.5 (Contd..)<br />
Appendix – 5A (Contd…)<br />
PR<strong>OF</strong>ITABILITY STATEMENT AND COMPUTATI<strong>ON</strong> <strong>OF</strong> TAX<br />
ACCOUNT HEAD<br />
COMPUTATI<strong>ON</strong> <strong>OF</strong> TAX<br />
I II<br />
FINANCIAL YEAR <strong>OF</strong> OPERATI<strong>ON</strong><br />
III IV V VI VII VIII IX<br />
(Rs.Cr)<br />
X<br />
Profit after interest before depreciation 0.15 0.33 0.63 0.94 0.91 0.85 0.79 0.72 0.64 0.56<br />
Depr.(WDV) to be claimed 0.46 0.67 0.61 0.22 0.17 0.14 0.11 0.09 0.07 0.06<br />
Depreciation claimed 0.15 0.33 0.61 0.22 0.17 0.14 0.11 0.09 0.07 0.06<br />
Depr. carried forward 0.31 0.34 0.00 0.00 0.00 0.00 0.00 0.00 0.00 0.00<br />
Taxable Profit 0.00 0.00 0.02 0.72 0.73 0.71 0.68 0.63 0.57 0.50<br />
Profit Before Tax (Book) 0.03 0.22 0.52 0.82 0.79 0.73 0.67 0.60 0.53 0.44<br />
Minimum Alternate Tax 0.00 0.02 0.05 0.00 0.00 0.00 0.00 0.00 0.00 0.00<br />
Tax (Actual) 0.00 0.00 0.01 0.25 0.26 0.25 0.24 0.22 0.20 0.17<br />
Tax Provision 0.00 0.02 0.05 0.25 0.26 0.25 0.24 0.22 0.20 0.17<br />
85
EXHIBIT NO. 3.6<br />
SENSITIVITY ANALYSIS<br />
Items Profit after Tax<br />
(PAT)<br />
( assumed at 90 %<br />
capacity )<br />
Break<br />
Even<br />
(%)<br />
Internal<br />
Rate of<br />
Return<br />
(IRR)<br />
(%)<br />
Payback<br />
Period<br />
(Years)<br />
NORMAL VALUES 0.57 62.39 16.00 5.31<br />
Debt Equity Ratios<br />
(a) 2:1<br />
(b) 1:1<br />
Increase in Project Cost<br />
10 %<br />
Increase in Selling Price to<br />
(a) Rs 18 per mtr<br />
(b) Rs 20 per mtr<br />
0.57 62.74 16.06 5.29<br />
0.58 61.87 16.10 5.28<br />
0.80 63.34 14.69 5.61<br />
1.57<br />
2.23<br />
37.29<br />
29.70<br />
43.07<br />
58.19<br />
2.61<br />
2.08<br />
Decrease in Raw Material<br />
Price to Rs 100 per kg 0.84 52.29 24.50 5.02<br />
Appendix – 5A (Contd…)<br />
* Current International price HTPFY is $1.80/kg (Rs. 82.80/Kg-CIF)+Customs duty structure of BCD - 20%<br />
All selling prices are net of excise duty, sales tax and other local levies.<br />
86
MULTIPURPOSE COATING PROJECT<br />
Appendix – 5A (Contd…)<br />
SECTI<strong>ON</strong> I: PRODUCT BRIEF, APPLICATI<strong>ON</strong> AREAS & MARKET<br />
POTENTIAL<br />
4.1 In the field of Technical Textiles , coated fabrics form one of the most important segments.<br />
Coating operation (also Lamination and Impregnation) is carried out to impart certain characteristics and<br />
desirable properties for the end-use application of the product.<br />
4.2 The different substrates ( base fabric ) used are Wovens, Non Wovens and Knitted fabrics<br />
manufactured from Polyester, Nylon, Polypropylene, Acrylic, Cotton, Rayon, Wool , Jute etc.<br />
Polyester fabric<br />
4.3 Polyester is a cost effective fabric that possesses a wide range of benefits such as good abrasion<br />
resistance, good electricity insulation properties, low creep and good weatherability. They are not affected<br />
by strong acids , alkalis and common industrial solvents.<br />
Nylon fabric<br />
4.4 Nylon has exceptional abrasion resistance, as well as resistance to most strong bases, dilute acids<br />
and solvents, insects and most micro-organisms. Nylon can be blended with other fibers to impart strength,<br />
high flexibility and abrasion resistance to the fabric.<br />
Rayon fabric<br />
4.5 Rayon is moisture absorbent and does not build up static electricity. Rayon can be manufactured to<br />
possess varying levels of properties such as strength, ignition resistance and absorbency.<br />
Silk fabric<br />
4.6 Silk is one the strongest natural fibers and has a relatively high standard moisture regain. Silk is<br />
resistant to mild dew and many bacteria and fungi, but is attacked by rot-producing bacteria.<br />
Cotton fabric<br />
4.7 Cotton fabrics are resistant to strong alkali,organic solvents, bleaches and heat. Cotton is suitable<br />
for blending with other materials to achieve unique combinations not found in other materials alone.<br />
4.8 The chemicals used for coating are PVC (Vinyl), Polyurethane (PU), Acrylic , Rubber etc.<br />
PVC (Polyvinyl Chloride) coating material<br />
4.9 PVC is the most widely used coating material because of its low cost , versatility and performance<br />
properties. It is strong ,durable, abrasion and moisture resistant, and electrically non- conductive. Vinyl can<br />
87
Appendix – 5A (Contd…)<br />
be produced in almost any colour, with the end products ranging from opaque to crystal clear.<br />
PU (Polyurethane) coating material<br />
4.10 Polyurethane coatings are resistant to ozone, hydrocarbons, moderate chemicals, fats, oils and<br />
greases, possess excellent low-temperature crack resistance, outstanding tensile strength, abrasion<br />
resistance, tear strength and elongation. Urethane materials can be formulated for a number of special<br />
properties including dielectric sealability, high and low coefficients of friction and vibration dampening.<br />
Acrylic coating material<br />
4.11 Acrylics are high-heat and oil resistant specialty materials. The most outstanding feature of acrylic<br />
coatings is the ability to resist the effects of hot oils, including those containing sulphur and its colour<br />
retention ability.<br />
Rubber Coated Fabrics<br />
4.12 Natural rubber coatings are applied to impart outstanding tensile strength, abrasion resistance,<br />
resilience and resistance to flex fatigue and compression set. They are generally resistant to moderate<br />
chemicals, organic acids, alcohols, ketones and aldehydes.<br />
Neoprene coatings<br />
4.13 Neoprene compounds can be formulated for good resistance to ozone, oxygen, heat weathering and<br />
many chemicals. They can provide good resilience, tensile strength and compression set resistance.<br />
Silicone rubber coatings<br />
4.14 Silicone rubber is a specialty elastomer designed to remain serviceable over a extremely wide<br />
range of temperatures ranging from 400 degree F upto 9000 degree F. They are often used in medical<br />
applications because of their high degree of biocompatibility.<br />
Major Applications and End Usages<br />
• Hoardings and Signages,<br />
• Soft Luggage material (Nylon / Polyester),<br />
• Awnings and Canopies,<br />
• Fire Retardant textiles (Coated),<br />
• Scaffolding nets,<br />
• Tarpaulins, Tents ,Umbrella fabrics, Airbags, Parachute fabrics etc.<br />
88
Emerging Market Potential - Global and Indian<br />
Global Market Potential :<br />
Appendix – 5A (Contd…)<br />
4.15 The global market for coated fabrics is around 1.9 billion square yards ( year 2000) valued at $<br />
8.26 billion .<br />
4.16 Projected global demand for coated fabrics by year 2005 projected at $ 9.7 billion growing at a<br />
CAGR of 3.02% .<br />
4.17 US market which accounts for 30% of the total global demand is expected to increase marginally<br />
from 570 million square yards in 2000 to 630 million square yards by 2005. Likewise, the West European<br />
market of around 25 % is also expected to grow at around 2.8% per annum for the corresponding period.<br />
4.18 The demand for coated fabrics in the Asia Pacific region (including Japan ) was estimated to be<br />
425 million square yards ( 22% market share ) in 2000 and is expected to reflect much higher growth<br />
rates with China and India emerging as the target markets.<br />
4.19 Korea has already emerged as a major producer and exporter due to low cost availability of<br />
Polyester yarns and fabrics.<br />
4.20 Non Rubber Coated fabrics ( PVC, PU and Acrylic ) accounted for more than 80% of the<br />
total sales in 2002. PVC ( Vinyl ) will continue to be the dominant coating material since Vinyl coated<br />
fabrics offer good performance at a modest price in variety of applications.<br />
4.21 As an illustration, it may be stated that in the largest US market the composition of substrates<br />
(Base fabric) used are:<br />
Source : Freedonia Report<br />
Indian Market Potential :<br />
Other<br />
Substrates<br />
17%<br />
Cotton<br />
10%<br />
Nylon<br />
20%<br />
Polyester<br />
53%<br />
89
Appendix – 5A (Contd…)<br />
4.22 The Indian technical textile value added coated fabric market segment which is at<br />
a take off stage has the potential for the manufacturing base to meet the growing<br />
domestic market and also emerge as a exporter to developing countries.<br />
4.23 The summary of Indian market potential for coated fabrics for some of the<br />
selected categories is presented below:<br />
Indian Market Potential<br />
Major Products* 2001-2002 2003-2004 (Est.)<br />
Hoardings & Signages<br />
(100% TTC))<br />
Qty<br />
5<br />
mn.mt.<br />
Value<br />
(Rs.<br />
Cr.)<br />
Qty<br />
50.00 8<br />
mn.mt<br />
.<br />
0.10 53000<br />
sq.mt.<br />
1.00 65909<br />
2007-2008<br />
(Proj.) Type of<br />
Value<br />
Value fabric<br />
(Rs. Qty (Rs.<br />
Cr.)<br />
Cr.)<br />
80.00 20 200.00 Knitted /<br />
mn.mt.<br />
Woven<br />
Scaffolding Nets 40000<br />
0.13 90000 0.25 Knitted /<br />
(100% TTC)<br />
sq.mt.<br />
sq.mt.<br />
Woven<br />
Awnings & Canopies 45454<br />
1.45 136363 3.00 Woven /<br />
(100% TTC)<br />
sq.mt.<br />
sq.mt.<br />
sq.mt.<br />
Knitted<br />
Soft Luggage Material 5 60.00 7 84.00 11.50 138.00 Woven /<br />
(100% TTC)<br />
mn.mt.<br />
mn.mt<br />
mn.mt.<br />
Nonwoven<br />
.<br />
/ Knitted<br />
Sub - Total 111.10 165.58 341.25<br />
Source: Market Survey Feedback<br />
90
Indian Market Potential<br />
Appendix – 5A (Contd…)<br />
Major Products* 2001-2002 2003-2004 (Est.)<br />
2007-2008<br />
(Proj.) Type of<br />
Value<br />
Value<br />
Value fabric<br />
Qty (Rs. Qty (Rs. Qty (Rs.<br />
Cr.)<br />
Cr.)<br />
Cr.)<br />
Fire Retardant<br />
Woven /<br />
Textiles<br />
Knitted /<br />
Nonwoven<br />
A. F.R. Apparels 1 Mn. 27.50 1.10 30.25 1.40 38.50 Woven /<br />
(100% TTC)<br />
Mn.<br />
Mn.<br />
Knitted<br />
B. Speciality F.R. 50000 150.00 75000 225.00 175000 525.00 Woven /<br />
Apparel for Defence<br />
(100% TTC)<br />
No.<br />
Nos<br />
Nos.<br />
Knitted<br />
C. F.R. Upholstry/ 0.5 20.00 1.00 40.00 5.00 200.00 Woven /<br />
Furnishing (General Mn.mt<br />
Mn.mt<br />
Mn.mt.<br />
Knitted /<br />
Public (100% TTC) .<br />
.<br />
Non<br />
Woven<br />
Sub Total F.R. --- 197.50 --- 295.25 --- 763.50<br />
Tarpulins for<br />
applications such as<br />
truck covers, food<br />
storage and industrial<br />
machinery covering,<br />
temp. Shelters, etc<br />
1000.00 1100.00 1300.00<br />
Tuffeta (Umbrell, wind 490 9.13 540 10.00 940 17.50<br />
cheater,triangular cut<br />
panels, etc.)<br />
tonnes<br />
tonnes<br />
tonnes<br />
Grand Total - 1317.73 - 1570.83 - 2422.25<br />
Source: Market Survey Feedback<br />
Major Producers<br />
4.24 The major producers of coated fabrics are SRF Limited, Entremonde Polycoaters Limited,<br />
Kusumgar Corporates, Texon Products Limited, Haren Textiles Pvt. Limited, Rajasthan Spinning and<br />
Weaving mills (mainly from fire retardant Virgin PSF fibre), Jayshree Textiles, Digjam Industries, Netlon<br />
India Limited etc.The market coverage by these companies for the above mentioned product categories is<br />
not significant and the country’s dependence on imports continue.<br />
4.25 VISHMAT - Vishnu Fabrics (P) Limited (Chennai) is India’s first and only glass<br />
fibre advanced textiles coating (GEAT) plant (100% EOU). GEAT has special<br />
applications in geotextiles / geogrids, antifire /anti flame for insulation, window screens /<br />
insect screens, wall cladding and plaster reinforcement, scrim fabric, etc.<br />
4.26 Vishmat has developed and patented its own indigenous technology and can be<br />
made available to European / American corporations. This company has annual sales of<br />
Rs 75-100 crores. ASTM/DIN standards are followed and the company has basic testing<br />
facilities.<br />
91
SECTI<strong>ON</strong> II : COATING TECHNOLOGY AND EQUIPMENT<br />
SUPPLIERS<br />
Technology<br />
Appendix – 5A (Contd…)<br />
4.27 Manufacturing of coated fabrics is a technology intensive process with more that 35 different<br />
types of manufacturing ( coating heads ) available for use. The most popular coating methods are Roller<br />
systems, Knife coating, Rotary Screen printing, Dipping coating system etc.<br />
4.28 The state of the art technology and machinery for coating for technical textile<br />
products is not available indigenously. Hence, TECS initiated correspondence with<br />
some of the global suppliers such as :<br />
1. Stork Prints, Netherlands<br />
Local Agency : A T E Marketing Private Limited<br />
A-19 , CTS No 689 , Veera Desai Marg,<br />
Andheri (West), Mumbai - 400053<br />
Phone no : 5676 6100<br />
2. Brueckner Trockentechnik Gmbh & Co. KG , Germany<br />
Local Agency : ICC International Agencies Limited<br />
51, Udyog Bhavan, Sonawala Lane ,<br />
Goregaon (West), Mumbai - 400063<br />
Phone no : 56681173/74<br />
3. Herbert Meyer Machines Gmbh, Germany<br />
Local Agency : R R International<br />
M - 59, South City -1<br />
Gurgaon -122001. Haryana.<br />
Phone no : 124-2380962<br />
4. Coatema Machinery Gmbh , Germany<br />
5. Monti Antonio S p A, Italy<br />
6. Zimmer Maschinenbau Gmbh, Austria.<br />
4.29 TECS has received responses from some of these suppliers and had preliminary<br />
discussions with Stork who is a globally recognised market leader and considered as a<br />
Bench Mark in coating technology.<br />
4.30 Stork has recommended a wider choice of substrates, chemicals and technology<br />
(Rotary Screen and Knife coating) and the budgetary indicative quotation is competitive .<br />
Its modular design makes it easy to adapt for specific applications for future<br />
92
Appendix – 5A (Contd…)<br />
developments and also simplifies integration into many different types of production<br />
lines.<br />
4.31 Stork CFT is a multi-functional coating and finishing machine and offers an<br />
exceptionally wide choice of substrates and techniques ( Rotary Screen and Knife<br />
Technology ). The Stork CFT machine is very easy to adapt for specific applications or<br />
future developments and also simplifies integrating into many different types of<br />
production lines and is therefore considered as a Bench Mark Technology in the coating<br />
machines.<br />
4.32 With a view to incorporating diversified substrata of fabric material and<br />
minimising the investment, it is recommended that the main coating plant may be<br />
imported and the other supporting system sourced indigenously as explained below:<br />
List of Main Process Equipments<br />
Technical Data:<br />
Maximum Web Width : 1850 mm<br />
Standard Repeat Size : 640/914 mm<br />
Mechanical speed : 5-100 m/min (Recommended : 10-20 mt / min)<br />
Main Coating Equipment :<br />
1. One Rotary Screen Coating Unit (Stable foam coating/Paste<br />
coating),<br />
2. Foam impregnating with closed squeeze system,<br />
3. Stable foam coating with screen or knife (Knife coater, mounted onto the CFT’s<br />
rear frame part),<br />
4. Foam Processor FP-3/300,<br />
5. Indigenous equipment based on the drawings given by Stork:<br />
• Infeed Device<br />
• Cooling Cyclinders<br />
• Dryers (5 Chambers)<br />
• Laminating Calender<br />
• Edge Trimming Device<br />
• Rotary Engraving plant<br />
4.33 The diagramatic plant description is as follows:<br />
93
Recommended Economic Size:<br />
Recommended Minimum Economic Size<br />
Appendix – 5A (Contd…)<br />
4.34 It is recommended that the coating plant will have a designed capacity of 900<br />
mtrs per hour (Range varying from 10 - 20 mts per min : 600 - 1200 mtrs per hour<br />
depending upon the coating thickness, substrate used and other production parameters).<br />
4.35 Under Indian operating conditions it is safer to assume machine efficiency factor<br />
of 75%, and therefore the production would be 675 mtrs per hour.<br />
4.36 The plant would operate in three shifts, 24 hours and 330 working days in a year.<br />
Investment in Process Plant and Machinery.<br />
4.37 As per the discussions with the equipment supplier and the indicative budgetary<br />
quotations, the investment in the process plant and machinery will be Rs 2.23 crores,<br />
including discount of 20%. This cost includes imported coating unit and indigenous<br />
sourcing of equipments like infeed device, cooling cylinders, dryers, laminating calender,<br />
edge trimming device and rotary engraving plant. Taking into account the CIF value, the<br />
custom duty (5%), inland transportation and loading/unloading (2%), erection and<br />
commissioning (5%), the installed cost of process equipment would be Rs 2.55 crores.<br />
4.38 The entrepreneur if desired can install a lamination unit of Meyer at a FOB cost of Euro<br />
186,500 (Rs 1.02 crores) over and above the cost of the coating plant.<br />
94
Appendix – 5A (Contd…)<br />
SECTI<strong>ON</strong> III : PROJECT COST & PR<strong>OF</strong>ITABILITY PROJECTI<strong>ON</strong>S<br />
Land<br />
4.39 The total requirement of land for this project keeping in mind the possible future<br />
expansion is around 2000 Sq. Mtrs. ( 0.5 acres ).<br />
4.40 Based on the available information the cost of land is assumed at Rs 1200 per<br />
square meter ( including the developmental cost ).Depending on the exact location of the<br />
project to be determined by the promoter the land cost could be higher or lower. Hence<br />
the total cost of developed land will be Rs 0.24 crores.<br />
Buildings<br />
4.41 The building area comprising of main factory building, godowns, office , R & D<br />
labs / In-house Testing centre etc. would be 1000 Sq. Mtrs. The cost of construction<br />
would again vary depending on the structure and the materials to be used. It has been<br />
assumed that the average cost of construction would be Rs 4500 per sq. mtr. Thus the<br />
total cost of building and other civil works would be around Rs 0.45 crores.<br />
Plant and Machinery<br />
4.42 Details of Plant and machinery as well as technology required for the project have<br />
been presented in earlier Section II. The installed cost of plant and machinery would be<br />
Rs 2.55 crores.<br />
4.43 Apart from the main process equipments the utilities required are<br />
• Electricals,<br />
• Piping Systems,<br />
• Water supply System,<br />
• Compressors,<br />
• Fire Fighting equipments,<br />
• Effluent Treatment Plants,<br />
• Other miscellaneous equipments<br />
4.44 The provision on this count is works out to Rs 0.13 crores.<br />
Testing, Research and Development Facilities<br />
4.45 The Testing and R & D facilities would call for an investment of around Rs 0.27<br />
crores. The various machines required under this head are listed below along with the<br />
indicative prices of the test.<br />
95
1 Vertical Flammability Tester<br />
2 Flex Abrasion Machine<br />
3 Flex Abrasion Tester<br />
4 Crock Meter<br />
5 Cone Measuring Cylinder<br />
Testing Equipment<br />
6 Bundesmann Tester & Spray Tester<br />
7 Other equipments such as Ovens, UTM etc.<br />
TOTAL COST : Rs 26.7 Lakhs<br />
Miscellaneous Fixed Assets<br />
Appendix – 5A (Contd…)<br />
4.46 The items included are Furniture and fixtures, Office equipments, Air<br />
Conditioners etc. and the provision made is around Rs 0.10 crores.<br />
Project Engineering and Consulting<br />
4.47 Under this head the items included are the fees and expenses on account of<br />
Architect fees, project engineering and management (both local and overseas), detailed<br />
project reports etc. .<br />
Preliminary & Preoperative Expenses<br />
4.48 The items included under this head are company formation expenses, public issue<br />
expenses (if any ), interest during construction, pre production expenses during the<br />
implementation phase etc. .<br />
Contingency Expenses<br />
4.49 Depending on the gestation period and further detailing of the project cost by the<br />
promoter, the contingency provision has been made at the rate of 10%.<br />
Margin Money for Working capital<br />
4.50 The margin money for working capital forming part of the total project cost would<br />
be Rs 0.72 crores. [Exhibit 4.3]<br />
Total Project Cost ( Total Investment )<br />
4.51 The total project cost as given in Exhibit 4.1 would be Rs 6.58 crores.<br />
96
Project Funding And Financing Pattern<br />
Appendix – 5A (Contd…)<br />
4.52 It has been assumed that the project would be financed through long term funds and Equity<br />
participation by the Promoter / Public. The technical textile sector being a high priority area , it is assumed<br />
that a Debt- Equity ratio of 1.5 : 1 would be feasible. (However the sensitivity analysis has also been<br />
presented for 1 : 1 and 2 : 1 Debt Equity ratios.).<br />
Sales , Profitability And Sensitivity Analysis<br />
Sales Realisation and Turnover<br />
4.53 As per the details available from the Technology and Equipment suppliers the<br />
economic size of a plant is 900 mtrs/hour.<br />
4.54 Under the Indian conditions, it is assumed that the machine would operate at an<br />
efficiency level of 75%. Hence the production from the plant would be 675 mtrs/hour.<br />
4.55 The plant would operate on Three-shift basis and 330 workings days in a year.<br />
4.56 The capacity utilisation for the 1st year is assumed at 50% and thereafter for the<br />
2nd, 3rd and 4th year onwards 60%, 75% and 90% respectively.<br />
4.57 The coating plant has the flexibility to take up wide variety of substrate material such as Cotton,<br />
Polyester, Nylon etc. in different GSM ranges.<br />
4.58 In terms of end products the machinery can produce the following items:<br />
Products Indicative Price Range (Rs / sq. mt.)<br />
Signage 45 - 70<br />
Soft Luggage Material 30 - 160<br />
Awnings 110 - 180 ( and above )<br />
Fire Retardant Textiles<br />
(Using Virgin Fire Retardant PSF)<br />
200 - 350<br />
Tarpaulins 70 - 230<br />
4.59 The price assumption is for Signage material at Rs 50 per sq. MT (Net<br />
of excise duties and other taxes). The similar exercise can be carried out for other<br />
products as well and there is unlikely to be major difference in the margins for similar<br />
product range.<br />
4.60 The details of sales turnover projected are given in Exhibit 4.2.<br />
97
Cost of Production<br />
Major Raw materials<br />
Appendix – 5A (Contd…)<br />
4.61 The main raw materials used and the corresponding prevailing prices as an indicator are as<br />
follows:<br />
Major Raw<br />
Materials<br />
Polyester Fabric Rs 25 per sq. mt<br />
Prices<br />
( Range of Rs 20-25 per sq. meter or more<br />
depending on the fabric)<br />
PVC Rs 45 per kg ( Range of Rs 40 - 50 per kg )<br />
* Prices are net of Excise duties and other taxes<br />
4.62 The major suppliers of raw materials are :<br />
Polyvinyl Chloride (PVC)<br />
Conversion Cost<br />
(a) Reliance Industries Limited<br />
(b) IPCL<br />
(c) Chemplast Industries Limited<br />
(d) Finolex Industries Limited<br />
Polyester<br />
(a) Reliance Industries Limited.<br />
(b) Indo-Rama Synthetics Limited.<br />
4.63 The conversion cost will include the cost of power, water, other utility items,<br />
chemicals and additives, consumables etc. which is assumed at Rs 10 per sq. mtr.<br />
Manpower, Salaries and Wages<br />
4.64 The manpower requirements and the salary structure is given in Exhibit 4.4.<br />
4.65 The total manpower requirement comprising of supervisors, machine operators, helpers and the<br />
managerial cadre would be 26 nos. And the wage bill would be Rs 34 lakhs.<br />
Factory and Overhead Expenses<br />
4.66 The items covered under this head are repairs and maintenance, Establishment<br />
expenses, stationaries, travel expenses, packaging expenses etc.<br />
98
Marketing and Promotional Expenses<br />
Appendix – 5A (Contd…)<br />
4.67 The promotion of coated fabrics will call for expenditure on this account and a provision of 10 %<br />
of sales has been made uniformly over the years.<br />
Interest and Depreciation<br />
4.68 The prevailing interest rate for long term and short term borrowed funds is<br />
assumed at 5% and 11% per annum (Technology Upgradation Fund).<br />
4.69 The repayment of loans has been assumed for 10 years with two year moratorium<br />
(2+8).<br />
4.70 The depreciation rates as per the Company Law and Income-Tax Ready Reckoner<br />
have been worked out by Straight Line and WDV Method.<br />
4.71 The current corporate tax rate is assumed at 35 % and the surchage is assumed at 2.5% per annum.<br />
Profitability , Break-even , IRR and Payback :<br />
4.72 The Sales turnover increases from Rs 13.10 Cr in the first year to Rs 23.58 Cr.<br />
from the 4 th year onwards.<br />
4.73 The PBT increases from Rs 0.79 Cr. in the first year to Rs. 3.20 Cr. from the 4 th<br />
year onwards. (See Exhibit 4.5)<br />
4.74 The Break Even of the project is at 52.85%.<br />
4.75 The Internal Rate of Return ( IRR ) has been worked out at 27.25%<br />
4.76 The Payback period for the project is 3.90 years .<br />
Sensitivity Analysis<br />
4.77 The sensitivity analysis has been presented in the Exhibit 4.6.<br />
DEVELOPMENTAL AND PROMOTI<strong>ON</strong>AL MEASURES.<br />
4.78 For the future development of Indian Technical Textiles sector, setting up of a<br />
state-of-the-art Coated Fabric projects will be one of the pre requisites.<br />
4.79 India continues to remain dependent on the imported coated fabrics required<br />
for Signage and Hoardings, Soft Luggage material, Awnings and Canopies etc. . Hence<br />
setting up of these coated fabrics projects will not only indigenise the domestic market<br />
but also provide opportunities for exports.<br />
99
Appendix – 5A (Contd…)<br />
4.80 For India to emerge as a globally competitive player , high tenacity polyester (600 - 1800 D) and<br />
nylon filament yarn ( 420 - 168 D) should be made available at international prices and should cover the<br />
coating materials like PVC, PU, Acrylic, Rubber ( Neoprene, Silicone etc.) and other base raw materials<br />
like Caprolactum , Nylon chips , Spin finish oil etc.<br />
4.81 For the protection of domestic technical textiles sector it would be appropriate to<br />
curb the imports of sub standard coated fabrics used for certain applications like<br />
Signage and Hoardings.<br />
4.82 In one of the discussions with the largest producer of Soft Luggage material it was<br />
pointed out that the advantages of global players over Indian manufacturers are :<br />
• Good quality yarn availability,<br />
• Sophisticated machinery,<br />
• Easy availability of raw materials at competitive prices,<br />
• Mass Production reduces overhead costs,<br />
• Better Productivity.<br />
4.83 Normally each coated fabric project has its own R&D and Testing facility for regular usage.<br />
However organisations like SASMIRA, BTRA, Wool Research Association (WRA) should also be<br />
equipped with state of the art common testing facilities to meet the requirements of the industry.<br />
4.84 For the coated fabrics sector there are no set regulatory norms at the International or National<br />
Level and it is for the individual companies to follow the guidelines as per the technology suppliers on the<br />
standards to be followed.<br />
4.85 The technical manpower required for setting up these projects or for the national<br />
level R&D / Testing centres is available locally.<br />
.<br />
100
EXHIBIT 4.1<br />
PROJECT COST<br />
(LAND, BUILDINGS, PROCESS PLANT & MACHINERY, UTILITIES & O<strong>THE</strong>R ASSETS)<br />
Project Cost (Rs. Cr.)<br />
1 Land 0.24<br />
Area: 2000 Sq Mtrs<br />
Rate: (Rs.1200 /Sq. Mtr)<br />
2 Buildings 0.45<br />
Plant Area, Office, Godown, Lab, Service Area etc.)<br />
Built-up Area : 1000 Sq. Mtrs<br />
Avg Rate : Rs. 4500 /Sq. Mtrs<br />
3 Process Plant & Equipment 2.55<br />
4 Utility & Other equipments ( 5%) 0.13<br />
(Power, Water, Compressor, Humidity Control,<br />
Fire Fighting, Material Handling etc.)<br />
5 Testing Facilities (In-house) 0.27<br />
6 Misc. Fixed Assets 0.10<br />
(Furniture & Fixtures, Office Equipment, etc.)<br />
7 Project Engineering & Consultancy charges (2.5%) 0.08<br />
8 Preliminary & Pre-operative Expenses 0.40<br />
(Company Formation, Interest during construction,<br />
pre-production expenses, etc.)<br />
9 Contingency (10 %) 1.64<br />
10 Total 5.86<br />
11 Margin Money for Working Capital 0.72<br />
12 Total Project Cost 6.58<br />
101
EXHIBIT 4.2<br />
ESTIMATI<strong>ON</strong> <strong>OF</strong> SALES REVENUE<br />
ITEM YEAR <strong>OF</strong> OPERATI<strong>ON</strong><br />
I II III IV V VI VII VIII IX X<br />
Average Production per hour (sq mt) 900 900 900 900 900 900 900 900 900 900<br />
75% efficiency 675 675 675 675 675 675 675 675 675 675<br />
Capacity Utilisation 50% 60% 75% 90% 90% 90% 90% 90% 90% 90%<br />
Actual Production per hour 338 405 506 608 608 608 608 608 608 608<br />
Production per day (sq mt) 8100 9720 12150 14580 14580 14580 14580 14580 14580 14580<br />
Production for 330 working days (sq mt) 2673000 3207600 4009500 4811400 4811400 4811400 4811400 4811400 4811400 4811400<br />
Selling Price (Rs/sq mt) 50.00 50.00 50.00 50.00 50.00 50.00 50.00 50.00 50.00 50.00<br />
Sales Revenue (Rs. Cr) 13.37 16.04 20.05 24.06 24.06 24.06 24.06 24.06 24.06 24.06<br />
Value Loss ( 2% ) 0.27 0.32 0.40 0.48 0.48 0.48 0.48 0.48 0.48 0.48<br />
Net Sales Revenue (Rs. Cr) 13.10 15.72 19.65 23.58 23.58 23.58 23.58 23.58 23.58 23.58<br />
102<br />
(Rs. Cr.)
Factory Related<br />
EXHIBIT 4.3<br />
REQUIREMENT <strong>OF</strong> WORKING CAPITAL<br />
ITEM NO. <strong>OF</strong> MARGIN YEAR I YEAR II YEAR III YEAR IV<br />
(Rs.Cr)<br />
YEAR V<br />
M<strong>ON</strong>THS (%) W.CAP MARGIN BANK W.CAP MARGIN BANK W.CAP MARGIN BANK W.CAP MARGIN BANK W.CAP MARGIN BANK<br />
REQMT M<strong>ON</strong>EY FINANCE REQMT M<strong>ON</strong>EY FINANCE REQMT M<strong>ON</strong>EY FINANCE REQMT M<strong>ON</strong>EY FINANCE REQMT M<strong>ON</strong>EY FINANCE<br />
Raw materials & other com. 1.00 25.00 0.61 0.15 0.45 0.73 0.18 0.55 0.91 0.23 0.68 1.09 0.27 0.82 1.09 0.27 0.82<br />
Goods in process 0.25 25.00 0.21 0.05 0.16 0.25 0.06 0.19 0.31 0.08 0.23 0.37 0.09 0.27 0.37 0.09 0.27<br />
Finished Goods 1.00 25.00 0.96 0.24 0.72 1.14 0.28 0.85 1.40 0.35 1.05 1.62 0.41 1.22 1.62 0.41 1.22<br />
A/c Receivable 1.00 25.00 1.09 0.27 0.82 1.31 0.33 0.98 1.64 0.41 1.23 1.96 0.49 1.47 1.96 0.49 1.47<br />
Cash in hand<br />
Salaries & wages 1.00 0.00 0.03 0.00 0.03 0.03 0.00 0.03 0.03 0.00 0.03 0.03 0.00 0.03 0.03 0.00 0.03<br />
Utilities 1.00 0.00 0.15 0.00 0.15 0.18 0.00 0.18 0.23 0.00 0.23 0.27 0.00 0.27 0.27 0.00 0.27<br />
Advertising & Promotional Expenses 1.00 0.00 0.11 0.00 0.11 0.13 0.00 0.13 0.16 0.00 0.16 0.16 0.00 0.16 0.16 0.00 0.16<br />
Admin. Overheads 1.00 0.00 0.07 0.00 0.07 0.07 0.00 0.07 0.07 0.00 0.07 0.07 0.00 0.07 0.07 0.00 0.07<br />
Total Requirement 3.16 0.72 2.44 3.77 0.86 2.91 4.68 1.06 3.61 5.50 1.26 4.24 5.51 1.26 4.25<br />
103
EXHIBIT 4.3 (C<strong>ON</strong>TD...)<br />
REQUIREMENT <strong>OF</strong> WORKING CAPITAL<br />
ITEM NO. <strong>OF</strong> MARGIN YEAR VI YEAR VII YEAR VIII YEAR IX<br />
(Rs.Lakhs)<br />
YEAR X<br />
Factory Related<br />
M<strong>ON</strong>THS (%) W.CAP MARGIN BANK W.CAP MARGIN BANK W.CAP MARGIN BANK W.CAP MARGIN BANK W.CAP MARGIN BANK<br />
REQMT M<strong>ON</strong>EY FINANCE REQMT M<strong>ON</strong>EY FINANCE REQMT M<strong>ON</strong>EY FINANCE REQMT M<strong>ON</strong>EY FINANCE REQMT M<strong>ON</strong>EY FINANCE<br />
Raw materials & other 2.00 25.00 2.18 0.55 1.64 2.18 0.55 1.64 2.18 0.55 1.64 2.18 0.55 1.64 2.18 0.55 1.64<br />
Goods in Process 0.50 25.00 0.73 0.18 0.55 0.74 0.18 0.55 0.74 0.18 0.55 0.74 0.18 0.55 0.74 0.19 0.56<br />
Finished Goods Stock 1.00 25.00 1.62 0.41 1.22 1.63 0.41 1.22 1.57 0.39 1.18 1.58 0.39 1.18 1.58 0.39 1.18<br />
A/c Receivable 1.00 25.00 1.96 0.49 1.47 1.96 0.49 1.47 1.96 0.49 1.47 1.96 0.49 1.47 1.96 0.49 1.47<br />
Cash in hand<br />
Salaries & wages 1.00 0.00 0.04 0.00 0.04 0.04 0.00 0.04 0.04 0.00 0.04 0.05 0.00 0.05 0.05 0.00 0.05<br />
Utilities 1.00 0.00 0.00 0.00 0.00 0.00 0.00 0.00 0.00 0.00 0.00 0.00 0.00 0.00 0.00 0.00 0.00<br />
Advertising & Promotional Expenses 1.00 0.00 0.00 0.00 0.00 0.00 0.00 0.00 0.00 0.00 0.00 0.00 0.00 0.00 0.00 0.00 0.00<br />
Admin. Overheads 1.00 0.00 0.16 0.00 0.16 0.16 0.00 0.16 0.10 0.00 0.10 0.10 0.00 0.10 0.10 0.00 0.10<br />
Total Requirement 6.97 1.63 5.35 6.98 1.63 5.35 6.87 1.61 5.26 6.88 1.61 5.26 6.89 1.62 5.27<br />
104
EXHIBIT 4.4<br />
MANPOWER REQUIREMENTS<br />
Nos Monthly Total Mon. Annual<br />
General Manager 1 30000 30000 360000<br />
Production Manager 1 20000 20000 240000<br />
Machine Operator 3 6000 18000 216000<br />
Machine Helper (Semi Skilled) 9 3000 27000 324000<br />
R&D, Testing 1 8000 8000 96000<br />
Marketing & Sales<br />
Marketing Head 1 25000 25000 300000<br />
Sales Team 3 12000 36000 432000<br />
Clerical Staff 4 6000 24000 288000<br />
Other Staff 2 3000 6000 72000<br />
Maintenance (Tech. & Non-Tech.) 1 10000 10000 120000<br />
TOTAL 26 204000 2448000<br />
Fringe Benefits (40 % of the above) 979200<br />
Total Wage Bill (Annual) Rs.: Salary + Other Benefits = 3427200.00<br />
Total Wage Bill (Annual) Rs. Cr.: 0.34272<br />
105
EXHIBIT 4.5<br />
PR<strong>OF</strong>ITABILITY STATEMENT AND COMPUTATI<strong>ON</strong> <strong>OF</strong> TAX<br />
(Rs.Cr)<br />
ACCOUNT HEAD FINANCIAL YEAR <strong>OF</strong> OPERATI<strong>ON</strong><br />
I II III IV V VI VII VIII IX X<br />
Revenue<br />
Net Sales Turnover 13.10 15.72 19.65 23.58 23.58 23.58 23.58 23.58 23.58 23.58<br />
Total Revenue 13.10 15.72 19.65 23.58 23.58 23.58 23.58 23.58 23.58 23.58<br />
Expenses<br />
Raw Materials 7.27 8.72 10.91 13.09 13.09 13.09 13.09 13.09 13.09 13.09<br />
Salaries & wages 0.34 0.36 0.38 0.40 0.42 0.45 0.49 0.52 0.57 0.61<br />
Power, Fuel, Stores & Other Expenses (including packing materials) 1.82 2.18 2.73 3.27 3.27 3.27 3.27 3.27 3.27 3.27<br />
Marketing & Promotional Expenses 1.31 1.57 1.96 1.89 1.89 1.89 1.89 1.18 1.18 1.18<br />
Factory & Office Overheads 0.80 0.80 0.80 0.80 0.80 0.80 0.80 0.80 0.80 0.80<br />
Interest on S.T. Loans 0.27 0.32 0.40 0.47 0.47 0.59 0.59 0.58 0.58 0.58<br />
Cost of Sales 11.81 13.96 17.17 19.91 19.93 20.08 20.12 19.44 19.49 19.53<br />
Depreciation (St.Line) 0.29 0.29 0.29 0.29 0.29 0.29 0.29 0.29 0.29 0.29<br />
Amort. of Expenses 0.01 0.01 0.01 0.01 0.01 0.01 0.00 0.00 0.00 0.00<br />
Interest on L.T Loan 0.20 0.20 0.19 0.16 0.14 0.11 0.09 0.06 0.04 0.01<br />
Profit Before Tax 0.79 1.26 1.99 3.20 3.21 3.08 3.08 3.78 3.76 3.74<br />
Tax 0.08 0.15 0.54 1.03 1.07 1.06 1.09 1.35 1.36 1.37<br />
Profit After Tax 0.70 1.11 1.44 2.18 2.13 2.02 1.99 2.43 2.40 2.38<br />
Dividend 0.00 0.00 0.13 0.13 0.13 0.26 0.26 0.26 0.26 0.26<br />
Profits For Appropriation 0.70 1.11 1.31 2.04 2.00 1.75 1.73 2.16 2.14 2.11<br />
COMPUTATI<strong>ON</strong> <strong>OF</strong> TAX<br />
Profit after interest before depreciation 1.08 1.55 2.27 3.49 3.50 3.37 3.37 4.07 4.05 4.03<br />
Depr.(WDV) to be claimed 1.24 1.12 0.73 0.56 0.43 0.33 0.26 0.20 0.16 0.12<br />
Depreciation claimed 1.08 1.12 0.73 0.56 0.43 0.33 0.26 0.20 0.16 0.12<br />
Depr. carried forward 0.17 0.00 0.00 0.00 0.00 0.00 0.00 0.00 0.00 0.00<br />
Taxable Profit 0.00 0.43 1.55 2.94 3.07 3.04 3.11 3.87 3.90 3.91<br />
Profit Before Tax (Book) 0.79 1.26 1.99 3.20 3.21 3.08 3.08 3.78 3.76 3.74<br />
Minimum Alternate Tax 0.08 0.00 0.00 0.00 0.00 0.00 0.00 0.00 0.00 0.00<br />
Tax (Actual) 0.00 0.15 0.54 1.03 1.07 1.06 1.09 1.35 1.36 1.37<br />
Tax Provision 0.08 0.15 0.54 1.03 1.07 1.06 1.09 1.35 1.36 1.37<br />
106
EXHIBIT 4.6<br />
SENSITIVITY ANALYSIS<br />
Items Profit after Tax<br />
(PAT)<br />
( assumed at 90 %<br />
capacity )<br />
Break<br />
Even<br />
(%)<br />
Appendix – 5A (Contd…)<br />
Internal<br />
Rate of<br />
Return<br />
(IRR)<br />
(%)<br />
Payback<br />
Period<br />
(Years)<br />
NORMAL VALUES 2.18 52.85 27.25 3.90<br />
Debt Equity Ratios<br />
(a) 2:1<br />
(b) 1:1<br />
Increase in Project<br />
Cost by 10 %<br />
2.16<br />
2.19<br />
2.16<br />
53.11<br />
52.45<br />
53.34<br />
27.33<br />
27.12<br />
25.93<br />
3.89<br />
3.92<br />
4.03<br />
Decrease in Selling Price<br />
to Rs 45 per sq. mtr. 1.05 76.56 10.24 7.94<br />
Increase in Selling<br />
Price to Rs 55 per sq. mtr 3.57 41.33 41.90 2.84<br />
107
CIRCULAR WARP KNITTING PROJECT<br />
Appendix – 5A (Contd…)<br />
SECTI<strong>ON</strong> I : PRODUCT BRIEF, APPLICATI<strong>ON</strong> AREAS AND<br />
MARKET POTENTIAL<br />
5.1 The broad product categorization could be termed as Healthcare Enhancing and<br />
Rehabilitation Aid Products.<br />
Product Range and Application Areas:<br />
5.2 The product range could be grouped as follows:<br />
• Knee Calf and Ankle Support: Knee Brace, Calf Support, Hinged Knee Caps,<br />
Elastic Knee Support, Elastic Tubular Knee Caps, Elastic Tubular Anklet,<br />
Vericose Veins Stockings, Heal Cushion, etc.<br />
• Neoprene Supports: Ankle Wrap, Wrist Brace, Lumbar Belt, Knee Bracing<br />
• Back Support: Lumbar Belt, Frame Back Support, Magnetic Body Belt,<br />
Orthopaedic Back Rest, Buttock Rest, Back Support and Shoulder Harness<br />
• Cervical Aids: Collar with support with or without soft turkish fabric, Collar<br />
with adjustable chin support, cervical pillow,<br />
• Traction Kit and spares: Pelvic Traction Belt, Water and Sand Weight Bags,<br />
Ankle Traction Belt, Foot / Skin Traction Kit, etc.<br />
• Wrist and Elbow Support: Elastic Wrist Splint, Wrist Brace, Tennis Elbow<br />
Support, Wrist Binder with double lock, etc.<br />
• Fracture Aids: Rib Belt, Adjustable Pouch Arm Sling, Shoulder Immobiliser,<br />
etc.<br />
• Sports Goods for Rehabilitation: Weight Cuff, Stockings, Stockinet, etc.<br />
• General Aid: Headache Band, Blood Pressure Cuff, Arm Board, Multipurpose<br />
Restraint Strap, etc.<br />
5.3 Amongst the various Indian players engaged in the production of these products,<br />
Vissco Rehabilitation Aids Pvt. Ltd. is the market leader with a share of around 30-<br />
40%. Established around 25 years ago, Vissco is involved in the designing,<br />
manufacturing and marketing of Rehabilitation Aids and Hospital Furniture Items. The<br />
product range includes Back Supports, Cervical and Walking Aids, Neoprene Body<br />
Supports, Traction Kits and Exercisers to Hospital Beds, Gynaec Tables, Examination<br />
109
Appendix – 5A (Contd…)<br />
Tables, Foldable Wheelchairs, Stretchers, etc. The company has an all India distribution<br />
network with the products available at all the leading chemists and hospitals.<br />
5.4 Omtex Healthwear Pvt. Ltd. is also a leading manufacturer of Healthwear,<br />
Sportswear and Swimwear. They have an All India network of distributors, retailers and<br />
agents. Their products are exported to UK and other European countries.<br />
5.5 Norma D.N.D. Products is involved in the manufacturing and marketing of soft<br />
orthotics products for different medical specialities like Compression Stockings,<br />
Compression Garments, Abdominal Binders, Braces, Knee Supports, Post Lipo-Suction<br />
Garments, Arm Sleeves, Lumbo-Sacral Belt, etc.<br />
5.6 Leela and Co. (Surat) was established in 1960 and was the first company to<br />
manufacture elastic knee cap, anklet, elastic jacquard stockings. The company<br />
manufactures and exports Stocking, Knee Caps, Wrist Band, Ankle Supporters, Corset,<br />
Abdominal Belt, Thumb Supporters, Belt-B-Velcro.<br />
5.7 Sabar Healthcare and Rehabilitation Aid Products, part of Sabar Group was<br />
established in 1990 with an in-house production unit manufacturing Abdominal Surgical<br />
Belt, Lumbar Sacro Belt, Frame Back Support, Shoulder/Ankle Support, Back Guard,<br />
Tennis Elbow Support, Vericose Vein Stocking, etc.<br />
5.8 Other players like Tyar Orthopaedic Ltd. (Punjab), Ronak Surgicals Ltd.<br />
(Mumbai), Mukta Rehabilitation Aids (Mumbai), Dynamic Orthopaedic Pvt. Ltd.<br />
(Kerala), also have a presence in this market.<br />
Market Size and Potential:<br />
5.9 As per the TECS field survey and discussions with the knowledgeable persons<br />
from the industry, the all India market for these compression garments used for variety of<br />
applications was reported to be around Rs. 40-50 crores (Average Rs 45 Cr.) in 2002 - 03<br />
(2001-02 : Rs. 40 crores).<br />
5.10 The industry market leaders anticipate a growth rate of 10-15% per annum<br />
(Average: 12%) and accordingly the market potential is expected to be Rs 50.40 crores in<br />
2003-04 (Est.) and Rs 70.80 crores by 2007-08 (Proj.)<br />
5.11 The market share of knee caps, vericose veins stockings, ankle and elbow<br />
support and stockings for medical and fashion purposes is reported to be 40-45%.<br />
Hence the market for these products is forecasted to increase from the current Rs 18.00<br />
crores (2001 - 02) to Rs 22.68 crores (2003-04) and Rs 31.86 crores (2007-08)<br />
110
Appendix – 5A (Contd…)<br />
5.12 With the increasing awareness about the products and its applications in various<br />
fields like fashion, medical and sports, the industry expects a healthy growth in the<br />
coming years.<br />
5.13 The concept of seamless knee caps and stockings as well as usage of better quality<br />
raw materials manufactured on state-of-the-art warp knitting machines would change the<br />
profile of this industry. Our survey has revealed that there is total lack of awareness about<br />
the seamless products popularly used abroad.<br />
5.14 The hospitals, nursing homes and the retailers would welcome the new product<br />
range provided price-wise they are competitive with the products currently available in<br />
the market.<br />
5.15 The indicative price range of the products available in the Indian market is as<br />
given below:<br />
Sr. No. Item Indian Market Price (Rs.)<br />
1. Back Support 400.00 - 600.00<br />
2. Pelvic Traction Kit and Spares<br />
A. Pelvic Traction Belt 280.00<br />
B. Ankle Traction Holder 140.00<br />
C. Foot Traction Strip 70.00<br />
3. Cervical Aids 120.00 - 250.00<br />
4. Abdominal Support<br />
A. Belts (5” / 6” / 8”) 300.00 - 400.00<br />
B. Hernia Belt with Double Pad 360 .00<br />
5. Knee Caps and Ankle Supports<br />
A. Knee Brace Small/Long(L/M/S) 330.00 - 410.00<br />
B. Elastic Knee Support 180.00<br />
C. Elastic Knee Cap (Tubular) 160.00<br />
D. Elastic Vericose Veins Stocking (Per Pair) 500.00<br />
5.16 The international price of these products as marketed by Lucas are: Euro $ 40-50,<br />
which is Rs. 2750 per knee cap.<br />
5.17 There is a need to promote these products by canvassing through the<br />
hospitals/nursing homes and the retail outlets focussing the campaigns on their benefits<br />
and the advantages offered.<br />
5.18 The existing players would be keen to modernise their machinery by replacing<br />
with the state-of-the-art warp knitting machines subject to the viability of the project.<br />
111
Appendix – 5A (Contd…)<br />
SECTI<strong>ON</strong> II : CIRCULAR WARP KNITTING TECHNOLOGY<br />
AND EQUIPMENT SUPPLIERS<br />
Machinery Suppliers and Specifications:<br />
5.19 The major global suppliers for Circular Warp Knitting Machinery are:<br />
1. M/s Harry Lucas (Germany),<br />
2. M/s Rius (Spain).<br />
5.20 TECS has received response form the local representative of Harry Lucas; Voltas<br />
Ltd. whose technology has been used as a Benchmark Technology. These are the<br />
leading global players engaged in the manufacturing of circular warp knitted products and<br />
based on the industry feedback the above list is exhaustive.<br />
5.21 The machines recommended by the local representative of Harry Lucas (Voltas)<br />
are:<br />
• RR2-FB-106+Jacquard for manufacturing of cylindrical, conical and curved<br />
tubular fabric for knee cap, elbow cap and ankle protectors. This machine is<br />
equipped with two knitting systems and one rubber inlay.<br />
Machine Specification:<br />
• Programmed electronic control unit,<br />
• Programming of the fabric width by varying elastic tensions,<br />
• Programmable tuck control,<br />
• Fabric takedown unit,<br />
• Step-free drive with electromagnetic brake,<br />
• Revolving bobbin stand,<br />
• Two or three colour jacquard patterns with individual needle selection,<br />
• Electronically-controlled pre-feed device,<br />
• Knitting pockets<br />
• RME for production of orthopaedic elastic stockings for medical and sports<br />
applications.<br />
Machine Specifications:<br />
• Programmed electronic control unit,<br />
• Elastic yarn feed,<br />
112
• One programmable selection bloc per inlay system,<br />
• Vacuum pump (reinforced design),<br />
• Stitch-adjustment per system,<br />
• Individual needle selection,<br />
• Bobbin stand, not fitted onto the machine<br />
Recommended Minimum Economic Size:<br />
Appendix – 5A (Contd…)<br />
5.22 The recommended minimum economic size for the circular warp knitting machines<br />
would be to manufacture 20 knee caps per hour and 7.5 stockings per hour.<br />
5.23 The detailed cost structure of the two machines along with their outputs is given<br />
below:<br />
Model RR2-FB-106+Jacquard to cover different sizes of knee caps<br />
Sizes No. of Machine CIF Value -Euro CIF Value<br />
Machines Capacity/hr. $ (Machinery) (Rs. Cr.)<br />
Knee Cap of 4” 1 20 knee caps 35000 0.1925<br />
Knee Cap of 5”-6” 1 20 knee caps 37000 0.2035<br />
Knee Cap of 9” 1 20 knee caps 41000 0.2255<br />
Total 11300 0.6215<br />
Model RME: Stockings for medical and sports applications<br />
Sizes No. of Machine CIF Value -Euro $ CIF Value -<br />
Machines capacity / hr. (Machinery) Rs. Cr.<br />
Stockings of 41/2" 1 7.5 stockings 57000 0.3135<br />
Stockings of 5" 1 7.5 stockings 57600 0.3168<br />
Stockings of 51/2" 1 7.5 stockings 59000 0.3245<br />
Total 173600 0.9548<br />
5.24 Thus the total cost of the machinery is seen to be Rs. 1.42 crores (CIF), inclusive<br />
of 10% discount offered by the machinery manufacturers. Taking into account the CIF<br />
value, the custom duty (5%), inland transportation and loading, unloading (2%), erection<br />
and commissioning (5%), the installed cost of process equipment would be Rs. 1.60<br />
crores.<br />
5.25 The seamless stockings are manufactured by circular warp knitting technology<br />
only. However in the Indian market currently, they are being made on woven machines<br />
113
Appendix – 5A (Contd…)<br />
and the ends are stitched. Circular Knitting machines are also being used to manufacture<br />
seamless bandages, but they are reportedly of inferior quality.<br />
5.26 The circular warp knitting machines are product specific and can be used for the<br />
above products only.<br />
SECTI<strong>ON</strong> III : PROJECT COST AND PR<strong>OF</strong>ITABILITY<br />
PROJECTI<strong>ON</strong>S<br />
Land<br />
5.27 The total requirement of land for this project keeping in mind the possible future<br />
expansion is around 750 Sq. Mtrs. ( 0.19 acres ).<br />
5.28 Based on the available information, the cost of land is assumed at Rs<br />
1200 per square meter (including the developmental cost). Depending on the exact<br />
location of the project to be determined by the promoter, the land cost could be higher or<br />
lower. Hence the total cost of developed land will be Rs 0.09 crore (Rs 9 lakhs).<br />
Buildings<br />
5.29 The building area comprising of main factory building, godowns, office, R & D<br />
labs/In-house Testing centre etc. would be 350 sq. mtrs. The cost of construction would<br />
again vary depending on the structure and the materials to be used. It has been assumed<br />
that the average cost of construction would be Rs 4500 per sq. mt. Thus the total cost of<br />
building and other civil works would be around Rs 0.16 crore (Rs 16 lakhs).<br />
Plant and Machinery<br />
5.30 Details of Plant and machinery as well as technology required for the project have<br />
been presented in earlier Section II . The installed cost of plant and machinery would be<br />
Rs 1.60 crores.<br />
5.31 Apart from the main process equipment, the other utilities and equipment required<br />
are:<br />
• Hamming Machine (for smooth finish),<br />
• Compressors,<br />
• Dryer,<br />
• Stabilizer,<br />
• Electricals,<br />
114
• Piping System,<br />
• Water supply System,<br />
• Fire Fighting Equipment etc.<br />
Appendix – 5A (Contd…)<br />
5.32 The provision on this count works out to be Rs 0.10 crore (Rs 10 lakhs).<br />
Miscellaneous Fixed Assets<br />
5.33 Under this head the items included are furniture and fixtures, Office equipment,<br />
Air Conditioners etc. and the provision made is around Rs 0.08 crore (Rs 8 lakhs).<br />
Testing Facilities<br />
5.34 These products would require Yarn and Fabric Testing Facilities, the cost of<br />
which is around Rs 0.02 crore (Rs 2 lakhs) and can be sourced locally.<br />
Project Engineering and Consulting<br />
5.35 Under this head the items included are the fees and expenses on account of<br />
Architect fees, project engineering and management (both local and overseas), detailed<br />
project reports etc.<br />
Preliminary & Preoperative Expenses<br />
5.36 The items included under this head are company formation expenses, public issue<br />
expenses (if any), interest during construction, pre production expenses during the<br />
implementation phase etc.<br />
Contingency Expenses<br />
5.37 Depending on the gestation period and further detailing of the project cost by the<br />
promoter, the contingency provision has been made at the rate of 10%.<br />
Margin Money for Working capital<br />
5.38 The margin money for working capital forming part of the total project cost would<br />
be Rs 0.17 crores (Rs 17 lakhs). [Exhibit 5.3]<br />
Total Project Cost (Total Investment)<br />
5.39 The total project cost as given in Exhibit 5.1 would be Rs 2.73 crores.<br />
115
Project Funding and Financing Pattern :<br />
Appendix – 5A (Contd…)<br />
5.40 It has been assumed that the project would be financed through long term funds<br />
and Equity participation by the Promoter / Public. The technical textile sector being a high<br />
priority area , it is assumed that a Debt- Equity ratio of 1.5:1 would be feasible. (However<br />
the sensitivity analysis has also been presented for 1:1 and 2:1 Debt Equity ratios.)<br />
Sales, Profitability and Sensitivity Analysis :<br />
Sales Realisation and Turnover<br />
5.41 As per the details available from the Technology and Equipment suppliers the<br />
economic size of the plant for:<br />
• Stockings manufactured on three RME machines : 23 stockings<br />
• Knee Caps manufactured on the three RR2-FB-106+J machines: 60 Knee<br />
Caps<br />
5.42 Thus the plant has a designed capacity to produce 83 pieces per hour. (For details<br />
on product and machine configuration, please refer Section II).<br />
5.43 Under the Indian conditions, it is assumed that the machine would operate at an<br />
efficiency level of 85%. Hence the production from the plant would be 70 pieces per<br />
hour.<br />
5.44 The plant would operate on Three-shift basis and 300 workings days in a year.<br />
5.45 The capacity utilisation for the 1st year is assumed at 50% and thereafter for 2nd,<br />
3rd and 4th year onwards 60%, 75% and 90% respectively.<br />
5.46 As per the market information, the assumptions with regard to the prices of<br />
stockings and knee caps is Rs. 200 and Rs. 150 respectively. Thus the weighted average<br />
selling price assumed for sales projections works out to Rs 164 per piece. (net of excise<br />
duties, sales tax and other incidental expenses).<br />
5.47 It may be noted that these products are available in different sizes, hence there<br />
could be price variation from product to product. The indicative International prices as<br />
given by the technology supplier at Euro$40-50 per knee cap (Rs 2750) appear unrealistic<br />
for the Indian market.<br />
5.48 The details of projected sales turnover as projected are given in Exhibit 5.2<br />
116
Cost of Production:<br />
Major Raw materials and their specifications:<br />
Appendix – 5A (Contd…)<br />
5.49 Polyester and cotton core yarn are the main raw materials used in these products.<br />
The core rubber yarn is covered with either Polyester or Cotton depending on the<br />
application and the final product. The raw material mix and the specifications thereof are<br />
not readily available with the technology supplier.<br />
5.50 The yarn thickness for feeder 1 is 3X90/f 48: 3-ply yarn with 90 dtx and having 48<br />
filaments. While the yarn thickness for feeder 2 (lycra) is 2X90/f 48+; 2-ply yarn with 90<br />
dtx and having 48 filaments.<br />
5.51 These raw materials are used in different proportions depending on the final end<br />
product and as indicated by the technology supplier, the raw material cost is around 40%<br />
of the selling price. Accordingly the value of raw materials is around Rs 3.47 crores after<br />
accounting for a process waste of 5% (at full capacity).<br />
5.52 Reliance Industries Ltd. is the major supplier of Polyester Filament Yarn, while<br />
the cotton yarn could be sourced from the local spinning mills. The neoprene rubber<br />
required is also locally available.<br />
Conversion Cost<br />
5.53 The conversion cost will include the cost of power, water, chemicals and<br />
additives, consumables, repairs and maintenance and other expenses etc. taken at 7.5% of<br />
the raw material cost.<br />
Manpower, Salaries and Wages<br />
5.54 The manpower requirements and the salary structure is given in Exhibit 5.4.<br />
5.55 The total manpower requirement comprising the managerial cadre of supervisors,<br />
machine operators and helpers would be 29 persons. All the technical manpower is locally<br />
available and the wage bill would be Rs 0.41 lakhs.<br />
Factory and Overhead Expenses<br />
5.56 The items covered under this head are establishment expenses, repairs and<br />
maintenance, stationery, travel expenses, packaging expenses etc.<br />
117
Marketing and Promotional Expenses<br />
Appendix – 5A (Contd…)<br />
5.57 The promotion of technical textiles will call for expenditure on this count and a<br />
provision of 20% of the annual sales has been made uniformly over the years.<br />
5.58 This would include the margins to distributors and retailers and promotion<br />
required at the hospitals, nursing homes and also for the customers directly.<br />
Interest and Depreciation<br />
5.59 The prevailing interest rate for long term and short term borrowed funds is<br />
assumed at 5% and 11% per annum [Project is included in the Technology Upgradation<br />
Fund (TUF)].<br />
5.60 The repayment of loans has been assumed for 10 years with a moratorium period<br />
of two years (2+8).<br />
5.61 The depreciation rates have been worked out as per Company’s act (SLM) and<br />
Income-Tax Ready Reckoner (WDV).<br />
5.62 The current corporate tax rate is assumed at 35% and the surcharge is assumed at<br />
2.5% per annum.<br />
Profitability, Break-even, IRR, DSCR and Payback<br />
5.63 As presented in Exhibit 5.5, the sales turnover increases from Rs 4.06 crore in the<br />
first year to Rs 7.30 in the fourth year.<br />
5.64 The PBT increases from Rs 0.89 crore in the first year to Rs 1.51 crore in the<br />
fourth year.<br />
5.65 The Break Even of the project is at 60.33%.<br />
5.66 The Internal Rate of Return ( IRR ) has been worked out at 34.84%.<br />
5.67 The Payback period for the project is 3.09 years.<br />
Sensitivity Analysis<br />
5.68 The sensitivity analysis has been presented in the Exhibit 5.6.<br />
118
DEVELOPMENTAL AND PROMOTI<strong>ON</strong>AL MEASURES.<br />
Appendix – 5A (Contd…)<br />
5.69 There is a need to create awareness about the state-of-the-art warp knitting<br />
machinery available for producing medical, sports and fashion compression garments of<br />
international quality.<br />
5.70 The technology supplier needs to interact with the existing players for briefing on<br />
the techno-commercial advantages of these machines vis-à-vis conventional knitting<br />
machines presently used.<br />
5.71 The Health Ministry and other concerned authorities should encourage the<br />
inclusion of these rehabilitation aids in the Medical Insurance which will encourage the<br />
patients to use these good quality products.<br />
5.72 These seamless stockings and knee caps having better elasticity and advantages<br />
should be promoted by the Indian manufacturers, concerned authorities, medical<br />
community etc.<br />
5.73 The hospitals, nursing homes and the orthopaedic doctors can play an important<br />
role in informing the patients at large about the merits of these products vis-à-vis the<br />
conventional items presently in use.<br />
5.74 All the existing producers have their own in-house testing facilities.<br />
5.75 Organisations like SASMIRA, BTRA, International Wool Research Association<br />
can take a lead for testing the products manufactured by international players and passing<br />
on the key inputs of the research to the local small players to enable them to manufacture<br />
these quality products in India.<br />
5.76 Our study has revealed that there are no regulatory aspects or policy issues<br />
governing these products in India and abroad.<br />
119
EXHIBIT 5.1<br />
(LAND, BUILDINGS, PROCESS PLANT & MACHINERY, UTILITIES & O<strong>THE</strong>R ASSETS)<br />
Project Cost (Rs. Cr.)<br />
1 Land 0.09<br />
(Area: 750 Sq. Mtrs.)<br />
Rate: (Rs.1200 /Sq. Mtr)<br />
2 Buildings 0.16<br />
(Plant Area, Office, Godown, Lab, Service Area etc.)<br />
Built-up Area : 350 Sq. Mtrs<br />
Rate: (Rs.4500 /Sq. Mtr)<br />
3 Process Plant & Equipment 1.60<br />
4 Utility & Other equipments 0.10<br />
(Compressor, Dryer, Stabilizer, Hamming Machine, etc.)<br />
5 Misc. Fixed Assets 0.08<br />
(Furniture & Fixtures, Office Equipment, etc.)<br />
6 Testing Equipments 0.02<br />
7 Project Engineering & Consultancy charges (2.5%) 0.05<br />
8 Preliminary & Pre-operative Expenses (12%) 0.23<br />
(Company formation, Interest during construction period,<br />
9 pre-production expenses, etc.)<br />
10 Contingency (10 %) 0.23<br />
11 Total 2.56<br />
12 Margin Money for Working Capital 0.17<br />
13 Total Project Cost 2.73<br />
121
EXHIBIT 5.2<br />
ESTIMATI<strong>ON</strong> <strong>OF</strong> SALES REVENUE<br />
ITEM YEAR <strong>OF</strong> OPERATI<strong>ON</strong><br />
I II III IV V VI VII VIII IX X<br />
Average Production per hr (pcs.) 83 83 83 83 83 83 83 83 83 83<br />
85% efficiency 70 70 70 70 70 70 70 70 70 70<br />
Capacity Utilisation 50% 60% 75% 90% 90% 90% 90% 90% 90% 90%<br />
Actual Production per hr (pcs.) 35 42 53 63 63 63 63 63 63 63<br />
Production per day (pcs.) 842 1010 1262 1515 1515 1515 1515 1515 1515 1515<br />
Production for 300 working days (pcs.) 252450 302940 378675 454410 454410 454410 454410 454410 454410 454410<br />
Selling Price (Rs/pc.) 164.00 164.00 164.00 164.00 164.00 164.00 164.00 164.00 164.00 164.00<br />
Sales Revenue (Rs. Cr) 4.14 4.97 6.21 7.45 7.45 7.45 7.45 7.45 7.45 7.45<br />
Value Loss ( 2% ) 0.08 0.10 0.12 0.15 0.15 0.15 0.15 0.15 0.15 0.15<br />
Net Sales Revenue (Rs. Cr) 4.06 4.87 6.09 7.30 7.30 7.30 7.30 7.30 7.30 7.30<br />
122<br />
(Rs. Cr.)
Factory Related<br />
EXHIBIT 5.3<br />
REQUIREMENT <strong>OF</strong> WORKING CAPITAL<br />
ITEM NO. <strong>OF</strong> MARGIN YEAR I YEAR II YEAR III YEAR IV<br />
(Rs.Lakhs)<br />
YEAR V<br />
M<strong>ON</strong>THS (%) W.CAP MARGIN BANK W.CAP MARGIN BANK W.CAP MARGIN BANK W.CAP MARGIN BANK W.CAP MARGIN BANK<br />
REQMT M<strong>ON</strong>EY FINANCE REQMT M<strong>ON</strong>EY FINANCE REQMT M<strong>ON</strong>EY FINANCE REQMT M<strong>ON</strong>EY FINANCE REQMT M<strong>ON</strong>EY FINANCE<br />
Raw materials & other commodities 1.00 25.00 0.12 0.03 0.09 0.17 0.04 0.13 0.22 0.05 0.16 0.26 0.07 0.20 0.26 0.07 0.20<br />
Finished Goods 1.00 25.00 0.24 0.06 0.18 0.32 0.08 0.24 0.39 0.10 0.29 0.45 0.11 0.34 0.46 0.11 0.34<br />
A/c Receivable 1.00 25.00 0.34 0.08 0.25 0.41 0.10 0.30 0.51 0.13 0.38 0.61 0.15 0.46 0.61 0.15 0.46<br />
Cash in hand<br />
Salaries & wages 1.00 0.00 0.03 0.00 0.03 0.04 0.00 0.04 0.04 0.00 0.04 0.04 0.00 0.04 0.04 0.00 0.04<br />
Utilities 1.00 0.00 0.01 0.00 0.01 0.01 0.00 0.01 0.02 0.00 0.02 0.02 0.00 0.02 0.02 0.00 0.02<br />
Advertising & Promotional Expenses 1.00 0.00 0.07 0.00 0.07 0.08 0.00 0.08 0.10 0.00 0.10 0.12 0.00 0.12 0.12 0.00 0.12<br />
Admin. Overheads 1.00 0.00 0.01 0.00 0.01 0.01 0.00 0.01 0.01 0.00 0.01 0.01 0.00 0.01 0.01 0.00 0.01<br />
Total Requirement 0.80 0.17 0.63 1.03 0.22 0.80 1.27 0.28 0.99 1.50 0.33 1.17 1.51 0.33 1.18<br />
123
Factory Related<br />
EXHIBIT 5.3 (Contd...)<br />
REQUIREMENT <strong>OF</strong> WORKING CAPITAL<br />
ITEM NO. <strong>OF</strong> MARGIN YEAR VI YEAR VII YEAR VIII YEAR IX<br />
(Rs. Cr.)<br />
YEAR X<br />
M<strong>ON</strong>THS (%) W.CAP MARGIN BANK W.CAP MARGIN BANK W.CAP MARGIN BANK W.CAP MARGIN BANK W.CAP MARGIN BANK<br />
REQMT M<strong>ON</strong>EY FINANCE REQMT M<strong>ON</strong>EY FINANCE REQMT M<strong>ON</strong>EY FINANCE REQMT M<strong>ON</strong>EY FINANCE REQMT M<strong>ON</strong>EY FINANCE<br />
Raw materials & other commodities 1.00 25.00 0.26 0.07 0.20 0.26 0.07 0.20 0.26 0.07 0.20 0.26 0.07 0.20 0.26 0.07 0.20<br />
Finished Goods Stock 1.00 25.00 0.46 0.11 0.34 0.46 0.12 0.35 0.47 0.12 0.35 0.47 0.12 0.35 0.48 0.12 0.36<br />
A/c Receivable 1.00 25.00 0.61 0.15 0.46 0.61 0.15 0.46 0.61 0.15 0.46 0.61 0.15 0.46 0.61 0.15 0.46<br />
Cash in hand<br />
Salaries & wages 1.00 0.00 0.04 0.00 0.04 0.05 0.00 0.05 0.05 0.00 0.05 0.06 0.00 0.06 0.06 0.00 0.06<br />
Utilities 1.00 0.00 0.00 0.00 0.00 0.00 0.00 0.00 0.00 0.00 0.00 0.00 0.00 0.00 0.00 0.00 0.00<br />
Advertising & Promotional Expenses 1.00 0.00 0.00 0.00 0.00 0.00 0.00 0.00 0.00 0.00 0.00 0.00 0.00 0.00 0.00 0.00 0.00<br />
Admin. Overheads 1.00 0.00 0.12 0.00 0.12 0.12 0.00 0.12 0.12 0.00 0.12 0.12 0.00 0.12 0.12 0.00 0.12<br />
Total Requirement 1.51 0.33 1.18 1.52 0.33 1.19 1.53 0.33 1.20 1.54 0.34 1.20 1.55 0.34 1.21<br />
124
EXHIBIT 5.4<br />
MANPOWER REQUIREMENTS<br />
Nos Monthly Total Monthly Salary Annual<br />
General Manager 1 30000 30000 360000<br />
Machine Operators 6 6000 36000 432000<br />
Machine Operators 6 6000 36000 432000<br />
Material Handling 2 6000 12000 144000<br />
R&D, Testing 2 8000 16000 192000<br />
Marketing & Sales<br />
Marketing Head 1 25000 25000 300000<br />
Sales Team 5 12000 60000 720000<br />
Clerical Staff (Admin, Accounts etc) 2 6000 12000 144000<br />
Other Staff (Peon, Security) 2 3000 6000 72000<br />
Maintenance (Elec. & Mech.) 1 10000 10000 120000<br />
TOTAL 29 243000 2916000<br />
Fringe Benefits (40 % of the above) 1166400<br />
Total Wage Bill (Annual) Rs. lakhs: Salary + Other Benefits = 4082400<br />
Total Wage Bill (Annual) Rs. Cr.: 0.40824<br />
125
EXHIBIT 5.5<br />
PR<strong>OF</strong>ITABILITY STATEMENT AND COMPUTATI<strong>ON</strong> <strong>OF</strong> TAX<br />
(Rs.Cr)<br />
ACCOUNT HEAD FINANCIAL YEAR <strong>OF</strong> OPERATI<strong>ON</strong><br />
I II III IV V VI VII VIII IX X<br />
Revenue<br />
Net Sales Turnover 4.06 4.87 6.09 7.30 7.30 7.30 7.30 7.30 7.30 7.30<br />
Total Revenue 4.06 4.87 6.09 7.30 7.30 7.30 7.30 7.30 7.30 7.30<br />
Expenses<br />
Raw Materials 1.39 2.08 2.60 3.12 3.12 3.12 3.12 3.12 3.12 3.12<br />
Salaries & wages 0.41 0.43 0.45 0.47 0.50 0.54 0.58 0.63 0.68 0.73<br />
Power, Fuel, Stores & Other Expenses (including packing 0.10 materials) 0.16 0.20 0.23 0.23 0.23 0.23 0.23 0.23 0.23<br />
Marketing & Promotional Expenses 0.81 0.97 1.22 1.46 1.46 1.46 1.46 1.46 1.46 1.46<br />
Factory & Office Overheads 0.17 0.17 0.17 0.17 0.17 0.17 0.17 0.17 0.17 0.17<br />
Interest on S.T. Loans 0.07 0.09 0.11 0.13 0.13 0.13 0.13 0.13 0.13 0.13<br />
Cost of Sales 2.95 3.89 4.74 5.58 5.61 5.65 5.69 5.74 5.79 5.85<br />
Depreciation (St.Line) 0.13 0.13 0.13 0.13 0.13 0.13 0.13 0.13 0.13 0.13<br />
Amort. of Expenses 0.01 0.01 0.01 0.01 0.01 0.01 0.00 0.00 0.00 0.00<br />
Interest on L.T Loan 0.08 0.08 0.08 0.07 0.06 0.05 0.04 0.03 0.02 0.01<br />
Profit Before Tax 0.89 0.76 1.13 1.51 1.50 1.47 1.44 1.41 1.37 1.32<br />
Tax 0.16 0.16 0.33 0.49 0.50 0.51 0.51 0.51 0.50 0.49<br />
Profit After Tax 0.73 0.59 0.80 1.02 1.00 0.96 0.93 0.90 0.87 0.83<br />
Dividend 0.00 0.00 0.05 0.05 0.05 0.11 0.11 0.11 0.11 0.11<br />
Profits For Appropriation 0.73 0.59 0.75 0.97 0.94 0.85 0.82 0.79 0.76 0.72<br />
COMPUTATI<strong>ON</strong> <strong>OF</strong> TAX<br />
Profit after interest before depreciation 1.02 0.89 1.26 1.64 1.63 1.60 1.57 1.54 1.50 1.45<br />
Depr.(WDV) to be claimed 0.56 0.42 0.32 0.25 0.19 0.15 0.11 0.09 0.07 0.05<br />
Depreciation claimed 0.56 0.42 0.32 0.25 0.19 0.15 0.11 0.09 0.07 0.05<br />
Depr. carried forward 0.00 0.00 0.00 0.00 0.00 0.00 0.00 0.00 0.00 0.00<br />
Taxable Profit 0.47 0.46 0.94 1.40 1.44 1.45 1.46 1.45 1.43 1.40<br />
Profit Before Tax (Book) 0.89 0.76 1.13 1.51 1.50 1.47 1.44 1.41 1.37 1.32<br />
Minimum Alternate Tax 0.00 0.00 0.00 0.00 0.00 0.00 0.00 0.00 0.00 0.00<br />
Tax (Actual) 0.16 0.16 0.33 0.49 0.50 0.51 0.51 0.51 0.50 0.49<br />
Tax Provision 0.16 0.16 0.33 0.49 0.50 0.51 0.51 0.51 0.50 0.49<br />
126
EXHIBIT 5.6<br />
SENSITIVITY ANALYSIS<br />
Items Profit after Tax<br />
(PAT)<br />
Rs. Cr.<br />
(assumed at 90 %<br />
capacity)<br />
Break<br />
Even<br />
(%)<br />
Appendix – 5A (Contd…)<br />
Internal<br />
Rate of<br />
Return<br />
(IRR)<br />
(%)<br />
Payback<br />
Period<br />
(Years)<br />
NORMAL VALUES 1.02 60.33 34.84 3.09<br />
Debt Equity Ratios<br />
(a) 2:1<br />
(b) 1:1<br />
Increase in Project Cost<br />
by 10 %<br />
Decrease in Selling Price<br />
by 10%<br />
Increase in Selling Price<br />
by 10%<br />
Decrease in Raw<br />
Material Prices by 10%<br />
1.02<br />
1.03<br />
1.02<br />
60.52<br />
60.04<br />
60.85<br />
34.94<br />
34.70<br />
32.29<br />
3.08<br />
3.10<br />
3.25<br />
0.65 69.69 23.82 4.01<br />
1.40 53.94 44.80 2.50<br />
1.25 55.38 40.81 2.71<br />
127
Appendix – 5A (Contd…)<br />
SANITARY NAPKINS PROJECT (C<strong>ON</strong>VERTING LINE)<br />
SECTI<strong>ON</strong> I : PRODUCT BRIEF, USAGE PATTERNS AND<br />
MARKET POTENTIAL<br />
6.1 Sanitary Napkins are absorbent disposable single use products designed to receive, absorb, retain<br />
menstrual fluid and isolate them from the rest of the body.<br />
6.2 Initially Sanitary Napkins were made out of rags and later from absorbent cotton.<br />
But protection provided by such Sanitary Napkins was not adequate and were also not<br />
very comfortable to use. Due to these inadequacies, considerable R&D has taken place to<br />
evolve better products. These developments have been both in product design and the<br />
materials used therein.<br />
6.3 From the basic Sanitary Napkins consisting of cotton wool in guaze cloth, the<br />
present day design of Indian napkins is that of flat, rectangular type, consisting of wood<br />
pulp and a non woven cover wrap to maintain the shape of the product and keep skin<br />
contact dry.<br />
6.4 The current trend is to use spunbond polypropylene, the light weight nonwoven<br />
fabric which serves as a cover layer next to the skin allowing moisture to penetrate to the<br />
absorptive layer below while the cover remains relatively dry and comfortable next to the<br />
skin. Nonwovens continue to be the basic material for feminine hygiene products as<br />
consumers expect higher quality, comfort and environmental friendliness. However, the<br />
premium brands of sanitary napkins have started using extruded plastic films instead<br />
of nonwovens.<br />
6.5 Superabsorbent polymers (SAP) play an important role in producing absorbency<br />
properties. The combination of nonwoven webs and superabsorbent additives helps to<br />
reach 90% of their absorption capacity in 15 seconds. This is the main reason behind<br />
increasing use of these materials in the sanitary napkins in today’s market. These SAPs<br />
are added to the wood pulp to enhance the absorption capacities. They find great use in<br />
the Ultrathin range of sanitary napkins which demands good absorption capacity with<br />
reduced weight of the wood pulp for thinner napkins.<br />
6.6 Sanitary Napkins are used by females normally in the reproductive age group of<br />
15 - 44 years.<br />
6.7 The important and desired properties in the sanitary napkins are:<br />
• No Leakage,<br />
• No unaesthetic appearance or colour,<br />
129
• No odour,<br />
• No noise,<br />
• Stay in place,<br />
• Comfortable to wear,<br />
• Hygienic<br />
Emerging Market Potential - Global and Indian<br />
Appendix – 5A (Contd…)<br />
6.8 The global feminine hygiene market comprising of sanitary napkins and tampons account for an<br />
estimated $11.6 bn in the year 2000. According to EDANA, the West European market for Sanitary<br />
Napkins (2001) is 13.5 bn napkins.<br />
Market Size and Potential:<br />
6.9 The Indian market size for Sanitary Napkins as seen from the published sources<br />
has shown a growing trend from Rs. 250 Cr. (1999-2000) to Rs. 300 Cr. (2001-02)<br />
reflecting a CAGR of around 9.54 per cent. On the basis of three pronged approach<br />
comprising the Retailers, Industry Feedback and Desk Research, it was seen that the<br />
Indian sanitary napkins market was around Rs. 300 Cr to Rs. 350 Cr. (2001-02)<br />
6.10 The Indian Sanitary Napkins market can be divided into High end or Premium<br />
Products, Mid tier products and Low tier products, depending on their price range. The<br />
players having presence in the market are Johnson & Johnson, Proctor & Gamble,<br />
Kimberly Clark who import some of their napkins from their parent company situated<br />
abroad and then sell it in the Indian markets after repacking them in smaller pack sizes.<br />
The Indian players with a foothold in the market are Dima Products, Gufic Biosciences,<br />
Golden Surgimed etc.<br />
6.11 Consumption of nonwovens is primarily in the low and mid-tier price segments of<br />
the sanitary napkins market (account for 70% of the volumes). It has been observed that<br />
bulk of the nonwoven fabrics requirement is met through imports.<br />
6.12 The market potential for sanitary napkins has been presented under alternative<br />
scenarios has shown below :<br />
1. Scenario I : Normative Approach (Based on Industry Feedback)<br />
2. Scenario II : Urban penetration estimated to inc. from current 20%<br />
3. Scenario<br />
III<br />
to 23% (2003 - 04) and 32% (2007 - 08).<br />
: Urban penetration estimated to inc. from current 20%<br />
to 23% (2003 - 04) and 32% (2007 - 08) along with<br />
Rural penetration increase form current zero percent to<br />
1.5% (2003 - 04) and 5% (2007 - 08).<br />
130
Appendix – 5A (Contd…)<br />
6.13 It may be assumed that the average of the projections of these estimates would<br />
provide a more realistic picture which takes into consideration the performance of the<br />
past and the scope for greater demand in the rural and urban market.<br />
6.14 The detailed market projections for the sanitary napkins and the demand for the<br />
nonwovens arising therefrom is shown below:<br />
DEMAND FOR SANITARY NAPKINS<br />
Year Scenario I Scenario II Scenario III<br />
Average<br />
S. N. demand<br />
2001 - 02 Rs.300.00 Cr. Rs.353.84 Cr. Rs.353.84 Cr. Rs. 335.89 Cr.<br />
(857.14 ) (1010.96) (1010.96) (959.69)<br />
2003 - 04 Rs.376.32 Cr. Rs.419.74 Cr. Rs.493.45 Cr. Rs. 429.84 Cr.<br />
(1075.20) (1199.26) (1409.86) (1228.11)<br />
2007 - 08 Rs.592.15 Cr. Rs.621.78 Cr. Rs.883.38 Cr. Rs. 699.10 Cr.<br />
(1691.85) (1776.52) (2523.94) (1997.44)<br />
(Figures in bracket represent volume in million nos.)<br />
DEMAND FOR N<strong>ON</strong>WOVENS<br />
Year Nonwoven demand Average NW<br />
Scenario I Scenario II Scenario III consumption<br />
2001 - 02 Rs. 7.41 Cr. Rs. 8.74 Cr. Rs. 8.74 Cr. Rs. 8.32 Cr.<br />
(642.00) (757.21) (757.21) (718.81)<br />
2003 - 04 Rs. 9.30 Cr. Rs. 10.37 Cr. Rs. 12.19 Cr. Rs. 10.62 Cr.<br />
(805.32) (898.25) (1055.98) (919.85)<br />
2007 - 08 Rs. 14.63 Cr. Rs. 15.36 Cr. Rs. 21.83 Cr. Rs. 17.27 Cr.<br />
(1267.19) (1330.61) (1890.43) (1496.08)<br />
(Figures in bracket represent the nonwoven requirement in tonnes)<br />
* Demand projections are subject to Market Realisation<br />
131
Appendix – 5A (Contd…)<br />
SECTI<strong>ON</strong> II : SANITARY NAPKINS: MANUFACTURING<br />
TECHNOLOGY & EQUIPMENT SUPPLIERS<br />
Process Description:<br />
6.15 The main raw material is cellulose pulp in rolls. The pulp goes through a cylinder mill, where it is<br />
fluffed. The entry of the pulp roll is regulated by a speed variator so does the weight. A super absorbent<br />
powder can be applied at this stage on the fluffed pulp. The fluffed pulp goes on top of a tissue paper layer<br />
which is folded in “C” form, in order to obtain the standard width of the napkins. For the production of<br />
sophisticated napkin, it is also possible, at this stage, to insert an liquid along their whole length of the<br />
napkins. This continuous line of pulp and tissue is then cut by a rotary knife at the required length. A poly<br />
film to protect the bottom part of the napkins is also inserted. The resulting pads are then spaced and passed<br />
on the non-woven fabric covering which is then embossed and cut by a die cutter roll adequately shaped for<br />
the napkins with wings, or for napkins with round ends without wings.<br />
6.16 A permanent multi-lines adhesive, protected by a silicoated paper strip is applied<br />
on the nonwoven back sheet, while self-adhesive tabs are applied on the wings. The<br />
finished product with the folded wings is delivered to an automatic counter and stacker<br />
unit, which counts and discharges, in a pre-selected number, the finished napkins. The<br />
operator (preferably women) will insert by hand the pre-counted groups of napkins inside<br />
plastic bags. These bags are then sealed by a separate sealing machine.<br />
132
Appendix – 5A (Contd…)<br />
SANITARY NAPKINS MANUFACTURING PROCESS<br />
Pulp<br />
Mat<br />
Cutting<br />
Nonwoven<br />
Wrapping<br />
Product<br />
Stacking<br />
Product<br />
Packing<br />
FLOW CHART<br />
Pulp<br />
Pulverising<br />
Nonwoven<br />
Covering<br />
Adhesive / Glue<br />
Application<br />
Product<br />
Cutting<br />
Polythene<br />
Wrapping<br />
Tab-end<br />
Sealing<br />
Conveyor<br />
133
Product Composition:<br />
6.17 Composition of the Sanitary Napkins is as follows:<br />
❉ Wood Pulp Core (Fluff) / Airlaid Core,<br />
❉ Super Absorbent Powder,<br />
❉ Sublayer / Acquisition layer,<br />
❉ Transfer Layer;<br />
Appendix – 5A (Contd…)<br />
❉ Coverstock / Topsheet (Nonwoven or perforated Poly),<br />
❉ Backsheet (Polyethylene),<br />
❉ Release Paper,<br />
❉ Paper Tape on the wings<br />
Machinery (Technology & Equipment) Suppliers and Specifications<br />
6.18 Globally, the known technology suppliers contacted by TECS are:<br />
1. M. D. Viola (Italy),<br />
2. Diatec SRL (Italy),<br />
3. Rainbow Fame (Taiwan)<br />
4. Caldiroli (Italy),<br />
5. BHT Bicma (Germany)<br />
6. Fameccanica (Italy),<br />
7. Winkler+Dunnebier (Germany),<br />
8. Cellulose Converting Equipment (Italy),<br />
9. Zuiko (Japan),<br />
10. Joa Curt (USA),<br />
11. General Disposable Machinery (Italy),<br />
Note : The list contains the leading global players in Sanitary Napkins Manufacturing<br />
Technology and based on discussion with Industry experts the above list is<br />
exhaustive.<br />
6.19 TECS has received favourable responses and indicative quotations from the technology suppliers.<br />
134
Process Systems and Equipments<br />
Appendix – 5A (Contd…)<br />
• The machinery required for the manufacturing of the sanitary napkins are as<br />
follows:<br />
o Pulp/Airlaid Unwinder,<br />
o Core Cutting Section,<br />
o Air Collection System and filter,<br />
o Back Sheet and coverstock Unwinder,<br />
o Wings Folding,<br />
o Sealing Station,<br />
o Central Silicon Tape Applicator/Wing Tape Applicator,<br />
o Adhesive Applicator,<br />
o Cutting Unit,<br />
o Counting and Stacking Unit.<br />
Recommended Minimum Economic Size:<br />
6.20 The proposed Sanitary Napkins project to be set up in India will have a designed<br />
capacity of 600 napkins per min<br />
6.21 Under Indian operating conditions it is safer to assume machine efficiency factor of 75%, and<br />
therefore the production would be 450 napkins per min<br />
6.22 The plant would operate in Three shifts, 24 hours and 300 working days in a year.<br />
Investment in Process Plant and Machinery:<br />
6.23 The investment in the process plant and machinery will be Rs 3.52<br />
crores (FOB) after accounting for a discount of 15% . Finer details on the Equipment<br />
listing, specification and the quotations need to be discussed with the technology supplier<br />
before the project is taken up. Taking into account the CIF value , the custom duties (5%),<br />
CVD (16%), inland transportation and loading, unloading (2%), erection and<br />
commissioning (5%), the installed cost of process equipment would be Rs 4.69 crores.<br />
6.24 The converting line mentioned above is dedicated for sanitary napkins only.<br />
135
SECTI<strong>ON</strong> III : PROJECT COST & FINANCIALS<br />
Land<br />
Appendix – 5A (Contd…)<br />
6.25 The total requirement of land for this project keeping in mind the possible future<br />
expansion is around 6069 Sq. Mtrs. ( 1.5 acres ).<br />
6.26 Based on the available information the cost of land is assumed at Rs 1200 per<br />
square meter (including the developmental cost). Depending on the exact location of the<br />
project to be determined by the promoter, the land cost could be higher or lower. Hence<br />
the total cost of developed land will be Rs 0.73 crore (Rs 73 lakhs).<br />
Buildings<br />
6.27 The building area comprising of main factory building, godowns, office, R & D<br />
labs/ In-house Testing centre etc. would be 3000 sq. Mtrs. The cost of construction<br />
would again vary depending on the structure and the materials to be used. It has been<br />
assumed that the average cost of construction would be Rs 4500 per sq. Mt. Thus the<br />
total cost of building and other civil works would be around Rs 1.35 crores.<br />
Plant and Machinery<br />
6.28 Details of Plant and machinery as well as technology required for the project have<br />
been presented in earlier Section II . The installed cost of plant and machinery would be<br />
Rs 4.69 crores.<br />
6.29 Apart from the main process equipments the other utilities required are:<br />
♦ Electricals,<br />
♦ Piping,<br />
♦ Water supply,<br />
♦ Compressors,<br />
♦ Fire fighting equipments etc.<br />
6.30 The provision on this count is taken as 5% of the cost of machinery which works out to Rs 0.23<br />
crores (Rs 23 lakhs).<br />
Miscellaneous Fixed Assets<br />
6.31 Under this head the items included are Furniture and fixtures, Office equipments, Air Conditioners<br />
etc. and the provision made is around Rs 0.15 crore (Rs 15 lakhs).<br />
136
Testing Facilities<br />
Appendix – 5A (Contd…)<br />
6.32 The sanitary napkins unit calls for Tensile Strength testing, Burst Strength<br />
testing for Corrugated Boxes, Dancing Lady (which has its legs moving to mimic the<br />
walking effects of the females). A provision of around Rs 0.15 crore (Rs 15 lakhs) is<br />
made on this count.<br />
Project Engineering and Consulting<br />
6.33 Under this head the items included are the fees and expenses on account of Architect fees, project<br />
engineering and management (both local and overseas ), detailed project reports etc.<br />
Preliminary & Preoperative Expenses<br />
6.34 The items included under this head are company formation expenses, public issue<br />
expenses (if any), interest during construction, pre production expenses during the<br />
implementation phase etc.<br />
Contingency Expenses<br />
6.35 Depending on the gestation period and further detailing of the project cost by the promoter, the<br />
contingency provision has been made at the rate of 10%.<br />
Margin Money for Working capital<br />
6.36 The margin money for working capital forming part of the total project cost would<br />
be Rs 0.70 crores (Rs 70 lakhs). [Exhibit 6.3]<br />
Total Project Cost (Total Investment))<br />
6.37 The total project cost as given in Exhibit 6.1 would be Rs 9.84 crores.<br />
Project Funding and Financing Pattern:<br />
6.38 It has been assumed that the project would be financed through long term funds<br />
and Equity participation by the Promoter / Public. The technical textile sector being a<br />
high priority area , it is assumed that a Debt- Equity ratio of 1.5 : 1 would be feasible.<br />
(However the sensitivity analysis has also been presented for 1 : 1 and 2 : 1 Debt Equity<br />
ratios.)<br />
137
Sales, Profitability and Sensitivity Analysis:<br />
Sales Realisation and Turnover<br />
Appendix – 5A (Contd…)<br />
6.39 As per the details available from the Technology and Equipment suppliers the<br />
economic size of a plant is 600 napkins per min.<br />
6.40 Under the Indian conditions, it is assumed that the machine would operate at an<br />
efficiency level of 75%. Hence the production from the plant would be 450 napkins per<br />
min.<br />
6.41 The plant would operate on Three-shift basis and 300 workings days in a year.<br />
6.42 The capacity utilisation for the 1st year is assumed at 50% and thereafter for the 2nd, 3rd and 4th<br />
year onwards 60%, 75% and 90% respectively.<br />
6.43 The average selling price of the end product would be Rs 1.50 per napkin.(sales<br />
tax and other incidental expenses). The prevailing market price for sanitary napkins vary<br />
from Rs. 2 to 8 per napkin. Being a product for the females, the end product is exempt<br />
from excise duty. These are the prices of the product sold by the established players in the<br />
country. The international price of the sanitary napkins are Rs 2 - 3.50 per napkin. On this<br />
the import duties, margins etc. get added.<br />
6.44 The details of projected sales turnover as projected are given in Exhibit 6.2.<br />
Cost of Production:<br />
Major Raw materials and their specifications:<br />
6.45 The main raw materials used and the corresponding prevailing prices as an indicator are as<br />
follows:<br />
Raw Material Prices Landed cost<br />
(inclusive of all duties)<br />
Wood Pulp Core Rs. 30 per kg Rs. 35 per kg<br />
Nonwoven Rs. 90 per kg Rs. 110 per kg<br />
Super Absorbent Polymer Rs. 70 per kg Rs. 110 per kg<br />
Hot Melt Glue Rs. 150 per kg Rs. 300 per kg<br />
138
Appendix – 5A (Contd…)<br />
6.46 Apart from the above, other materials also form a part of the napkins like those mentioned below:<br />
∗ Tissue,<br />
∗ Release Paper,<br />
∗ PE Film,<br />
∗ Paper Tape on the wings,<br />
6.47 However, Wood Pulp Core (Fluff) and Nonwoven or Perforated Poly account for around 60-65%<br />
of the total raw material cost and around 70% of the weight of the sanitary napkins raw materials.<br />
6.48 The spunbond nonwoven (coverstock) of 15-18 gsm is used.<br />
6.49 The leading raw material suppliers of the sanitary napkins are:<br />
• Wood Pulp Core (Fluff): Georgia Pacific, Weyerhaeuser, Tartas S.A.,<br />
Buckeye Cellulose Corporation, Cellu Tissue Corporation,<br />
• Nonwoven or Perforated Poly: Amoco Fabrics Division, Fabriano Soft S.r.l.,<br />
Tenotex S.p.a., Pantex Group<br />
6.50 The requirement of the raw materials would be Rs 13.27 crores, accounting for a process waste of<br />
5%. (100% Capacity Utilisation)<br />
Conversion Cost<br />
6.51 The conversion cost will include cost of power, water, chemicals and additives, consumables etc.,<br />
which is assumed at 10% of the raw material cost.<br />
Manpower, Salaries and Wages<br />
6.52 The manpower requirements and the salary structure is given in Exhibit 6.4.<br />
6.53 The total manpower requirement comprising the managerial cadre of supervisors, machine<br />
operators and helpers would be 48 persons. The wage bill for the conversion unit would be Rs 0.67 crores.<br />
Repairs and Maintenance<br />
6.54 Provision has been made for repairs and maintenance at 2.5% of the cost of the process plant and<br />
equipment, which would be required during its operating life span.<br />
Factory and Overhead Expenses<br />
6.55 The items covered under this head are establishment expenses, repairs and maintenance, stationery,<br />
travel expenses, packaging expenses etc.<br />
139
Marketing and Promotional Expenses<br />
Appendix – 5A (Contd…)<br />
6.56 The promotion of sanitary napkins will call for expenditure on this count and a provision of 25%<br />
of the annual sales has been made uniformly over the years.<br />
6.57 This provision includes the margins to the distributors, retailers, advertising and promotional<br />
expenses etc. Being a new project, such heavy expenditure on marketing and promotional efforts would be<br />
required to penetrate the market with a stronghold of the MNCs.<br />
Interest and Depreciation<br />
6.58 The prevailing interest rate for long term and short term borrowed funds is assumed at 5% p.a. and<br />
11% p.a. respectively. (Project included under Technology Upgradation Fund).<br />
6.59 The repayment of loan has been assumed for 10 years with a moratorium period of two years<br />
(2+8).<br />
6.60 The depreciation rates have been worked out as per Company’s Act (SLM) and<br />
Income-Tax Ready Reckoner (WDV).<br />
6.61 The current corporate tax rate is assumed at 35% and the surcharge is assumed at<br />
2.5% per annum.<br />
Profitability, Break-even, IRR, DSCR and Payback<br />
6.62 As presented in Exhibit 6.5, the sales turnover increases from Rs 14.29 crores in<br />
the first year to Rs 25.72 crores from the 4th year.<br />
6.63 The PBT increases from Rs 0.43 crores in the first year to Rs 3.51 crores in the<br />
fourth year.<br />
6.64 The Break Even of the project is at 75.98%.<br />
6.65 The Internal Rate of Return ( IRR ) has been worked out at 21.82%.<br />
6.66 The Payback period for the project is 4.42 years.<br />
Sensitivity Analysis<br />
6.67 The sensitivity analysis has been presented in the Exhibit 6.6.<br />
140
OPTI<strong>ON</strong> II (Based on Local / Chinese Technology)<br />
Appendix – 5A (Contd…)<br />
6.68 This option presents the choice of the cheaper machine (Chinese make) with an<br />
installed cost in the process plant and machinery of Rs 69 lakhs. The total project cost<br />
would be Rs 4.26 crores.<br />
6.69 The designed capacity of the machine is for 350 pads per min<br />
Profitability, Break-even, IRR, DSCR and Payback<br />
6.70 As presented in Exhibit 6.5, the sales turnover increases from Rs 8.33 crores in<br />
the first year to Rs 15 crores from the 4th year onwards.<br />
6.71 The PBT increases from Rs 0.42 crores in the first year to Rs 1.92 crores in the<br />
fourth year.<br />
6.72 The Break Even of the project is at 74.28%.<br />
6.73 The Internal Rate of Return ( IRR ) has been worked out at 24.57%.<br />
6.74 The Payback period for the project is 4.14 years.<br />
COMPARISI<strong>ON</strong> <strong>OF</strong> ALTERNATE TECHNOLOGIES<br />
Technology Particulars Option - I<br />
European Technology<br />
Sanitary Napkin Project<br />
Option - II<br />
Local / Chinese Technology<br />
Capacity 600 Napkins per min 350 Napkins per min<br />
Project Cost Rs. 9.84 Cr Rs. 4.26 Cr.<br />
Revenue (1st year) Rs. 14.29 Cr. Rs. 8.33 Cr.<br />
BEP 75.98% 74.28%<br />
IRR 21.82% 24.57%<br />
Payback 4.42 years 4.14 years<br />
DEVELOPMENTAL AND PROMOTI<strong>ON</strong>AL MEASURES<br />
6.75 Sanitary Napkins are manufactured as per the BIS No. IS : 5405 as given in<br />
Annexure I. There is a need for periodic updating and revision of these standards.<br />
141
Appendix – 5A (Contd…)<br />
6.76 The new products use the gel technology and not the traditional filler material. Gel<br />
based napkins (ultrathins) absorb the fluid and convert it into a gel which gets sealed<br />
inside, hence there is a need for revision of the standards.<br />
6.77 Norm and clear size designation should be made a part of the Standards.<br />
6.78 TECS global search has revealed that there are no regulatory norms for disposal<br />
of the sanitary napkins in the developed/developing countries.<br />
6.79 Industry should find out hygienic and environment-friendly methods for disposal.<br />
6.80 Although there are no environmental regulations for sanitary napkins but within<br />
the plant, concept of positive air pressure should be maintained to ensure hygienic<br />
conditions in the plant.<br />
6.81 It is generally avoidable to use asbestos based material for roofing or in any other<br />
form as it is considered to be carcinogenic.<br />
6.82 Prevailing duty structure on the following products needs revision for the<br />
promotion of this sector and even be competitive in the export market.<br />
Item Prevailing Duty Structure Recommended Duty Structure<br />
Wood Pulp 5% (BCD) + 4% (CVD) Total Duty : 5%<br />
NonWovens 20% (BCD) + 16% (CVD) +<br />
Super Absorbent<br />
Polymers<br />
0.5% (Textile Cess)<br />
Total Duty : 10%<br />
20% (BCD) + 16% (CVD) Total Duty : 10%<br />
Hot Melt Glue 20% (BCD) + 16% (CVD) Total Duty : 10%<br />
6.83 There are no norms fixed for rebate on the duty structure even if the manufacturer<br />
undertakes export orders. The Duty Drawback Scheme should be introduced for the<br />
exports of these napkins.<br />
6.84 There is a great potential for export of these products to the developing<br />
countries (SAARC, Africa and Middle East). The MNCs may not be competitive due<br />
to their Trade Pockets Agreement, which force them to export either from US or UK<br />
which increases the freight cost considerably. The Indian manufacturers have a great<br />
advantage here due to proximity to these regions and hence lower transportation<br />
costs making our products competitive in those markets.<br />
6.85 The Indian sanitary napkin market has attained a maturity level in terms of<br />
production and promotion of latest products available in developed countries. The<br />
142
Appendix – 5A (Contd…)<br />
industry is well equipped in terms of availability of desired level of technical, marketing<br />
and R&D based manpower resources.<br />
6.86 This industry is providing opportunities for outsourcing and job work on behalf of<br />
MNCs.<br />
6.87 With the expansion of the market base in semi-urban and rural areas, there is<br />
scope for addition of new conversion units. The inclusion of these units in the SSI sector<br />
is a recent phenomenon. However in view of the investment level required in setting up<br />
state-of-the-art unit and the absence of indigenous suppliers of the machinery, the Rs 1<br />
crore limit is not feasible.<br />
6.88 For new and existing projects of MNCs or non-SSI.units, there is an export<br />
obligation of 50%.<br />
6.89 To ensure the quality of the sanitary napkins and strict adherence to the prescribed<br />
standards, a common testing facility can be set up in reputed organisations like<br />
SASMIRA, BTRA, etc. This facility would enable the small time converters for testing<br />
their raw material and finished products.<br />
6.90 The penetration levels of the product in the urban and semi-urban regions is low<br />
currently. This is due to lack of awareness of the hygienic aspects of the product coupled<br />
with the unaffordability of the napkins.<br />
6.91 The product awareness development program may be launched right from the<br />
school level, for the promotion of these products in the semi-urban and rural areas by the<br />
concerned authorities in collaboration with the major players.<br />
6.92 The Government can promote the indigenous manufacturers by giving them<br />
Preferential Treatment by encouraging the Government hospitals to buy a fixed percent<br />
of their total requirement from these players only, without compromising on the quality.<br />
6.93 To ensure the quality of the sanitary napkins and strict adherence to the prescribed<br />
standards, a common testing facility can be set up in reputed organisations like<br />
SASMIRA, BTRA, etc. This facility would enable the small time converters for testing<br />
their raw material and finished products.<br />
6.94 To ensure the quality of the sanitary napkins and strict adherence to the prescribed standards, a<br />
common testing facility can be set up in reputed organisations like SASMIRA, BTRA, etc. This facility<br />
would enable the small time converters for testing their raw material and finished products.<br />
143
Exhibit 6.1 PROJECT COST<br />
(LAND, BUILDINGS, PROCESS PLANT & MACHINERY, UTILITIES & O<strong>THE</strong>R ASSETS)<br />
Project Cost (Rs. Cr.)<br />
1 Land 0.73<br />
Area: 1.5 acres ( 6069 Sq Mtrs)<br />
Rate: (Rs.1200 /Sq. Mtr)<br />
2 Buildings 1.35<br />
(Plant Area, Office, Godown, Lab, Service Area etc.)<br />
Built-up Area : 3000 Sq. Mtrs<br />
Avg Rate : Rs.4500 /Sq. Mtrs<br />
3 Process Plant & Equipment 4.69<br />
4 Utility & Other equipments (5%) 0.23<br />
(Power, Water, Compressor, Humidity Control,<br />
Fire Fighting, Material Handling etc.)<br />
5 Misc. Fixed Assets 0.15<br />
(Furniture & Fixtures, Office Equipment, Testing Lab etc.)<br />
6 Testing Equipments 0.15<br />
7 Project Engineering & Consultancy charges (2.5%) 0.17<br />
8 Preliminary & Pre-operative Expenses (12%) 0.84<br />
(Company Formation, Interest during construction,<br />
pre-production expenses, etc.)<br />
9 Contingency (10 %) 0.83<br />
10 Total 9.14<br />
11 Margin Money for Working Capital 0.70<br />
12 Total Project Cost 9.84<br />
145
Exhibit 6.2<br />
ESTIMATI<strong>ON</strong> <strong>OF</strong> SALES REVENUE<br />
ITEM YEAR <strong>OF</strong> OPERATI<strong>ON</strong><br />
I II III IV V VI VII VIII IX X<br />
Average Production per min 600 600 600 600 600 600 600 600 600 600<br />
75% efficiency 450 450 450 450 450 450 450 450 450 450<br />
Capacity Utilisation 50% 60% 75% 90% 90% 90% 90% 90% 90% 90%<br />
Actual Production per min (pcs) 225 270 338 405 405 405 405 405 405 405<br />
Actual Production per hr (pcs) 13500 16200 20250 24300 24300 24300 24300 24300 24300 24300<br />
Production per day (pcs) 324000 388800 486000 583200 583200 583200 583200 583200 583200 583200<br />
Production for 300 working days (pcs) 97200000 116640000 145800000 174960000 174960000 174960000 174960000 174960000 174960000 174960000<br />
Selling Price (Rs / napkin) 1.50 1.50 1.50 1.50 1.50 1.50 1.50 1.50 1.50 1.50<br />
Sales Revenue (Rs. Cr) 14.58 17.50 21.87 26.24 26.24 26.24 26.24 26.24 26.24 26.24<br />
Value Loss ( 2% ) 0.29 0.35 0.44 0.52 0.52 0.52 0.52 0.52 0.52 0.52<br />
Net Sales Revenue (Rs. Cr) 14.29 17.15 21.43 25.72 25.72 25.72 25.72 25.72 25.72 25.72<br />
146<br />
(Rs. Cr.)
Factory Related<br />
EXHIBIT 6.3<br />
REQUIREMENT <strong>OF</strong> WORKING CAPITAL<br />
ITEM NO. <strong>OF</strong> MARGIN YEAR I YEAR II YEAR III YEAR IV<br />
(Rs.Lakhs)<br />
YEAR V<br />
M<strong>ON</strong>THS (%) W.CAP MARGIN BANK W.CAP MARGIN BANK W.CAP MARGIN BANK W.CAP MARGIN BANK W.CAP MARGIN BANK<br />
REQMT M<strong>ON</strong>EY FINANCE REQMT M<strong>ON</strong>EY FINANCE REQMT M<strong>ON</strong>EY FINANCE REQMT M<strong>ON</strong>EY FINANCE REQMT M<strong>ON</strong>EY FINANCE<br />
Raw materials & other commodities 1.00 25.00 0.55 0.14 0.41 0.66 0.17 0.50 0.83 0.21 0.62 1.00 0.25 0.75 1.00 0.25 0.75<br />
Finished Goods 1.00 25.00 1.07 0.27 0.80 1.20 0.30 0.90 1.48 0.37 1.11 1.75 0.44 1.32 1.76 0.44 1.32<br />
A/c Receivable 1.00 25.00 1.19 0.30 0.89 1.43 0.36 1.07 1.79 0.45 1.34 2.14 0.54 1.61 2.14 0.54 1.61<br />
Cash in hand<br />
Salaries & wages 1.00 0.00 0.06 0.00 0.06 0.06 0.00 0.06 0.06 0.00 0.06 0.06 0.00 0.06 0.07 0.00 0.07<br />
Utilities 1.00 0.00 0.06 0.00 0.06 0.07 0.00 0.07 0.08 0.00 0.08 0.10 0.00 0.10 0.10 0.00 0.10<br />
Advertising & Promotional Expenses 1.00 0.00 0.30 0.00 0.30 0.36 0.00 0.36 0.45 0.00 0.45 0.54 0.00 0.54 0.54 0.00 0.54<br />
Admin. Overheads 1.00 0.00 0.05 0.00 0.05 0.05 0.00 0.05 0.05 0.00 0.05 0.05 0.00 0.05 0.05 0.00 0.05<br />
Total Requirement 3.23 0.70 2.53 3.79 0.82 2.96 4.70 1.02 3.67 5.60 1.22 4.38 5.61 1.22 4.38<br />
147
Factory Related<br />
EXHIBIT 6.3 (C<strong>ON</strong>TD...)<br />
REQUIREMENT <strong>OF</strong> WORKING CAPITAL<br />
ITEM NO. <strong>OF</strong> MARGIN YEAR VI YEAR VII YEAR VIII YEAR IX<br />
(Rs.Lakhs)<br />
YEAR X<br />
M<strong>ON</strong>THS (%) W.CAP MARGIN BANK W.CAP MARGIN BANK W.CAP MARGIN BANK W.CAP MARGIN BANK W.CAP MARGIN BANK<br />
REQMT M<strong>ON</strong>EY FINANCE REQMT M<strong>ON</strong>EY FINANCE REQMT M<strong>ON</strong>EY FINANCE REQMT M<strong>ON</strong>EY FINANCE REQMT M<strong>ON</strong>EY FINANCE<br />
Raw materials & other commodities 1.00 25.00 1.00 0.25 0.75 1.00 0.25 0.75 1.00 0.25 0.75 1.00 0.25 0.75 1.00 0.25 0.75<br />
Finished Goods Stock 1.00 25.00 1.76 0.44 1.32 1.77 0.44 1.33 1.77 0.44 1.33 1.78 0.45 1.34 1.79 0.45 1.34<br />
A/c Receivable 1.00 25.00 2.14 0.54 1.61 2.14 0.54 1.61 2.14 0.54 1.61 2.14 0.54 1.61 2.14 0.54 1.61<br />
Cash in hand<br />
Salaries & wages 1.00 0.00 0.07 0.00 0.07 0.08 0.00 0.08 0.09 0.00 0.09 0.09 0.00 0.09 0.10 0.00 0.10<br />
Utilities 1.00 0.00 0.00 0.00 0.00 0.00 0.00 0.00 0.00 0.00 0.00 0.00 0.00 0.00 0.00 0.00 0.00<br />
Advertising & Promotional Expenses 1.00 0.00 0.01 0.00 0.01 0.01 0.00 0.01 0.01 0.00 0.01 0.01 0.00 0.01 0.01 0.00 0.01<br />
Admin. Overheads 1.00 0.00 0.54 0.00 0.54 0.54 0.00 0.54 0.54 0.00 0.54 0.54 0.00 0.54 0.54 0.00 0.54<br />
Total Requirement 5.62 1.23 4.39 5.63 1.23 4.40 5.64 1.23 4.42 5.66 1.23 4.43 5.67 1.23 4.44<br />
148
148
Exhibit 6.3<br />
MANPOWER REQUIREMENTS<br />
Nos Monthly Total Monthly Salary Annual<br />
General Manager 1 30000 30000 360000<br />
Production Manager 1 20000 20000 240000<br />
Machine Operators 6 6000 36000 432000<br />
Machine Helper (Semi Skilled) 12 3000 36000 432000<br />
R&D, Testing 2 8000 16000 192000<br />
Marketing Manager & Sales Manager 2 25000 50000 600000<br />
Sales Representatives 12 12000 144000 1728000<br />
Clerical Staff 6 6000 36000 432000<br />
Other Staff 4 3000 12000 144000<br />
Maintenance (Elec. & Mech.) 2 10000 20000 240000<br />
TOTAL 48 400000 4800000<br />
Fringe Benefits (40 % of the above) 1920000<br />
Total Wage Bill (Annual) Rs. lakhs: Salary + Other Benefits = 6720000.00<br />
Total Wage Bill (Annual) Rs. Cr.: 0.672<br />
149
Exhibit 6.5<br />
PR<strong>OF</strong>ITABILITY STATEMENT AND COMPUTATI<strong>ON</strong> <strong>OF</strong> TAX<br />
(Rs.Cr)<br />
ACCOUNT HEAD FINANCIAL YEAR <strong>OF</strong> OPERATI<strong>ON</strong><br />
I II III IV V VI VII VIII IX X<br />
Revenue<br />
Net Sales Turnover 14.29 17.15 21.43 25.72 25.72 25.72 25.72 25.72 25.72 25.72<br />
Total Revenue 14.29 17.15 21.43 25.72 25.72 25.72 25.72 25.72 25.72 25.72<br />
Expenses<br />
Raw Materials 6.63 7.96 9.95 11.94 11.94 11.94 11.94 11.94 11.94 11.94<br />
Salaries & wages 0.67 0.71 0.74 0.78 0.82 0.88 0.95 1.03 1.11 1.20<br />
Conversion Costs 0.66 0.80 1.00 1.19 1.19 1.19 1.19 1.19 1.19 1.19<br />
Repairs & Maintenance 0.12 0.12 0.12 0.12 0.12 0.12 0.12 0.12 0.12 0.12<br />
Sales, Marketing & Training Expenses 3.57 4.29 5.36 6.43 6.43 6.43 6.43 6.43 6.43 6.43<br />
Factory & Office Overheads 0.58 0.58 0.58 0.58 0.58 0.58 0.58 0.58 0.58 0.58<br />
CVD 0.60 0.00 0.00 0.00 0.00 0.00 0.00 0.00 0.00 0.00<br />
Interest on S.T. Loans 0.28 0.33 0.40 0.48 0.48 0.48 0.48 0.49 0.49 0.49<br />
Cost of Sales 13.12 14.78 18.15 21.52 21.56 21.63 21.70 21.78 21.86 21.95<br />
Depreciation (St.Line) 0.42 0.42 0.42 0.42 0.42 0.42 0.42 0.42 0.42 0.42<br />
Amort. of Expenses 0.03 0.03 0.03 0.03 0.03 0.03 0.00 0.00 0.00 0.00<br />
Interest on L.T Loan 0.30 0.30 0.28 0.24 0.20 0.17 0.13 0.09 0.06 0.02<br />
Profit Before Tax 0.43 1.63 2.56 3.51 3.51 3.48 3.47 3.43 3.38 3.33<br />
Tax 0.04 0.17 0.60 1.09 1.15 1.19 1.23 1.24 1.25 1.24<br />
Profit After Tax 0.38 1.46 1.96 2.42 2.35 2.29 2.25 2.19 2.14 2.09<br />
Dividend 0.00 0.00 0.20 0.20 0.20 0.39 0.39 0.39 0.39 0.39<br />
Profits For Appropriation 0.38 1.46 1.77 2.22 2.16 1.89 1.85 1.80 1.75 1.69<br />
COMPUTATI<strong>ON</strong> <strong>OF</strong> TAX<br />
Profit after interest before depreciation 0.84 2.05 2.98 3.93 3.92 3.89 3.89 3.85 3.80 3.75<br />
Depr.(WDV) to be claimed 1.76 2.27 1.26 0.81 0.63 0.49 0.39 0.31 0.24 0.20<br />
Depreciation claimed 0.84 2.05 1.26 0.81 0.63 0.49 0.39 0.31 0.24 0.20<br />
Depr. carried forward 0.92 0.22 0.00 0.00 0.00 0.00 0.00 0.00 0.00 0.00<br />
Taxable Profit 0.00 0.00 1.71 3.12 3.29 3.40 3.50 3.54 3.56 3.55<br />
Profit Before Tax (Book) 0.43 1.63 2.56 3.51 3.51 3.48 3.47 3.43 3.38 3.33<br />
Minimum Alternate Tax 0.04 0.17 0.00 0.00 0.00 0.00 0.00 0.00 0.00 0.00<br />
Tax (Actual) 0.00 0.00 0.60 1.09 1.15 1.19 1.23 1.24 1.25 1.24<br />
Tax Provision 0.04 0.17 0.60 1.09 1.15 1.19 1.23 1.24 1.25 1.24<br />
150
EXHIBIT 6.6<br />
SENSITIVITY ANALYSIS<br />
Items Profit after Tax<br />
(PAT)<br />
Rs. Cr.<br />
( assumed at 90 %<br />
capacity )<br />
Break<br />
Even<br />
(%)<br />
Appendix – 5A (Contd…)<br />
Internal<br />
Rate of<br />
Return<br />
(IRR)<br />
(%)<br />
Payback<br />
Period<br />
(Years)<br />
NORMAL VALUES 2.42 75.98 21.82 4.42<br />
Debt Equity Ratios<br />
(a) 2:1<br />
(b) 1:1<br />
Increase in Project Cost<br />
by 10 %<br />
Selling Price @<br />
Rs. 2.00 / Napkin<br />
(Current Market Price:<br />
Rs 2 to 8 / napkin)<br />
Decrease in Raw<br />
Material Prices by 10%<br />
Increase in Raw<br />
Material Prices by 10%<br />
2.40<br />
2.44<br />
76.20<br />
75.65<br />
21.90<br />
21.69<br />
4.40<br />
4.45<br />
2.38 76.62 20.19 4.65<br />
6.53 55.10 51.24 2.29<br />
3.28 68.44 28.94 3.62<br />
1.91 85.38 14.28 5.90<br />
151
Appendix – 5A (Contd…)<br />
152
Appendix – 5A (Contd…)<br />
ANNEXURE I:<br />
INDIAN STANDARD SPECIFICATI<strong>ON</strong> (ISI)<br />
FOR SANITARY NAPKINS<br />
This Indian Standard (First Revision) was adopted by the Indian Standards Institution on 15<br />
February 1980, after the draft finalised by the Surgical Dressings Sectional Committee had been approved<br />
by the Consumer Products and Medical Instruments Division Council. This standard was first published in<br />
1969.<br />
1. Scope :<br />
1.1 This standard covers the requirements for sanitary napkins for external use.<br />
2. Materials :<br />
2.1 Absorbent Filler - The filler material, such as cellulose pulp, cellulose wadding,<br />
tissue, cotton, etc., shall be free from lumps, oil spots, dirt or foreign material.<br />
2.2. Covering - The covering of the absorbent filler shall be of a good quality cotton<br />
or rayon knitted sleeving, gauze or non-woven fabric with sufficient porosity to permit<br />
the assembled pad to meet the absorbency requirements. If cotton gauze is used, it shall<br />
conform to IS : 758-1975.<br />
3. Sizes :<br />
3.1 Sizes of sanitary napkins shall be as agreed to between the purchaser and the supplier. However<br />
recommended sizes are as follows :<br />
Size Pad Length (mm) Width (mm) Thickness (mm)<br />
Regular 200 + 20 60 to 75 15 + 2<br />
Large 240 + 20 60 to 75 15 + 2<br />
Extra Large 280 + 20 60 to 75 15 + 2<br />
153
Appendix – 5A (Contd…)<br />
3.1.1. The thickness shall be measured by stacking 10 complete pads and measuring the<br />
stack height. The average thickness for the 10 pads shall be used as the pad thickness.<br />
4. Manufacture, Workmanship and Finish :<br />
4.1 The absorbent filler shall be arranged and neatly cut to the required size of the pad and form a<br />
uniform thickness throughout without any wrinkles or distortion. It shall be placed in the covering in such a<br />
way that it does not cause lump formation with the effect of sudden pressure. The covering fabric shall<br />
cover the filler completely, and in case of napkins with tabs, extend beyond the length of the filler to form<br />
tabs or loops at each end for securing the paid in use. In case of tabless napkins, an adhesive system or<br />
other suitable method may be introduced for holding the napkin securely in position. The sanitary napkins<br />
shall have a non-absorbent barrier on one side which shall have an identifying thread or marking indicating<br />
clearly the side of the barrier. In case of napkins that are heat sterilizable, the barriers shall also be heat<br />
resistant.<br />
4.2. When the sanitary napkins are claimed as disposable, that it, disposable in<br />
lavatories, they shall be manufactured from disposable material. If cotton hose or gauze<br />
is used as covering, the instructions for the use of napkins shall clearly indicate that the<br />
non-absorbent barrier should be removed before flushing.<br />
4.3 The sanitary napkins shall have a very soft feel and when worn shall not chafe or<br />
give any uncomfortable feeling. They shall be free from all sorts of foreign matter.<br />
5. Requirements :<br />
5.1 Absorbency and ability to withstand pressure after absorption - The sanitary<br />
napkins shall absorb 30 ml of coloured water or oxalated sheep or goat blood or test fluid<br />
when flowed on to the centre of the napkin )at the rate of 15 ml per minute) and it shall<br />
not show up at the bottom or sides of the sanitary napkin, when tested according to<br />
Appendix A.<br />
5.1.1 The tabless napkins shall absorb 20 ml of coloured water or oxalated sheep or goat<br />
blood or test fluid when tested by the method given in 5.1.<br />
5.2 Disposability - A disposable sanitary napkin with the covering removed, shall be<br />
immersed in 15 litres of water and stirred. The pad shall disintegrate in the water in not<br />
more than 5 minutes.<br />
5.3 pH Value - The sanitary napkins shall be free from acids and alkali and the pH of<br />
the absorbent material shall be 6 to 8.5 when tested by the method given in IS : 1390 -<br />
1961.<br />
154
Appendix – 5A (Contd…)<br />
5.4 Instructions - Following instructions shall be included in every packet of sanitary<br />
napkins :<br />
6. Tests :<br />
a) Method of use;<br />
b) Indication as to which side is absorbent; and<br />
c) Disposal instructions, such as that the napkins without covering can be<br />
disposed off in water closets.<br />
6.1 Absorbency and ability to withstand pressure after absorption shall be tested as<br />
given in Appendix A.<br />
6.1.1 Type Test : Use oxalated sheep or goat blood or test fluid.<br />
6.1.2 Routine Test - Use coloured water.<br />
7. Packing :<br />
7.1 Sanitary napkins shall be packed in polyethylene lined carton or polyethylene bag.<br />
The carton shall contain an instruction leaflet or shall have the instructions printed on the<br />
outside of the polyethylene bag or carton.<br />
8. Marking :<br />
8.1 Each carton shall be marked with the manufacturer’s name or trade mark, the<br />
number of sanitary napkins contained in it, and size designation.<br />
8.1.1 The carton may also be marked with ISI Certification Mark.<br />
155
APPENDIX A<br />
(Clauses 5.1 and 6.1)<br />
Appendix – 5A (Contd…)<br />
METHOD FOR DETERMINATI<strong>ON</strong> <strong>OF</strong> ABSORBENCY AND ABILITY<br />
A-1. Procedure :-<br />
TO WITHSTAND PRESSURE AFTER ABSORPTI<strong>ON</strong><br />
A-1.1 Test Fluid - To about 6 1 of boiling water in a 10 1 stainless steel or glass<br />
vessel add 4 g of methyl paraben and stir until dissolved. Add 740g of the gum arabic or<br />
gum acacia and stir until all the gum is dissolved. Add water to make 8.05 1 and allow<br />
the solution to stand for at least 24 hours. Filter through a layer of glass wool. Add 9 g<br />
of methylene blue, 1 470 ml of glycerine, and 840 ml of water and stir. The total volume<br />
will be approximately 9.2 1. Mix thoroughly and allow to stand at least for 24 hours.<br />
Shake before use.<br />
A-1.2 Lay the sanitary napkin on a flat level transparent surface, so that the underside of<br />
the sanitary napkin can be observed. Drip, at the rate of 15 ml per minute, 30 ml (20 ml<br />
for tabless napkins) of the fluid maintained at a temperature of 27 0 + 2 0 C on to the<br />
centre of the sanitary napkin from a height of approximately 1 to 2 mm. After the napkin<br />
has absorbed the full amount of fluid, keep a standard weight of 1 kg for one minute on<br />
the portion where the fluid was absorbed. Observed the back and sides of the sanitary<br />
napkin for any fluid showing up.<br />
156
Appendix – 5A (Contd…)<br />
INC<strong>ON</strong>TINENCE (ADULT) DIAPERS (C<strong>ON</strong>VERTING LINE)<br />
SECTI<strong>ON</strong>-I : PRODUCT BRIEF, APPLICATI<strong>ON</strong> AREAS AND MARKET<br />
Incontinence Diapers:<br />
POTENTIAL<br />
7.1 Incontinence is defined as the inability to exercise control over the bladder<br />
resulting in urinary leakage, a condition most often associated with the elderly.<br />
7.2 Incontinence Diapers are absorbent disposable single use products designed to<br />
receive, absorb and retain body fluids. The use of the Diapers is hygienic as the diapers<br />
can avoid the fungal infection of the skin since the aggressive substance present in the<br />
urine does not come in contact with the skin. They are required to provide these functions<br />
without skin irritation or leakage and in a manner that allows the user to effectively<br />
manage their incontinence.<br />
7.3 The diapers are made of cellulose with super absorbent material and cotton<br />
having poly backsheet and a nonwoven coverstock. They are expected to be effective in<br />
quickly absorbing and retaining waste, at the same time being discreet and indiscernible<br />
to the public.<br />
The primary requirements of these products are:<br />
Absorb and retain urine during miction and distribute the urine throughout the<br />
absorption pad,<br />
• Retain urine effectively in the absorbent core,<br />
• Isolate wetness from the skin,<br />
• Reduce potential odour problems caused by urine degradation<br />
The important / desired properties of Incontinence Diapers are:<br />
• Maximum wearer comfort,<br />
• Simplicity - Easy to use and put on / take off,<br />
• Low noise factor,<br />
• Good Product fit,<br />
• Good level of discreteness with the product,<br />
• Hygienic<br />
157
Appendix – 5A (Contd…)<br />
7.4 The product is consumed in the following institutions, apart from the retail sale<br />
directly to the senior citizens:<br />
• Nursing Homes • MR Facilities<br />
• Hospitals • (mentally challenged<br />
individuals)<br />
• Home Care Providers • Pediatric Facilities<br />
• Prisons/Correctional Facilities • Private Homes<br />
• Retirement Centres • Day Care Centres<br />
7.5 The purchases in these institutions is mainly triggered by cost issues and the end<br />
users care more about the comfort and wellness than tricks and frills.<br />
Emerging Market Potential - Global and Indian<br />
Incontinence (Adult) Diapers:<br />
Global Incontinence Market:<br />
7.6 The adult incontinence market in the US is over $1.1 bn with approximately 19mn<br />
North Americans who are incontinent. The nonwoven coverstock consumption by the<br />
adult incontinence products is approximately 14%. The World Bank has estimated that<br />
the US population between ages 50 to 59 will increase from nearly 25 mn (1995) to 41<br />
mn (2010), while 60 to 69 age group is expected to increase from 20 mn (1995) to 29 mn<br />
(2010).<br />
7.7 EDANA estimates the total West European market to be of 5.2 bn diapers ( 2001<br />
data).<br />
7.8 Among the baby boomer generation in US, one adult turns 50 every 8 seconds, a<br />
total of 1000 a day, hence the market for these products will continue to grow.<br />
Indian Incontinence (Adult) Diapers:<br />
7.9 TECS has adopted a two-pronged approach for assessing the Incontinence<br />
Diapers market in India, that of Retailer & Hospital Survey and Industry Feedback,<br />
supplemented through Internet research and data scan from secondary sources.<br />
7.10 The industry feed back from the established players reveal that the estimated<br />
Indian market for Incontinence Diapers is around Rs. 20 crore (2001-02).<br />
158
Year S – I S - II Avg I. D. Nonwoven demand<br />
(tonnes)<br />
Appendix – 5A (Contd…)<br />
Average NW<br />
(Rs. Cr.) (Rs. Cr.) (Rs. Cr.) S - I S - II con. (tonnes)<br />
2001 - 02 20.00 20.00 20.00 Rs. 0.36 Cr. Rs. 0.36 Cr. Rs. 0.36 Cr.<br />
(3.50) (3.50) (3.50) (32.97) (32.97) (32.97)<br />
2003 - 04 22.05 85.86 53.96 Rs. 0.38 Cr. Rs. 1.48 Cr. Rs. 0.93 Cr.<br />
(3.68) (14.31) (8.99) (34.62) (134.80) (84.71)<br />
2007 - 08 26.80 243.35 135.07 Rs. 0.46 Cr. Rs. 4.20 Cr. Rs. 2.33 Cr.<br />
(4.47) (40.56) (22.51) (42.08) (382.05) (212.07)<br />
Figs in brackets denote vol in mn pcs<br />
* Demand projections are subject to Market Realisation<br />
S - I : Normative Approach (Based on Industry Feedback<br />
S - II : Increase Penetration of the product from current levels to 0.75% (2003-04) and<br />
2% (2007-08)<br />
SECTI<strong>ON</strong> II : DIAPERS MANUFACTURING TECHNOLOGY AND<br />
EQUIPMENTS SUPPLIERS<br />
Process Description:<br />
7.11 The main raw material is cellulose pulp in rolls. The fluffing system is obtained<br />
through a hammer mill inside an asonic cabin which reduces the noise. The entry of the<br />
pulp rolls is regulated by a speed variator so does the weight. A super-absorbent powder<br />
is applied at this stage on the fluffed pulp.<br />
7.12 The combined fluff mat ribbon overwrapped by the tissue is transported to an<br />
embossing unit through a conveyor belt. Then the mat is cut by a rotary die and the<br />
resulting pad obtained is spaced and top formed by a non woven fabric covering, while<br />
the bottom will be formed by a PVC sheet. A unit composed by a set of rotary cutting<br />
knives provide to cut the diapers and the PVC with the non woven, while a continuous<br />
suction system provides the removal of the cutting waste. In this part of the machine there<br />
is an applicator to fix the elastic in the leg region. Other applicators can operate according<br />
to the type and quality of the diapers desired applying the frontal tapes, the faecal barrier<br />
and eventually elastic waist-band. Adhesive labels type velcro are applied in order to fix<br />
the waist-line of the diaper.<br />
159
Appendix – 5A (Contd…)<br />
7.13 A sealing system seals the ends of the diapers, after the final cut. The finished<br />
diapers are then conveyed to a transversal final folding group which has the capacity to<br />
half-fold or three-fold the diapers by means of belts and cams.<br />
7.14 An automatic counter and packer unit is receiving the finished folded product, and<br />
discharges stacks of diapers pre-counted in a funnel where the operator has to insert a<br />
poly bag or cardboard box for the final packing.<br />
Machinery (Technology & Equipment) Suppliers and Specifications:<br />
7.15 Globally, the well known technology suppliers with proven track record for<br />
Diapers contacted by TECS are:<br />
• M. D. Viola (Italy),<br />
• Diatec SRL (Italy),<br />
• Sanimac (Italy),<br />
• Rainbow Fame (Taiwan),<br />
• Caldiroli (Italy),<br />
• BHT Bicma (Germany),<br />
• Fameccanica (Italy).<br />
Note : The list contains the leading global players in manufacturing Incontinence and Baby<br />
Diapers and based on discussion with Industry experts the above list is exhaustive.<br />
7.16 TECS has received favourable responses and indicative quotations.<br />
Process Systems and Equipments<br />
• The machinery required for the manufacturing of the Incontinence Diapers is as<br />
follows:<br />
o Raw Material Unwinder (Pulp, Nonwovens, Poly, Tissue Paper),<br />
o Pulp Grinding,<br />
o Fluff Drum Forming System,<br />
o Fluff Processing,<br />
o SAP Applicator,<br />
o Fluted Elastic Waist Band Applicator,<br />
o Fluff Leg Cuff Applicator,<br />
o Hot Melt Glue Applicator,<br />
o Tape Detector,<br />
160
o Three Folding System,<br />
o Compression Unit,<br />
o Poly Cutting System,<br />
o Stacker<br />
Recommended Minimum Economic Size:<br />
Appendix – 5A (Contd…)<br />
7.17 The Incontinence Diapers project proposed to be set up in India will have a<br />
designed capacity of 200 diapers per min.<br />
7.18 Under Indian operating conditions it is safer to assume machine efficiency factor<br />
of 75%, and therefore the production would be 150 diapers per min (Incontinence<br />
Diapers)<br />
7.19 The plant would operate in three shifts, 24 hours and 300 working days in a year.<br />
7.20 These converting lines mentioned above are dedicated for incontinence and baby<br />
diapers only.<br />
Investment in Process Plant and Machinery.<br />
7.21 The investment in the process plant and machinery for Incontinence Diapers<br />
will be Rs 7.63 crores (FOB) after a discount of 15%. Finer details on the Equipment<br />
listing, specification and the quotations need to be discussed with the technology supplier<br />
before the project is taken up. Taking into account the CIF value, the custom duties (5%),<br />
CVD (16%), inland transportation and loading / unloading (2%), erection and<br />
commissioning (5%), the installed cost of process equipment would be Rs 10.15<br />
crores.<br />
SECTI<strong>ON</strong> III : INC<strong>ON</strong>TINENCE DIAPERS : PROJECT COST AND<br />
FINANCIALS<br />
Land<br />
7.22 The total requirement of Land for this project keeping in mind the possible future<br />
expansion is around 6069 sq. mtrs. ( 1.5 acres ).<br />
7.23 Based on the available information, the cost of land is assumed at Rs 1200 per<br />
square meter (including the developmental cost ). Depending on the exact location of the<br />
project to be determined by the promoter the land cost could be higher or lower. Hence<br />
161
the total cost of developed land will be Rs 0.73 crores (Rs 73 lakhs).<br />
Buildings<br />
Appendix – 5A (Contd…)<br />
7.24 The building area comprising of main factory building, godowns, office , R & D<br />
labs / In-house Testing centre etc. would be 3500 sq. mtrs. The cost of construction<br />
would again vary depending on the structure and the materials to be used. It has been<br />
assumed that the average cost of construction would be Rs 4500 per sq. mtr. Thus the<br />
total cost of building and other civil works would be around Rs 1.58 crores.<br />
Plant and Machinery<br />
7.25 Details of Plant and machinery as well as technology required for the project have<br />
been presented in earlier Section II . The installed cost of plant and machinery would be<br />
Rs 10.15 crores.<br />
7.26 Apart from the main process equipments the utilities required are<br />
• Electricals,<br />
• Piping,<br />
• Water supply,<br />
• Compressors,<br />
• Fire fighting equipments<br />
7.27 The provision on this count is taken as 5 % of the cost of machinery which works<br />
out to Rs 0.51 crores (Rs 51 lakhs).<br />
Miscellaneous Fixed Assets<br />
7.28 Under this head the items included are Furniture and fixtures, Office equipments,<br />
Air Conditioners etc. and the provision made is around Rs 0.15 crores (Rs 15 lakhs),<br />
inclusive of the testing and R&D facilities.<br />
Testing Facilities<br />
7.29 The Incontinence Diapers unit calls for Tensile Strength testing, Burst Strength<br />
testing for Corrugated Boxes, Dancing Doll (which has its legs moving to mimic the<br />
walking effects of the adult). A provision of around Rs 0.15 crore (Rs 15 lakhs) is made<br />
on this count.<br />
162
Project Engineering and Consulting<br />
Appendix – 5A (Contd…)<br />
7.30 Under this head the items included are the fees and expenses on account of<br />
Architect fees, project engineering and management (both local and overseas ), detailed<br />
project reports, etc. The total expenses under this head may be taken as 2.5% of the total<br />
machinery and civil assets cost.<br />
Preliminary & Preoperative Expenses<br />
7.31 The items included under this head are company formation expenses, public issue<br />
expenses (if any ), interest during construction, pre production expenses during the<br />
implementation phase etc.<br />
Contingency Expenses<br />
7.32 Depending on the gestation period and further detailing of the project cost by the<br />
promoter, the contingency provision has been made at the rate of 10%.<br />
Margin Money for Working capital<br />
7.33 The margin money for working capital forming part of the total project cost would<br />
be Rs 2.28 Crores .[Exhibit 7.3]<br />
Total Project Cost (Total Investment)<br />
7.34 The total project cost as given in Exhibit 7.1 would be Rs 18.93 crores.<br />
Project Funding and Financing Pattern:<br />
7.35 It has been assumed that the project would be financed through long term funds<br />
and Equity participation by the Promoter / Public. The technical textile sector being a<br />
high priority area , it is assumed that a Debt- Equity ratio of 1.5 : 1 would be feasible.<br />
(However the sensitivity analysis has also been presented for 1 : 1 and 2 : 1 Debt Equity<br />
ratios.)<br />
Sales , Profitability and Sensitivity Analysis:<br />
Sales Realisation and Turnover<br />
7.36 As per the details available from the Technology and Equipment suppliers the<br />
economic size of a plant is 200 adult diapers per min.<br />
163
Appendix – 5A (Contd…)<br />
7.37 Under the Indian conditions, it is assumed that the machine would operate at an<br />
efficiency level of 75%. Hence the production from the plant would be 150 adult diapers<br />
per min.<br />
7.38 The plant would operate on Three-shift basis and 300 workings days in a year.<br />
The capacity utilisation for the 1st year is assumed at 50% and thereafter for the 2nd, 3rd<br />
and 4th year onwards 60%, 75% and 90% respectively.<br />
7.39 The average selling price of the end product would be Rs 15 per adult diaper (net<br />
of excise duties, sales tax and other incidental expenses). The adult diapers sold in the<br />
Indian market at Rs 45 - 80 per piece. The finished products are exempt from excise duty.<br />
The players sell the imported and repacked diapers in the Indian market. The international<br />
price of the incontinence diapers is Rs 80 per piece. On this the import duty, margins etc.<br />
get added.<br />
7.40 The details of projected sales turnover are given in Exhibit 7.2.<br />
Cost of Production<br />
Major Raw materials and their specifications:<br />
7.41 The main raw materials used and the corresponding prevailing prices as an<br />
indicator are as follows:<br />
Raw Material Prices<br />
Landed cost<br />
(inclusive of all duties)<br />
Nonwoven for topsheet and cuffs Rs. 90 per kg Rs. 110 per kg<br />
Wood Pulp Core (Fluff) Rs. 30 per kg Rs. 35 per kg<br />
Super Absorbent Polymer Rs. 70 per kg Rs. 110 per kg<br />
Hot Melt Glue Rs. 150 per kg Rs. 300 per kg<br />
7.42 Apart from the above, other materials also form a part of the napkins like those mentioned below:<br />
• Acquisition layer,<br />
• Tissue,<br />
• Poly Backsheet,<br />
• Leg Elastic<br />
• Elastic Cuffs,<br />
7.43 Wood Pulp Core (Fluff) and Nonwoven account for around 85% of the total cost and weight of the<br />
incontinence diapers raw materials.<br />
7.44 The nonwoven in the gsm range of 20-22 gsm is used.<br />
164
7.45 The leading suppliers of the incontinence diapers raw materials are:<br />
Conversion Cost<br />
Appendix – 5A (Contd…)<br />
• Wood Pulp Core (Fluff): Georgia Pacific, Buckeye, Cellulose Corporation<br />
Weyerhaeuser, Tartas S.A., Cellu Tissue Corporation,<br />
• Nonwoven or Perforated Poly: Amoco Fabrics Division, Fabriano Soft S.r.l.,<br />
Tenotex S.p.a., Pantex Group<br />
7.46 The conversion cost will include the cost of power, water , other utility items ,<br />
chemicals and additives, consumables etc. which is assumed at 10% of the cost of raw<br />
material.<br />
Manpower, Salaries and Wages<br />
7.47 The manpower requirements and the salary structure is given in Exhibit 7.4.<br />
7.48 The total manpower requirement comprising the managerial cadre of supervisors,<br />
machine operators and helpers would be 48 persons. The wage bill for the conversion<br />
unit would be Rs 0.67 crores.<br />
Factory and Overhead Expenses<br />
7.49 The items covered under this head are establishment expenses, repairs and<br />
maintenance, stationery, travel expenses, packaging expenses etc.<br />
Marketing and Promotional Expenses<br />
7.50 The promotion of technical textiles will call for expenditure on this count and a<br />
provision of 25% of the annual sales has been made uniformly over the years.<br />
7.51 This provision includes the margins to the distributors and the retailers, along with<br />
heavy advertising and promotional expenses. The entrepreneur will have to undertake<br />
massive promotional campaigns to educate the public about the product, its benefits,<br />
usage patterns, availability etc. These efforts would be required due to the lack of<br />
awareness among the general public about these products.<br />
165
Interest and Depreciation<br />
Appendix – 5A (Contd…)<br />
7.52 The prevailing interest rate for long term and short term borrowed funds is<br />
assumed at 5% and 11% per annum as it is covered under Technology Upgradation Fund<br />
(TUF).<br />
7.53 The repayment of loans has been assumed for 10 years with a moratorium period<br />
of two years (2+8).<br />
7.54 The depreciation rates have been worked out as per Company’s act (SLM) and<br />
Income-Tax Ready Reckoner (WDV).<br />
7.55 The current corporate tax rate is assumed at 35% and the surcharge is assumed at 2.5% per annum.<br />
Profitability, Break-even, IRR, DSCR and Payback<br />
7.56 As presented in Exhibit 7.5, the sales turnover increases from Rs 47.63 crores in<br />
the first year to Rs 85.73 crores from the 4th year.<br />
7.57 The PBT increases from Rs 5.17 crores in the first year to Rs 15.12 crore from<br />
the fourth year onwards.<br />
7.58 The Break Even of the project is at 66.18%.<br />
7.59 The Internal Rate of Return ( IRR ) has been worked out at 42.44%.<br />
7.60 The Payback period for the project is 2.74 years.<br />
Sensitivity Analysis<br />
7.61 The sensitivity analysis has been presented in the Exhibit 7.6.<br />
OPTI<strong>ON</strong> II<br />
7.62 This option presents the choice of the cheaper machine (Chinese make) with an<br />
installed cost in the process plant and machinery of Rs 3.33 lakhs. The total project cost<br />
would be Rs 8.77 crores.<br />
7.63 The designed capacity of the machine is for 100 diapers per min<br />
7.64 The projected sales turnover for the adult diaper unit is shown in Exhibit 7.7.<br />
166
Profitability, Break-even, RR, DSCR and Payback<br />
Appendix – 5A (Contd…)<br />
7.65 As presented in Exhibit 7.8, the sales turnover increases from Rs 23.81 crores in<br />
the first year to Rs 42.87 crores from the 4th year onwards.<br />
7.66 The PBT increases from Rs 2.61 crores in the first year to Rs 7.30 crores in the<br />
fourth year.<br />
7.67 The Break Even of the project is at 66.33%.<br />
7.68 The Internal Rate of Return ( IRR ) has been worked out at 42.76%.<br />
7.69 The Payback period for the project is 2.75 years.<br />
COMPARISI<strong>ON</strong> <strong>OF</strong> ALTERNATE TECHNOLOGIES<br />
Technology Particulars Option - I<br />
Incontinence Diapers Project<br />
European Technology<br />
Option - II<br />
Local / Chinese Technology<br />
Capacity 200 Diapers per min 100 Diapers per min<br />
Project Cost Rs. 18.93 Cr Rs. 8.77 Cr.<br />
Revenue (1st year) Rs. 47.63 Cr. Rs. 23.81 Cr.<br />
BEP 66.18% 66.33%<br />
IRR 42.44% 42.76%<br />
Payback 2.74 years 2.75 years<br />
DEVELOPMENTAL AND PROMOTI<strong>ON</strong>AL MEASURES<br />
7.70 Within Europe these incontinence products are classified as Medical Devices<br />
Class 1 and their manufacture and control are required to follow the requirements set out<br />
in the European Council Directive 93/42/EEC 14 June 1993. Similar arrangements are<br />
in place in the US too. Even in India such measures can be introduced for the diapers.<br />
7.71 Prevailing duty structure on the following products needs revision for the<br />
promotion of this sector and even be competitive in the export market.<br />
167
Item Prevailing Duty<br />
Structure<br />
Appendix – 5A (Contd…)<br />
Recommended<br />
Duty Structure<br />
Wood Pulp 5% (BCD) + 4% (CVD) Total Duty : 5%<br />
NonWovens 20% (BCD) + 16% (CVD) +<br />
0.5% (Textile Cess)<br />
Total Duty : 10%<br />
SAP 20% (BCD) + 16% (CVD) Total Duty : 10%<br />
Hot Melt Glue 20% (BCD) + 16% (CVD) Total Duty : 10%<br />
7.72 The penetration level of the incontinence diapers even in the urban regions is very low. This is due<br />
to lack of awareness of the hygienic aspects of the product coupled with the unaffordability of the diapers.<br />
7.73 To increase the penetration levels from the current dismal state, following<br />
steps need to be taken:<br />
• Awareness creation campaigns and promotional efforts,<br />
• Duty reduction on raw materials.<br />
• Distribution of the incontinence diapers through the Public Distribution<br />
System (PDS),<br />
7.74 Increased education and marketing efforts would allow incontinent adults to feel<br />
more comfortable using this product.<br />
7.75 The Incontinence Diapers should now enter a “consumer style market” with TV<br />
commercials increasing the awareness of the product.<br />
168
Exhibit 7.1<br />
PROJECT COST<br />
(LAND, BUILDINGS, PROCESS PLANT & MACHINERY, UTILITIES & O<strong>THE</strong>R ASSETS)<br />
Project Cost (Rs. Cr.)<br />
1 Land 0.73<br />
Area: 1.5 acres ( 6069 Sq Mtrs)<br />
Rate: (Rs.1200 /Sq. Mtr)<br />
2 Buildings 1.58<br />
(Plant Area, Office, Godown, Lab, Service Area etc.)<br />
Built-up Area : 3500 Sq. Mtrs<br />
Avg Rate : Rs.4500 /Sq. Mtrs<br />
3 Process Plant & Equipment 10.15<br />
4 Utility & Other equipments (5%) 0.51<br />
(Power, Water, Compressor, Humidity Control,<br />
Fire Fighting, Material Handling etc.)<br />
5 Misc. Fixed Assets 0.15<br />
(Furniture & Fixtures, Office Equipment, Testing Lab etc.)<br />
6 Testing Equipments 0.15<br />
7 Project Engineering & Consultancy charges (2.5%) 0.31<br />
8 Preliminary & Pre-operative Expenses (12%) 1.56<br />
(Company Formation, Interest during construction,<br />
pre-production expenses, etc.)<br />
9 Contingency (10 %) 1.51<br />
10 Total 16.65<br />
11 Margin Money for Working Capital 2.28<br />
12 Total Project Cost 18.93<br />
169
Exhibit 7.2<br />
ESTIMATI<strong>ON</strong> <strong>OF</strong> SALES REVENUE<br />
ITEM YEAR <strong>OF</strong> OPERATI<strong>ON</strong><br />
I II III IV V VI VII VIII IX X<br />
Designed Capacity per min 200 200 200 200 200 200 200 200 200 200<br />
75% efficiency 150 150 150 150 150 150 150 150 150 150<br />
Capacity Utilisation 50% 60% 75% 90% 90% 90% 90% 90% 90% 90%<br />
Actual Production per min (pcs) 75 90 113 135 135 135 135 135 135 135<br />
Actual Production per hr (pcs) 4500 5400 6750 8100 8100 8100 8100 8100 8100 8100<br />
Production per day (pcs) 108000 129600 162000 194400 194400 194400 194400 194400 194400 194400<br />
Production for 300 working days (pcs) 32400000 38880000 48600000 58320000 58320000 58320000 58320000 58320000 58320000 58320000<br />
Selling Price (Rs / diaper) 15.00 15.00 15.00 15.00 15.00 15.00 15.00 15.00 15.00 15.00<br />
Sales Revenue (Rs. Cr) 48.60 58.32 72.90 87.48 87.48 87.48 87.48 87.48 87.48 87.48<br />
Value Loss ( 2% ) 0.97 1.17 1.46 1.75 1.75 1.75 1.75 1.75 1.75 1.75<br />
Net Sales Revenue (Rs. Cr) 47.63 57.15 71.44 85.73 85.73 85.73 85.73 85.73 85.73 85.73<br />
170<br />
(Rs. Cr.)
Factory Related<br />
EXHIBIT 7.3<br />
REQUIREMENT <strong>OF</strong> WORKING CAPITAL<br />
ITEM NO. <strong>OF</strong> MARGIN YEAR I YEAR II YEAR III YEAR IV<br />
(Rs.Lakhs)<br />
YEAR V<br />
M<strong>ON</strong>THS (%) W.CAP MARGIN BANK W.CAP MARGIN BANK W.CAP MARGIN BANK W.CAP MARGIN BANK W.CAP MARGIN BANK<br />
REQMT M<strong>ON</strong>EY FINANCE REQMT M<strong>ON</strong>EY FINANCE REQMT M<strong>ON</strong>EY FINANCE REQMT M<strong>ON</strong>EY FINANCE REQMT M<strong>ON</strong>EY FINANCE<br />
Raw materials & other commodities 1.00 25.00 1.82 0.46 1.37 2.19 0.55 1.64 2.73 0.68 2.05 3.28 0.82 2.46 3.28 0.82 2.46<br />
Finished Goods 1.00 25.00 3.35 0.84 2.51 3.84 0.96 2.88 4.74 1.19 3.56 5.64 1.41 4.23 5.65 1.41 4.23<br />
A/c Receivable 1.00 25.00 3.97 0.99 2.98 4.76 1.19 3.57 5.95 1.49 4.47 7.14 1.79 5.36 7.14 1.79 5.36<br />
Cash in hand<br />
Salaries & wages 1.00 0.00 0.06 0.00 0.06 0.06 0.00 0.06 0.06 0.00 0.06 0.06 0.00 0.06 0.07 0.00 0.07<br />
Utilities 1.00 0.00 0.18 0.00 0.18 0.22 0.00 0.22 0.27 0.00 0.27 0.33 0.00 0.33 0.33 0.00 0.33<br />
Advertising & Promotional Expenses 1.00 0.00 0.99 0.00 0.99 1.19 0.00 1.19 1.49 0.00 1.49 1.79 0.00 1.79 1.79 0.00 1.79<br />
Admin. Overheads 1.00 0.00 0.16 0.00 0.16 0.16 0.00 0.16 0.16 0.00 0.16 0.16 0.00 0.16 0.16 0.00 0.16<br />
Total Requirement 10.39 2.28 8.10 12.28 2.70 9.58 15.27 3.36 11.92 18.27 4.02 14.25 18.28 4.02 14.26<br />
171
Factory Related<br />
EXHIBIT 7.3 (C<strong>ON</strong>TD...)<br />
REQUIREMENT <strong>OF</strong> WORKING CAPITAL<br />
ITEM NO. <strong>OF</strong> MARGIN YEAR VI YEAR VII YEAR VIII YEAR IX<br />
(Rs.Lakhs)<br />
YEAR X<br />
M<strong>ON</strong>THS (%) W.CAP MARGIN BANK W.CAP MARGIN BANK W.CAP MARGIN BANK W.CAP MARGIN BANK W.CAP MARGIN BANK<br />
REQMT M<strong>ON</strong>EY FINANCE REQMT M<strong>ON</strong>EY FINANCE REQMT M<strong>ON</strong>EY FINANCE REQMT M<strong>ON</strong>EY FINANCE REQMT M<strong>ON</strong>EY FINANCE<br />
Raw materials & other commodities 1.00 25.00 3.28 0.82 2.46 3.28 0.82 2.46 3.28 0.82 2.46 3.28 0.82 2.46 3.28 0.82 2.46<br />
Finished Goods Stock 1.00 25.00 5.65 1.41 4.24 5.66 1.41 4.24 5.66 1.42 4.25 5.67 1.42 4.25 5.68 1.42 4.26<br />
A/c Receivable 1.00 25.00 7.14 1.79 5.36 7.14 1.79 5.36 7.14 1.79 5.36 7.14 1.79 5.36 7.14 1.79 5.36<br />
Cash in hand<br />
Salaries & wages 1.00 0.00 0.07 0.00 0.07 0.08 0.00 0.08 0.09 0.00 0.09 0.09 0.00 0.09 0.10 0.00 0.10<br />
Utilities 1.00 0.00 0.00 0.00 0.00 0.00 0.00 0.00 0.00 0.00 0.00 0.00 0.00 0.00 0.00 0.00 0.00<br />
Advertising & Promotional Expenses 1.00 0.00 0.02 0.00 0.02 0.02 0.00 0.02 0.02 0.00 0.02 0.02 0.00 0.02 0.02 0.00 0.02<br />
Admin. Overheads 1.00 0.00 1.79 0.00 1.79 1.79 0.00 1.79 1.79 0.00 1.79 1.79 0.00 1.79 1.79 0.00 1.79<br />
Total Requirement 18.29 4.02 14.27 18.30 4.02 14.28 18.31 4.02 14.29 18.32 4.02 14.30 18.34 4.03 14.31<br />
172
Exhibit 7.4<br />
MANPOWER REQUIREMENTS<br />
Nos Monthly Total Monthly Salary Annual<br />
General Manager 1 30000 30000 360000<br />
Production Manager 1 20000 20000 240000<br />
Machine Operators 6 6000 36000 432000<br />
Machine Helper (Semi Skilled) 12 3000 36000 432000<br />
R&D, Testing 2 8000 16000 192000<br />
Marketing Manager & Sales Manager 2 25000 50000 600000<br />
Sales Representatives 12 12000 144000 1728000<br />
Clerical Staff 6 6000 36000 432000<br />
Other Staff 4 3000 12000 144000<br />
Maintenance (Elec. & Mech.) 2 10000 20000 240000<br />
TOTAL 48 400000 4800000<br />
Fringe Benefits (40 % of the above) 1920000<br />
Total Wage Bill (Annual) Rs. lakhs: Salary + Other Benefits = 6720000.00<br />
Total Wage Bill (Annual) Rs. Cr.: 0.672<br />
173
Exhibit 7.5<br />
PR<strong>OF</strong>ITABILITY STATEMENT AND COMPUTATI<strong>ON</strong> <strong>OF</strong> TAX<br />
(Rs.Cr)<br />
ACCOUNT HEAD FINANCIAL YEAR <strong>OF</strong> OPERATI<strong>ON</strong><br />
I II III IV V VI VII VIII IX X<br />
Revenue<br />
Net Sales Turnover 47.63 57.15 71.44 85.73 85.73 85.73 85.73 85.73 85.73 85.73<br />
Total Revenue 47.63 57.15 71.44 85.73 85.73 85.73 85.73 85.73 85.73 85.73<br />
Expenses<br />
Raw Materials 21.87 26.25 32.81 39.37 39.37 39.37 39.37 39.37 39.37 39.37<br />
Salaries & wages 0.67 0.71 0.74 0.78 0.82 0.88 0.95 1.03 1.11 1.20<br />
Conversion Costs 2.19 2.62 3.28 3.94 3.94 3.94 3.94 3.94 3.94 3.94<br />
Repairs & Maintenance 0.25 0.25 0.25 0.25 0.25 0.25 0.25 0.25 0.25 0.25<br />
Sales, Marketing & Training Expenses 11.91 14.29 17.86 21.43 21.43 21.43 21.43 21.43 21.43 21.43<br />
Factory & Office Overheads 1.94 1.94 1.94 1.94 1.94 1.94 1.94 1.94 1.94 1.94<br />
CVD 1.31 0.00 0.00 0.00 0.00 0.00 0.00 0.00 0.00 0.00<br />
Interest on S.T. Loans 0.89 1.05 1.31 1.57 1.57 1.57 1.57 1.57 1.57 1.57<br />
Cost of Sales 41.04 47.12 58.20 69.29 69.33 69.39 69.47 69.54 69.63 69.72<br />
Depreciation (St.Line) 0.80 0.80 0.80 0.80 0.80 0.80 0.80 0.80 0.80 0.80<br />
Amort. of Expenses 0.05 0.05 0.05 0.05 0.05 0.05 0.00 0.00 0.00 0.00<br />
Interest on L.T Loan 0.57 0.57 0.53 0.46 0.39 0.32 0.25 0.18 0.11 0.04<br />
Profit Before Tax 5.17 8.61 11.85 15.12 15.16 15.16 15.21 15.21 15.19 15.17<br />
Tax 0.86 2.36 3.71 5.03 5.17 5.27 5.36 5.41 5.45 5.48<br />
Profit After Tax 4.31 6.25 8.14 10.10 9.99 9.89 9.85 9.79 9.74 9.70<br />
Dividend 0.00 0.00 0.38 0.38 0.38 0.76 0.76 0.76 0.76 0.76<br />
Profits For Appropriation 4.31 6.25 7.76 9.72 9.61 9.14 9.10 9.04 8.99 8.94<br />
COMPUTATI<strong>ON</strong> <strong>OF</strong> TAX<br />
Profit after interest before depreciation 5.97 9.41 12.65 15.93 15.96 15.96 16.02 16.01 16.00 15.98<br />
Depr.(WDV) to be claimed 3.52 2.69 2.05 1.57 1.21 0.93 0.72 0.56 0.44 0.35<br />
Depreciation claimed 3.52 2.69 2.05 1.57 1.21 0.93 0.72 0.56 0.44 0.35<br />
Depr. carried forward 0.00 0.00 0.00 0.00 0.00 0.00 0.00 0.00 0.00 0.00<br />
Taxable Profit 2.45 6.73 10.60 14.36 14.75 15.03 15.29 15.45 15.56 15.63<br />
Profit Before Tax (Book) 5.17 8.61 11.85 15.12 15.16 15.16 15.21 15.21 15.19 15.17<br />
Minimum Alternate Tax 0.00 0.00 0.00 0.00 0.00 0.00 0.00 0.00 0.00 0.00<br />
Tax (Actual) 0.86 2.36 3.71 5.03 5.17 5.27 5.36 5.41 5.45 5.48<br />
Tax Provision 0.86 2.36 3.71 5.03 5.17 5.27 5.36 5.41 5.45 5.48<br />
174
EXHIBIT 7.6<br />
SENSITIVITY ANALYSIS<br />
Items Profit after Tax<br />
(PAT)<br />
Rs. Cr.<br />
( assumed at 90 %<br />
capacity )<br />
Break<br />
Even<br />
(%)<br />
Appendix – 5A (Contd…)<br />
Internal<br />
Rate of<br />
Return<br />
(IRR)<br />
(%)<br />
Payback<br />
Period<br />
(Years)<br />
NORMAL VALUES 10.10 66.18 42.44 2.74<br />
Debt Equity Ratios<br />
(a) 2:1<br />
(b) 1:1<br />
Increase in Project Cost<br />
by 10 %<br />
Increase in Selling Price<br />
to Rs. 16 / Diaper<br />
Decrease in Selling Price<br />
to Rs. 14 / Diaper<br />
Decrease in Raw<br />
Material Prices by 10%<br />
Increase in Raw<br />
Material Prices by 10%<br />
10.06<br />
10.15<br />
66.30<br />
65.99<br />
42.53<br />
42.31<br />
2.74<br />
2.75<br />
10.02 66.55 39.71 2.90<br />
12.75 61.49 51.29 2.32<br />
7.44 72.37 32.74 3.36<br />
12.95 59.75 52.61 2.26<br />
7.24 74.15 31.48 3.47<br />
175
BABY DIAPERS (C<strong>ON</strong>VERTING LINE)<br />
Appendix – 5A (Contd…)<br />
SECTI<strong>ON</strong>-I : PRODUCT BRIEF, APPLICATI<strong>ON</strong> AREAS AND MARKET<br />
Baby Diapers:<br />
POTENTIAL<br />
8.1 The baby diapers main functions are to keep the baby dry and absorb and retain urine and waste.<br />
Baby Diapers must be able to keep the baby dry (be able to take up a large quantity of liquid) and then “hold<br />
it under load” as the baby moves around.<br />
Important / Desired properties of baby diapers are:<br />
• High absorbency while creating little or no irritation to the skin (skin<br />
friendly) - No Diaper Rash,<br />
• Protect against leaks,<br />
• No rewetting (provide dryness),<br />
• Comfortable and good fit,<br />
• Environmentally friendly when disposed,<br />
• No noise, Easy to handle with features such as refastenable tapes.<br />
Functions of baby diapers are:<br />
• Absorb urine during miction,<br />
• Retain urine inside the absorbent core,<br />
• Isolate wetness from the baby’s skin,<br />
• Containing faeces,<br />
• Isolate urine and faeces from the baby’s environment ( clothes, bed, etc.)<br />
8.2 The baby diaper design is strongly driven by bare marketing issues: make the product attractive not<br />
for the user (Baby) but for the purchaser (Mother).<br />
Emerging Market Potential - Global and Indian<br />
Baby Diapers:<br />
Global Baby Diapers Market :<br />
8.3 The global market for disposable diapers is $20 bn annually (2001). The diaper<br />
industry accounted for approximately 80% of the North American coverstock<br />
consumption according to EDANA (1997).<br />
177
Appendix – 5A (Contd…)<br />
8.4 According to EDANA, the West European market for disposable baby products is<br />
around 16 bn pieces (2001 data). The diaper market is mature in developed areas such as<br />
North America, Western Europe and Japan, while the penetration in other areas is limited,<br />
making it attractive to the manufacturers. This is because the declining birth rates and<br />
extremely high penetration levels in the developed regions have created a maturing<br />
market with little room for growth.<br />
Indian Baby Diapers Market :<br />
8.5 The Indian market for Baby Diapers is around Rs 70 Cr. p.a. The industry<br />
estimates the baby diaper market to grow at a rate of around 5-10% (Average: 7%).<br />
8.6 The market estimates for the baby diapers and the nonwoven requirement that<br />
would arise form the segment is as follows:<br />
Year Baby Diapers Demand Nonwoven demand<br />
Qty<br />
(mn pcs)<br />
Value<br />
(Rs. Cr.)<br />
Qty<br />
(tonnes)<br />
Value<br />
(Rs. Cr.)<br />
2001 - 02 53.85 70.00 161.55 1.78<br />
2003 - 04 (Estm.) 61.65 80.14 184.95 2.03<br />
2007 - 08 (Proj.) 80.81 105.05 242.43 2.67<br />
* Demand projections are subject to Market Realisation<br />
SECTI<strong>ON</strong> II : DIAPERS MANUFACTURING TECHNOLOGY AND<br />
EQUIPMENTS SUPPLIERS<br />
Process Description:<br />
8.7 The main raw material is cellulose pulp in rolls. The fluffing system is obtained<br />
through a hammer mill inside an asonic cabin which reduces the noise. The entry of the<br />
pulp rolls is regulated by a speed variator so does the weight. A super-absorbent powder<br />
is applied at this stage on the fluffed pulp.<br />
8.8 The combined fluff mat ribbon overwrapped by the tissue is transported to an<br />
embossing unit through a conveyor belt. Then the mat is cut by a rotary die and the<br />
resulting pad obtained is spaced and top formed by a non woven fabric covering, while<br />
the bottom will be formed by a PVC sheet. A unit composed by a set of rotary cutting<br />
knives provide to cut the diapers and the PVC with the non woven, while a continuous<br />
178
Appendix – 5A (Contd…)<br />
suction system provides the removal of the cutting waste. In this part of the machine there<br />
is an applicator to fix the elastic in the leg region. Other applicators can operate according<br />
to the type and quality of the diapers desired applying the frontal tapes, the faecal barrier<br />
and eventually elastic waist-band. Adhesive labels type velcro are applied in order to fix<br />
the waist-line of the diaper.<br />
8.9 A sealing system seals the ends of the diapers, after the final cut. The finished<br />
diapers are then conveyed to a transversal final folding group which has the capacity to<br />
half-fold or three-fold the diapers by means of belts and cams.<br />
8.10 An automatic counter and packer unit is receiving the finished folded product, and<br />
discharges stacks of diapers pre-counted in a funnel where the operator has to insert a<br />
poly bag or cardboard box for the final packing.<br />
Machinery (Technology & Equipment) Suppliers and Specifications:<br />
8.11 Globally, the well known technology suppliers with proven track record for<br />
Diapers contacted by TECS are:<br />
1. M. D. Viola (Italy),<br />
2. Diatec SRL (Italy),<br />
3. Sanimac (Italy),<br />
4. Rainbow Fame (Taiwan),<br />
5. Caldiroli (Italy),<br />
6. BHT Bicma (Germany),<br />
7. Fameccanica (Italy).<br />
Note : The list contains the leading global players in manufacturing Baby Diapers and based<br />
on discussion with Industry experts the above list is exhaustive.<br />
8.12 TECS has received favourable responses and indicative quotations.<br />
Process Systems and Equipments<br />
• The machinery required for the manufacturing of the Baby Diapers is as<br />
follows:<br />
o Pulp Unwinding Stand,<br />
o Pulp Grinding,<br />
o Fluff Drum Forming System,<br />
o SAP Applicator,<br />
o Fluff Recycling System,<br />
o Compression Unit / Debulking Unit,<br />
179
o Backsheet / Coverstock Unwinding,<br />
o Leg Cuff Applicator,<br />
o Fluted Elastic Waist Band Applicator,<br />
o Acquisition Layer Applicator.<br />
o Hot Melt System,<br />
o Three Folding System,<br />
o Stacker and Counter,<br />
Recommended Minimum Economic Size:<br />
Appendix – 5A (Contd…)<br />
8.13 The Baby Diapers project proposed to be set up in India will have a designed<br />
capacity of 400 diapers per min.<br />
8.14 Under Indian operating conditions it is safer to assume machine efficiency factor<br />
of 75%, and therefore the production would be 300 diapers per min (Baby Diapers)<br />
8.15 The plant would operate in three shifts, 24 hours and 300 working days in a year.<br />
8.16 These converting lines mentioned above are dedicated for baby diapers only.<br />
Investment in Process Plant and Machinery.<br />
8.17 For the baby diapers project is the investment in the process plant and<br />
machinery will be Rs 6.46 crores (FOB) after a discount of 15%. Finer details on the<br />
Equipment listing, specification and the quotations need to be discussed with the<br />
technology supplier before the project is taken up. Taking into account the CIF value, the<br />
custom duties (5%), CVD (16%), inland transportation and loading / unloading (2%),<br />
erection and commissioning (5%), the installed cost of process equipment would be Rs<br />
8.60 crores.<br />
SECTI<strong>ON</strong> III-B : PROJECT COST AND FINANCIALS<br />
Land<br />
8.18 The total requirement of land for this project keeping in mind the possible future<br />
expansion is around 6069 sq. mtrs. (1.5 acres ).<br />
8.19 Based on the available information, the cost of land is assumed at Rs 1200 per<br />
square meter (including the developmental cost ). Depending on the exact location of the<br />
project to be determined by the promoter the land cost could be higher or lower. Hence<br />
the total cost of developed land will be Rs 0.73 crores (Rs 73 lakhs).<br />
Buildings<br />
180
Appendix – 5A (Contd…)<br />
8.20 The building area comprising of main factory building, godowns, office , R&D<br />
labs / In-house Testing centre etc. would be 3500 sq. mtrs. The cost of construction<br />
would again vary depending on the structure and the materials to be used. It has been<br />
assumed that the average cost of construction would be Rs 4500 per sq. mtr. Thus the<br />
total cost of building and other civil works would be around Rs 1.58 crores.<br />
Plant and Machinery<br />
8.21 Details of Plant and machinery as well as technology required for the project have<br />
been presented in earlier Section II . The installed cost of plant and machinery would be<br />
Rs 8.60 crores.<br />
8.22 Apart from the main process equipments the utilities required are:<br />
• Electricals,<br />
• Piping,<br />
• Water supply,<br />
• Compressors,<br />
• Fire fighting equipments<br />
8.23 The provision on this count is taken as 5% of the cost of machinery which works out to Rs 0.43<br />
crores (Rs 43 lakhs).<br />
Testing Facilities<br />
8.24 The Baby Diapers unit calls for Tensile Strength testing, Burst Strength testing<br />
for Corrugated Boxes, Dancing Doll (which has its legs moving to mimic the walking<br />
effects of the baby). A provision of around Rs 0.15 crore (Rs 15 lakhs) is made on this<br />
count.<br />
Miscellaneous Fixed Assets<br />
8.25 Under this head the items included are Furniture and fixtures, Office equipments,<br />
Air Conditioners etc. and the provision made is around Rs 0.15 crores (Rs 15 lakhs),<br />
inclusive of the testing and R&D facilities.<br />
Project Engineering and Consulting<br />
8.26 Under this head the items included are the fees and expenses on account of<br />
Architect fees, project engineering and management (both local and overseas), detailed<br />
project reports, etc. The total expenses under this head may be taken as 2.5% of the total<br />
machinery and civil assets cost<br />
181
Preliminary & Preoperative Expenses<br />
Appendix – 5A (Contd…)<br />
8.27 The items included under this head are company formation expenses, public issue<br />
expenses (if any), interest during construction, pre production expenses during the<br />
implementation phase etc.<br />
Contingency Expenses<br />
8.28 Depending on the gestation period and further detailing of the project cost by the<br />
promoter, the contingency provision has been made at the rate of 10%.<br />
Margin Money for Working capital<br />
8.29 The margin money for working capital forming part of the total project cost would<br />
be Rs 2.49 Crores .[Exhibit 8.3]<br />
Total Project Cost (Total Investment)<br />
8.30 The total project cost as given in Exhibit 8.1 would be Rs 17.10 crores.<br />
Project Funding and Financing Pattern:<br />
8.31 It has been assumed that the project would be financed through long term funds and Equity<br />
participaion by the Promoter / Public. The technical textile sector being a high priority area , it is assumed<br />
that a Debt- Equity ratio of 1.5 : 1 would be feasible. (However the sensitivity analysis has also been<br />
presented for 1 : 1 and 2 : 1 Debt Equity ratios.)<br />
Sales , Profitability and Sensitivity Analysis:<br />
Sales Realisation and Turnover<br />
8.32 As per the details available from the Technology and Equipment suppliers the<br />
economic size of a plant is 400 baby diapers per min.<br />
8.33 Under the Indian conditions, it is assumed that the machine would operate at an<br />
efficiency level of 75%. Hence the production from the plant would be 300 baby diapers<br />
per min..<br />
8.34 The plant would operate on Three-shift basis and 300 workings days in a year.<br />
8.35 The capacity utilisation for the 1st year is assumed at 50% and thereafter for the<br />
2nd, 3rd and 4th year onwards 60%, 75% and 90% respectively.<br />
8.36 The average selling price of the end product would be Rs 8 per baby diaper (net of<br />
182
Appendix – 5A (Contd…)<br />
sales tax and other incidental expenses). There is no excise duty on these products. The<br />
international price of the baby diapers is Rs 12 - 18 per piece. On this the import duty,<br />
CVD, margins etc. get added.<br />
8.37 The details of projected sales turnover are given in Exhibit 8.2.<br />
Cost of Productions<br />
Major Raw materials and their specifications:<br />
8.38 The main raw materials used and the corresponding prevailing prices as an<br />
indicator are as follows:<br />
Raw Material Prices Landed cost<br />
(inclusive of all duties)<br />
Wood Pulp Core (Fluff) Rs. 30 per kg Rs. 35 per kg<br />
Nonwoven for topsheet and cuffs Rs. 90 per kg Rs. 110 per kg<br />
Super Absorbent Polymer Rs. 70 per kg Rs. 110 per kg<br />
Hot Melt Glue Rs. 150 per kg Rs. 300 per kg<br />
8.39 Apart from the above, other materials also form a part of the napkins like those mentioned below:<br />
• Acquisition layer,<br />
• Tissue,<br />
• Poly Backsheet,<br />
• Elastic Waist Band,<br />
• Frontal Tape,<br />
• Prelaminated Tape,<br />
• Leg Elastic,<br />
• Elastic Cuffs,<br />
8.40 Wood Pulp Core (Fluff) and Nonwoven or Perforated Poly account for around 70-75% of the total<br />
raw material cost and weight..<br />
8.41 The nonwoven in the gsm range of 20-25 gsm is used.<br />
8.42 The leading suppliers of the Baby Diapers raw materials are:<br />
• Wood Pulp Core (Fluff): Georgia Pacific, Weyerhaeuser, Tartas<br />
183
S.A.,Buckeye Cellulose Corporation, Cellu Tissue Corporation,<br />
Appendix – 5A (Contd…)<br />
• Nonwoven or Perforated Poly: Amoco Fabrics Division, Fabriano Soft S.r.l.,<br />
Conversion Cost<br />
Tenotex S.p.a., Pantex Group<br />
8.43 The conversion cost will include the cost of power, water , other utility items , chemicals and<br />
additives, consumables etc. which is assumed at 10% of the cost of raw material.<br />
Manpower, Salaries and Wages<br />
8.44 The manpower requirements and the salary structure is given in Exhibit 8.4.<br />
8.45 The total manpower requirement comprising the managerial cadre of supervisors, machine<br />
operators and helpers would be 48 persons. The wage bill for the conversion unit would be Rs 0.67 crores.<br />
Factory and Overhead Expenses<br />
8.46 The items covered under this head are establishment expenses, repairs and maintenance, stationery,<br />
travel expenses, packaging expenses etc.<br />
Marketing and Promotional Expenses<br />
8.47 The promotion of technical textiles will call for expenditure on this count and a provision of 25%<br />
of the annual sales has been made uniformly over the years.<br />
8.48 This provision includes the distributors and retailers margins, advertising and<br />
promotional expenses etc. Being a new project, such heavy expenditure on marketing and<br />
promotional efforts would be required. The public does have sufficient knowledge about<br />
the baby diapers, however availability at the right place and the right price along with<br />
channelled marketing efforts will be the thrust areas.<br />
Interest and Depreciation<br />
8.49 The prevailing interest rate for long term and short term borrowed funds is assumed at 5% and<br />
11% per annum as it is covered under Technology Upgaradation Fund (TUF)<br />
8.50 The repayment of loans has been assumed for 10 years with a moratorium period<br />
of two years (2+8).<br />
8.51 The depreciation rates have been worked out as per Company’s act (SLM) and<br />
Income-Tax Ready Reckoner (WDV).<br />
184
Appendix – 5A (Contd…)<br />
8.52 The current corporate tax rate is assumed at 35 % and the surcharge is assumed at<br />
2.5% per annum.<br />
Profitability, Break-even, IRR, DSCR and Payback<br />
8.53 As presented in Exhibit 8.5, the net sales turnover increases from Rs 50.80 crores<br />
in the first year to Rs 91.45 crores from the 4th year.<br />
8.54 The PBT increases from Rs 4.55 crores in the first year to Rs 13.59 crore in the<br />
fourth year.<br />
8.55 The Break Even of the project is at 69.31%.<br />
8.56 The Internal Rate of Return ( IRR ) has been worked out at 41.47%.<br />
8.57 The Payback period for the project is 2.83 years.<br />
Sensitivity Analysis<br />
8.58 The sensitivity analysis has been presented in the Exhibit 8.6.<br />
OPTI<strong>ON</strong> II<br />
8.59 This option presents the choice of the cheaper machine (Chinese make) with an<br />
installed cost in the process plant and machinery of Rs 2.40 crores. The total project cost<br />
would be Rs 7.36 crores.<br />
8.60 The designed capacity of the machine is for 150 baby diapers per min. The sales<br />
revenues are shown in Exhibit 8.7.<br />
Profitability, Break-even, IRR, DSCR and Payback<br />
8.61 As presented in Exhibit 8.8, the sales turnover increases from Rs 19.05 crores in<br />
the first year to Rs 34.29 crores from the 4th year onwards.<br />
8.62 The PBT increases from Rs 1.37 crores in the first year to Rs 4.59 crores in the<br />
fourth year onwards.<br />
8.63 The Break Even of the project is at 71.90%.<br />
8.64 The Internal Rate of Return ( IRR ) has been worked out at 33.36%.<br />
8.65 The Payback period for the project is 3.35 years.<br />
185
COMPARISI<strong>ON</strong> <strong>OF</strong> ALTERNATE TECHNOLOGIES<br />
Technology Particulars Option - I<br />
European Technology<br />
Baby Diapers Project<br />
Appendix – 5A (Contd…)<br />
Option - II<br />
Local / Chinese Technology<br />
Capacity 400 Diapers per min 150 Diapers per min<br />
Project Cost Rs. 17.10 Cr Rs. 7.36 Cr.<br />
Revenue (1 st year) Rs. 50.80 Cr. Rs. 19.05 Cr.<br />
BEP 69.31% 71.90%<br />
IRR 41.47% 33.36%<br />
Payback 2.83 years 3.35 years<br />
DEVELOPMENTAL AND PROMOTI<strong>ON</strong>AL MEASURES<br />
8.66 Prevailing duty structure on the following products needs revision for the<br />
promotion of this sector and even be competitive in the export market.<br />
Item Prevailing Duty<br />
Structure<br />
Recommended<br />
Duty Structure<br />
Wood Pulp 5% (BCD) + 4% (CVD) Total Duty : 5%<br />
NonWovens 20% (BCD) + 16% (CVD) +<br />
Super Absorbent<br />
Polymers<br />
0.5% (Textile Cess)<br />
Total Duty : 10%<br />
20% (BCD) + 16% (CVD) Total Duty : 10%<br />
Hot Melt Glue 20% (BCD) + 16% (CVD) Total Duty : 10%<br />
8.67 The new players have to be creative when exploring newer markets areas, such as premature<br />
diapers. They should look for opportunities in growing regions such as Asia and Latin America. With a<br />
large populations and number of consumers, Asia has become one of the largest growing market for baby<br />
diapers. Latin America is also an area for diaper growth, despite economic turmoil in Argentina and<br />
Venezuela. Extra features at a lower price will determine which diaper will be chosen<br />
186
Exhibit 8.1<br />
PROJECT COST<br />
(LAND, BUILDINGS, PROCESS PLANT & MACHINERY, UTILITIES & O<strong>THE</strong>R ASSETS)<br />
Project Cost (Rs. Cr.)<br />
1 Land 0.73<br />
Area: 1.5 acres ( 6069 Sq Mtrs)<br />
Rate: (Rs.1200 /Sq. Mtr)<br />
2 Buildings 1.58<br />
(Plant Area, Office, Godown, Lab, Service Area etc.)<br />
Built-up Area : 3500 Sq. Mtrs<br />
Avg Rate : Rs.4500 /Sq. Mtrs<br />
3 Process Plant & Equipment 8.60<br />
4 Testing Equipments 0.15<br />
5 Utility & Other equipments 0.43<br />
(Power, Water, Compressor, Humidity Control,<br />
Fire Fighting, Material Handling etc.)<br />
6 Misc. Fixed Assets 0.15<br />
(Furniture & Fixtures, Office Equipment, Testing Lab etc.)<br />
7 Project Engineering & Consultancy charges (2.5%) 0.27<br />
8 Preliminary & Pre-operative Expenses (12%) 1.38<br />
(Company Formation, Interest during construction,<br />
pre-production expenses, etc.)<br />
9 Contingency (10 %) 1.33<br />
10 Total 14.61<br />
11 Margin Money for Working Capital 2.49<br />
12 Total Project Cost 17.10<br />
187
Exhibit 8.2<br />
ESTIMATI<strong>ON</strong> <strong>OF</strong> SALES REVENUE<br />
ITEM YEAR <strong>OF</strong> OPERATI<strong>ON</strong><br />
I II III IV V VI VII VIII IX X<br />
Designed Capacity per min 400 400 400 400 400 400 400 400 400 400<br />
75% efficiency 300 300 300 300 300 300 300 300 300 300<br />
Capacity Utilisation 50% 60% 75% 90% 90% 90% 90% 90% 90% 90%<br />
Actual Production per min (pcs) 150 180 225 270 270 270 270 270 270 270<br />
Actual Production per hr (pcs) 9000 10800 13500 16200 16200 16200 16200 16200 16200 16200<br />
Production per day (pcs) 216000 259200 324000 388800 388800 388800 388800 388800 388800 388800<br />
Production for 300 working days (pcs) 64800000 77760000 97200000 116640000 116640000 116640000 116640000 116640000 116640000 116640000<br />
Selling Price (Rs/pc) 8.00 8.00 8.00 8.00 8.00 8.00 8.00 8.00 8.00 8.00<br />
Sales Revenue (Rs. Cr) 51.84 62.21 77.76 93.31 93.31 93.31 93.31 93.31 93.31 93.31<br />
Value Loss ( 2% ) 1.04 1.24 1.56 1.87 1.87 1.87 1.87 1.87 1.87 1.87<br />
Net Sales Revenue (Rs. Cr) 50.80 60.96 76.20 91.45 91.45 91.45 91.45 91.45 91.45 91.45<br />
188<br />
(Rs. Cr.)
Factory Related<br />
EXHIBIT 8.3<br />
REQUIREMENT <strong>OF</strong> WORKING CAPITAL<br />
ITEM NO. <strong>OF</strong> MARGIN YEAR I YEAR II YEAR III YEAR IV<br />
(Rs.Lakhs)<br />
YEAR V<br />
M<strong>ON</strong>THS (%) W.CAP MARGIN BANK W.CAP MARGIN BANK W.CAP MARGIN BANK W.CAP MARGIN BANK W.CAP MARGIN BANK<br />
REQMT M<strong>ON</strong>EY FINANCE REQMT M<strong>ON</strong>EY FINANCE REQMT M<strong>ON</strong>EY FINANCE REQMT M<strong>ON</strong>EY FINANCE REQMT M<strong>ON</strong>EY FINANCE<br />
Raw materials & other commodities 1.00 25.00 2.06 0.52 1.55 2.48 0.62 1.86 3.10 0.77 2.32 3.72 0.93 2.79 3.72 0.93 2.79<br />
Finished Goods 1.00 25.00 3.67 0.92 2.75 4.25 1.06 3.18 5.25 1.31 3.94 6.25 1.56 4.69 6.25 1.56 4.69<br />
A/c Receivable 1.00 25.00 4.23 1.06 3.18 5.08 1.27 3.81 6.35 1.59 4.76 7.62 1.91 5.72 7.62 1.91 5.72<br />
Cash in hand<br />
Salaries & wages 1.00 0.00 0.06 0.00 0.06 0.06 0.00 0.06 0.06 0.00 0.06 0.06 0.00 0.06 0.07 0.00 0.07<br />
Utilities 1.00 0.00 0.21 0.00 0.21 0.25 0.00 0.25 0.31 0.00 0.31 0.37 0.00 0.37 0.37 0.00 0.37<br />
Advertising & Promotional Expenses 1.00 0.00 1.06 0.00 1.06 1.27 0.00 1.27 1.59 0.00 1.59 1.91 0.00 1.91 1.91 0.00 1.91<br />
Admin. Overheads 1.00 0.00 0.17 0.00 0.17 0.17 0.00 0.17 0.17 0.00 0.17 0.17 0.00 0.17 0.17 0.00 0.17<br />
Total Requirement 11.31 2.49 8.81 13.40 2.95 10.45 16.67 3.67 13.00 19.95 4.40 15.55 19.95 4.40 15.55<br />
189
Factory Related<br />
EXHIBIT 8.3 (C<strong>ON</strong>TD...)<br />
REQUIREMENT <strong>OF</strong> WORKING CAPITAL<br />
ITEM NO. <strong>OF</strong> MARGIN YEAR VI YEAR VII YEAR VIII YEAR IX<br />
(Rs.Lakhs)<br />
YEAR X<br />
M<strong>ON</strong>THS (%) W.CAP MARGIN BANK W.CAP MARGIN BANK W.CAP MARGIN BANK W.CAP MARGIN BANK W.CAP MARGIN BANK<br />
REQMT M<strong>ON</strong>EY FINANCE REQMT M<strong>ON</strong>EY FINANCE REQMT M<strong>ON</strong>EY FINANCE REQMT M<strong>ON</strong>EY FINANCE REQMT M<strong>ON</strong>EY FINANCE<br />
Raw materials & other commodities 1.00 25.00 3.72 0.93 2.79 3.72 0.93 2.79 3.72 0.93 2.79 3.72 0.93 2.79 3.72 0.93 2.79<br />
Finished Goods Stock 1.00 25.00 6.26 1.56 4.69 6.26 1.57 4.70 6.27 1.57 4.70 6.28 1.57 4.71 6.28 1.57 4.71<br />
A/c Receivable 1.00 25.00 7.62 1.91 5.72 7.62 1.91 5.72 7.62 1.91 5.72 7.62 1.91 5.72 7.62 1.91 5.72<br />
Cash in hand<br />
Salaries & wages 1.00 0.00 0.07 0.00 0.07 0.08 0.00 0.08 0.09 0.00 0.09 0.09 0.00 0.09 0.10 0.00 0.10<br />
Utilities 1.00 0.00 0.00 0.00 0.00 0.00 0.00 0.00 0.00 0.00 0.00 0.00 0.00 0.00 0.00 0.00 0.00<br />
Advertising & Promotional Expenses 1.00 0.00 0.02 0.00 0.02 0.02 0.00 0.02 0.02 0.00 0.02 0.02 0.00 0.02 0.02 0.00 0.02<br />
Admin. Overheads 1.00 0.00 1.91 0.00 1.91 1.91 0.00 1.91 1.91 0.00 1.91 1.91 0.00 1.91 1.91 0.00 1.91<br />
Total Requirement 19.96 4.40 15.56 19.97 4.40 15.57 19.99 4.40 15.59 20.00 4.40 15.60 20.02 4.41 15.61<br />
190
190
Exhbit 8.4<br />
MANPOWER REQUIREMENTS<br />
Nos Monthly Total Monthly Salary Annual<br />
General Manager 1 30000 30000 360000<br />
Production Manager 1 20000 20000 240000<br />
Machine Operators 6 6000 36000 432000<br />
Machine Helper (Semi Skilled) 12 3000 36000 432000<br />
R&D, Testing 2 8000 16000 192000<br />
Marketing Manager & Sales Manager 2 25000 50000 600000<br />
Sales Representatives 12 12000 144000 1728000<br />
Clerical Staff 6 6000 36000 432000<br />
Other Staff 4 3000 12000 144000<br />
Maintenance (Elec. & Mech.) 2 10000 20000 240000<br />
TOTAL 48 400000 4800000<br />
Fringe Benefits (40 % of the above) 1920000<br />
Total Wage Bill (Annual) Rs. lakhs: Salary + Other Benefits = 6720000.00<br />
Total Wage Bill (Annual) Rs. Cr.: 0.672<br />
191
Exhibit 8.5<br />
PR<strong>OF</strong>ITABILITY STATEMENT AND COMPUTATI<strong>ON</strong> <strong>OF</strong> TAX<br />
(Rs.Cr)<br />
ACCOUNT HEAD FINANCIAL YEAR <strong>OF</strong> OPERATI<strong>ON</strong><br />
I II III IV V VI VII VIII IX X<br />
Revenue<br />
Net Sales Turnover 50.80 60.96 76.20 91.45 91.45 91.45 91.45 91.45 91.45 91.45<br />
Total Revenue 50.80 60.96 76.20 91.45 91.45 91.45 91.45 91.45 91.45 91.45<br />
Expenses<br />
Raw Materials 24.78 29.73 37.17 44.60 44.60 44.60 44.60 44.60 44.60 44.60<br />
Salaries & wages 0.67 0.71 0.74 0.78 0.82 0.88 0.95 1.03 1.11 1.20<br />
Conversion Costs 2.48 2.97 3.72 4.46 4.46 4.46 4.46 4.46 4.46 4.46<br />
Marketing & Promotional Expenses 12.70 15.24 19.05 22.86 22.86 22.86 22.86 22.86 22.86 22.86<br />
Factory & Office Overheads 2.07 2.07 2.07 2.07 2.07 2.07 2.07 2.07 2.07 2.07<br />
CVD 1.11 0.00 0.00 0.00 0.00 0.00 0.00 0.00 0.00 0.00<br />
Interest on S.T. Loans 0.97 1.15 1.43 1.71 1.71 1.71 1.71 1.71 1.72 1.72<br />
Cost of Sales 44.99 52.09 64.39 76.70 76.74 76.80 76.87 76.95 77.03 77.13<br />
Depreciation (St.Line) 0.70 0.70 0.70 0.70 0.70 0.70 0.70 0.70 0.70 0.70<br />
Amort. of Expenses 0.05 0.05 0.05 0.05 0.05 0.05 0.00 0.00 0.00 0.00<br />
Interest on L.T Loan 0.51 0.51 0.48 0.42 0.35 0.29 0.22 0.16 0.10 0.03<br />
Profit Before Tax 4.55 7.62 10.59 13.59 13.61 13.61 13.65 13.64 13.62 13.59<br />
Tax 0.78 2.10 3.33 4.53 4.65 4.73 4.80 4.85 4.88 4.90<br />
Profit After Tax 3.78 5.52 7.26 9.06 8.97 8.88 8.85 8.79 8.74 8.69<br />
Dividend 0.00 0.00 0.34 0.34 0.34 0.68 0.68 0.68 0.68 0.68<br />
Profits For Appropriation 3.78 5.52 6.91 8.72 8.63 8.20 8.16 8.10 8.05 8.01<br />
192
EXHIBIT 8.6<br />
SENSITIVITY ANALYSIS<br />
Items Profit after Tax<br />
(PAT)<br />
Rs. Cr.<br />
( assumed at 90 %<br />
capacity )<br />
Break<br />
Even<br />
(%)<br />
Appendix – 5A (Contd…)<br />
Internal<br />
Rate of<br />
Return<br />
(IRR)<br />
(%)<br />
Payback<br />
Period<br />
(Years)<br />
NORMAL VALUES 9.06 69.31 41.47 2.83<br />
Debt Equity Ratios<br />
(a) 2:1<br />
(b) 1:1<br />
Increase in Project Cost<br />
by 10 %<br />
Increase in Selling Price<br />
to Rs. 9.00 / Diaper<br />
Decrease in Selling Price<br />
to Rs. 7.00 / Diaper<br />
Decrease in Raw<br />
Material Prices by 10%<br />
Increase in Raw<br />
Material Prices by 10%<br />
9.03<br />
9.11<br />
69.43<br />
69.14<br />
41.56<br />
41.34<br />
2.83<br />
2.85<br />
9.00 69.65 38.79 3.00<br />
14.38 60.24 60.44 2.03<br />
3.75 85.36 19.11 4.96<br />
12.30 61.76 54.09 2.23<br />
5.83 78.98 27.85 3.82<br />
193
HEALTHCARE DISPOSABLES<br />
Appendix – 5A (Contd…)<br />
( MASKS, CAPS, GOWNS, DRAPES, ETC.) C<strong>ON</strong>VERTING LINE<br />
SECTI<strong>ON</strong> - I : PRODUCT BRIEF, USAGE PATTERNS<br />
Product Range and Application Areas:<br />
9.1 Healthcare Textiles required by the hospitals can be classified as follows:<br />
Healthcare Textiles<br />
Surgical Clothings Surgical Covers Beddings<br />
� Gowns<br />
� Caps<br />
� Masks<br />
� Uniforms<br />
Fabric Used:<br />
� Nonwovens<br />
� Plastics<br />
� Sheets<br />
� Blankets<br />
� Pillowcases, etc.<br />
Disposables Non-disposables Disposables Non - disposables<br />
Fabric Used:<br />
� Nonwovens<br />
Surgical Clothing<br />
Fabric Used:<br />
� Woven in Cotton<br />
and blends<br />
� Disposables<br />
� Drapes<br />
� Covers<br />
Fabric Used:<br />
� Nonwovens<br />
Fabric Used:<br />
� Woven in<br />
Cotton and<br />
blends<br />
9.2 Surgical Clothings consist of all the items required by the doctors, nurses and the<br />
hospital staff such as the gowns, caps, uniforms, etc.<br />
195
Appendix – 5A (Contd…)<br />
9.3 Woven fabrics are traditionally used in Surgical Gowns. Instead of 100% cotton<br />
woven gown, polyester / combed cotton woven/knitted fabrics prove to be comfortable,<br />
with good abrasion resistance, moisture resistance, faster drying and reusability properties<br />
and also low linting. Nonwoven gowns are very rarely used in the Indian hospitals.<br />
9.4 Surgical Masks are of the woven type made of cotton. However, masks made<br />
from non-woven fabrics with a three layer structure and ultrasonically sealed are also<br />
being used in the country. These masks should have a high bacterial filtration capacity,<br />
high air permeability and light weight. Though these disposable masks are used in the<br />
large hospitals, the reusable masks still have a strong presence in the Indian markets.<br />
They are covered on both sides by acrylic bonded parallel-laid or random-laid non-<br />
woven.<br />
9.5 Surgical Caps are of both woven and non-woven types, woven being made of<br />
cotton and the non-wovens made from cellulosic fibres using the spun-laying or thermal-<br />
bonding process.<br />
9.6 Uniforms made of cotton, viscose teflon blends have necessary requirements of<br />
comfort and durability.<br />
Surgical Covers<br />
9.7 Surgical drapes made of nonwovens or plastic provide an essential adjunct to skin<br />
disinfection in containing the patients skin bacteria and play a vital role in the surgical<br />
aseptic regime. They physically contain any skin bacteria which rises to the skin surface<br />
during surgery, thus preventing it from migrating into the incision site and thus reducing<br />
the incidence of wound contamination. They provide a waterproof, bacteria proof barrier,<br />
which prevents wound irrigates, organs and instruments from being contaminated by<br />
direct contact with the unsterile skin.<br />
Beddings<br />
9.8 The Beddings used in the Indian hospitals are of reusable type rather than the<br />
disposable bedsheets, pillowcases, blankets used globally. A combination of cotton,<br />
cellulose and a fluffy absorbent material is commonly used. The use of Machintosh sheets<br />
is common as an alternative, only if needed. Woolen blankets are used in India while the<br />
world over cotton leno blankets have replaced the traditional woolen blankets to prevent<br />
the risk of cross-infection.<br />
196
Indian Market Size and Potential for Healthcare Textiles<br />
Appendix – 5A (Contd…)<br />
9.9 TECS has adopted a two-pronged approach for assessing the Indian market.<br />
(i) The leading hospitals were contacted to understand their requirement and usage<br />
patterns as well as their supply sources.<br />
(ii) Producers / Dealers survey<br />
9.10 To estimate the potential demand for medical disposables, data regarding the number of hospitals<br />
and number of beds in the country was obtained. A correlation has been established between the number of<br />
beds and the product usage pattern to estimate the potential demand for nonwovens.<br />
9.11 Nonwoven material is superior to cotton in terms of hydrophobic ability and<br />
air permeability linking. However, in terms of flammability or electric charging non<br />
woven material is inferior to cotton cloth. The major reasons nonwovens are used for<br />
surgical operations is that they ensure a relatively low post operational rate of infection..<br />
In emergency operations, when there is no time to do routine comprehensive<br />
examinations there is a greater risk of contamination. The pre-requisites of the<br />
nonwovens used in the healthcare segment are high level of barrier protection while<br />
being soft and breathable.<br />
9.12 The market study reveals that the nonwovens comprise a very small portion of the<br />
entire healthcare segment. Mostly the big hospitals use disposable headgear and<br />
facemasks and they are the ones who have shown willingness to use other disposables.<br />
9.13 These products which have found acceptance in the Western countries are yet to<br />
make inroads in the Indian market in a significant manner. This can be attributed to<br />
various factors such as:<br />
I. Abundance of the raw material and low operational cost:<br />
• India has plenty of cotton, the raw material needed for preparing the reusable<br />
material. Due to this the reusable textiles are manufactured cheaper and in mass scale<br />
for the use of the healthcare industry. In the global markets, cotton is a scarcely<br />
available commodity and hence costly, thus increasing the cost of the end product.<br />
Here the disposables made of nonwovens are found to be much cheaper.<br />
• Labour costs are higher than India in the developed countries and the production of<br />
woven healthcare textiles being labour intensive, increases the manufacturing cost of<br />
the end product.<br />
197
II. Budgetary constraints<br />
Appendix – 5A (Contd…)<br />
• The hospitals have fixed budgets for the linen department, which often forces them to<br />
use Autoclaved washable (reusable) operation theatre garments. In the wake of the<br />
rising cases of AIDS and other infectious diseases in India, combination of washable<br />
and disposable apparels has made inroads into the hospitals. Disposable clothings are<br />
used only in major surgeries like cardiac, neurology and that too only in bigger<br />
hospitals.<br />
• The penetration of the disposable nonwoven apparel is quite slow due to the high<br />
cost of importing these finished products or the roll goods to produce them.<br />
Imported disposable due to the various duties, local taxes and distribution costs,<br />
are expensive in relation to the reusables medical products.<br />
III. Low hygiene awareness<br />
• The concern about the health and hygiene is very low in India as compared to the<br />
other parts of the world were nonwovens form a dominant part of the healthcare<br />
textiles.<br />
• Disposables involve heavy one time investment which all the Indian hospitals cannot<br />
afford. Hence only the big hospitals use these disposables for their important<br />
surgeries, amount which can be easily recovered from the operation bills.<br />
IV. Pricing policies of the nonwovens<br />
• Compared to the reusable products, the hospitals are of the opinion that the<br />
nonwovens turn out to be a costlier proposition.<br />
• This misconception has to changed and the cost considerations have been provided in<br />
the detailed cost comparison chart shown later in Annexure 9.1<br />
V. Disposing problems<br />
• Due to disposal problems in India, not much efforts are taken to promote the<br />
nonwovens, single use items. The healthcare officials are quite unsure of the safety<br />
and hygiene of the disposable nonwovens, hence they prefer the autoclaved products<br />
where atleast the quality and hygiene is assured.<br />
VI. Availability of cheap washing facilities favouring reusable cotton garments<br />
• Textile fabrics used for the medical applications should be lint free. In cellulose types<br />
of nonwoven fabrics, fibres from the fabrics come off. Sterilisation of these apparels<br />
198
Appendix – 5A (Contd…)<br />
are necessary and cellulose type of fabrics can be sterilised only by Gamma radiation<br />
which is a costly affair. Hence for apparels mostly woven manmade cloth is used<br />
which are reusable and can be sterilized easily.<br />
are shown below:<br />
Based on the market feedback the assumed penetration levels for disposable Healthcare products<br />
2001 - 02 2003 - 04 2007 - 08<br />
Beddings 1% 5% 20%<br />
Clothings 10% 20% 50%<br />
Covers 5% 10% 30%<br />
9.14 Because of these reasons, the current usage practice among all the hospitals is to<br />
procure the cloth in bulk from the mills and then cut into the desired sizes for the gowns,<br />
apparels, etc. Most of the hospitals cut the caps out of the same cloth leftovers after using<br />
the major portion for cutting the gowns and other operating theatre garments. The other<br />
protective garments required in the hospitals such as doctor’s caps, staff uniform etc. are<br />
customized as per the requirements of each hospital.<br />
9.15 The current and future market potential for the healthcare disposable products is<br />
as shown below:<br />
2001-02<br />
Estimated<br />
Reusable / Washable Textiles Demand for Nonwovens<br />
2003 - 04<br />
Estimated<br />
2007 - 08<br />
Projected<br />
Beddings Rs. 73.00 cr. Rs. 94.87 cr. Rs. 160.23<br />
cr.<br />
2001 - 02<br />
Estimated<br />
2003 - 04<br />
Estimated<br />
2007 - 08<br />
Projected<br />
Rs. 0.73 cr. Rs. 4.74 cr. Rs. 32.05 cr.<br />
(15.66) (20.35) (34.37) (62.02 T) (403.02 T) (2722.74T)<br />
Clothings Rs. 20.00 cr. Rs. 25.99 cr. Rs. 43.90 cr. Rs. 2.00 cr. Rs. 5.20 cr. Rs. 21.95 cr.<br />
(4.00) (5.20) (8.78) (177.38 T) (461.06 T) (1946.76 T)<br />
Covers Rs. 9.30 cr. Rs. 12.09 cr. Rs. 20.41 cr. Rs. 0.47 cr. Rs. 1.21 cr. Rs. 6.12 cr.<br />
(1.97) (4.49) (7.59) (40.26 T) (104.64 T) (530.21 T)<br />
Total Rs. 102.3 cr. Rs. 132.95 cr. Rs. 224.54<br />
cr.<br />
Rs. 3.20 cr. Rs. 11.15 cr. Rs. 120.24 cr.*<br />
(21.64) (30.04) (50.74) (279.67 T) (968.72 T) (10399.42 T)<br />
Fig. in brackets denote volume in mn. mt.<br />
* Includes 100 % export on total of Rs. 60.12 Cr (5199.71 T)<br />
199
Appendix – 5A (Contd…)<br />
SECTI<strong>ON</strong> II : MANUFACTURING TECHNOLOGY AND EQUIPMENTS<br />
Process Description:<br />
SUPPLIERS<br />
9.16 The main raw material is the Spunbond Nonwovens. For Medical Disposable<br />
Masks, the number of the spunbond nonwoven rolls depends on the number of layers (2-<br />
ply / 3-ply).<br />
Spunbond Rolls<br />
Collection<br />
drum<br />
Nonwoven<br />
Wrapping<br />
Product<br />
Stacking<br />
Process Flow Chart for Masks Manufacturing<br />
Addition of the tie<br />
tape / Elastic<br />
Sealing the 2<br />
layers of the<br />
masks<br />
Slitting the<br />
masks into<br />
desired sizes<br />
Adhesive / Glue<br />
Application<br />
Product<br />
Cutting<br />
Introduction of<br />
the three<br />
grooves on the<br />
mask<br />
Confirming of<br />
these marks<br />
Tab-end<br />
Sealing<br />
Conveyor<br />
9.17 The manufacturing process for the caps, drapes and gowns involves the stitching of the pre-cut<br />
sizes of the respective items on the sewing machines.<br />
200
Product Composition:<br />
Appendix – 5A (Contd…)<br />
9.18 Currently in India, these healthcare disposable items are manufactured using<br />
spunbond nonwoven fabric. But they can also be made using spunlace fabric subject to<br />
the relative technical advantages and cost considerations.<br />
9.19 This point was reascertained after discussions with two of the major suppliers of<br />
healthcare products, namely, Safetec Disposables, Healthcare Disposables, etc.<br />
Machinery Suppliers and Specifications: (Technology & Equipment Suppliers)<br />
9.20 Globally, the well known technology suppliers with proven track record contacted<br />
by TECS are:<br />
1. NCM Nonwoven Converting Machinery Co. Ltd. (Taiwan),<br />
2. Healthy Machinery Co. Ltd. (Taiwan)<br />
Note: The list contains the leading global players in Healthcare Disposables<br />
Technology and based on discussion with Industry experts the above list<br />
is exhaustive.<br />
9.21 TECS has received responses and machinery quotations. These companies donot have any Indian<br />
representative.<br />
Recommended Minimum Economic Size:<br />
9.22 The proposed Healthcare Disposable project to be set up in India will have a designed capacity of:<br />
Items Designed Capacity<br />
Caps 100 caps per min<br />
Masks 120 masks per min<br />
Gowns 50 gowns per hour<br />
Drapes 75 drapes per hour<br />
Aprons 50 aprons per hour<br />
Beddings 50 beddings per hour<br />
201
Appendix – 5A (Contd…)<br />
9.23 Under Indian operating conditions it is safer to assume machine efficiency factor of 75% with the<br />
plant operating for 300 working days, and therefore the production would be:<br />
Items Operating Capacity Shifts in operation<br />
Caps 75 caps per min Two Shifts<br />
Masks 90 masks per min Two Shifts<br />
Gowns 38 gowns per hour One Shift<br />
Drapes 56 drapes per hour One Shift<br />
Aprons 38 drapes per hour One Shift<br />
Beddings 38 beddings per hour One Shift<br />
Other Technologies Available for Producing the Products:<br />
9.24 Currently in India, these healthcare disposable items are manufactured using<br />
spunbond nonwoven fabric. But in they can also be manufactured using spunlace fabric<br />
subject to cost economics.<br />
Process Systems and Equipments<br />
9.25 The major equipments for the healthcare disposable machinery are:<br />
1. Machinery for Masks:<br />
• Blank Masks Making Machinery,<br />
• Ear Loop Sealing Machine,<br />
• Tie-Tape Sealing Machinery,<br />
• Packing Machinery.<br />
2. Sewing Machines are required for Caps, gowns, Drapes, etc. to stitch the pre-<br />
cut sizes of the respective items.<br />
9.26 The total investment for the plant and machinery for these disposable projects is<br />
given in Exhibit 8.1 and as per the indicative budgetary quotations , the investment in<br />
the process plant and machinery will be Rs 1.11 crores (FOB), inclusive of a discount<br />
of 10%. Finer details on the Equipment listing, specification and the quotations need to<br />
202
Appendix – 5A (Contd…)<br />
be discussed with the technology supplier before the project is taken up. Taking into<br />
account the CIF value, the custom duties (5%), inland transportation and<br />
loading/unloading (2%), erection and commissioning (5%), the installed cost of process<br />
equipment would be Rs 1.27 crores.<br />
9.27 The machinery mentioned above is product specific and cannot be used for<br />
manufacturing any other products.<br />
SECTI<strong>ON</strong> III : PROJECT COST & FINANCIALS<br />
Land<br />
9.28 The total requirement of land for this project keeping in mind the possible future<br />
expansion is around 1000 Sq. Mtrs. ( 0.25 acres ).<br />
9.29 Based on the available information the cost of land is assumed at Rs 1200 per<br />
square meter (including the developmental cost). Depending on the exact location of the<br />
project to be determined by the promoter the land cost could be higher or lower. Hence<br />
the total cost of developed land will be Rs 0.12 crores (Rs 12 lakhs).<br />
Buildings<br />
9.30 The building area comprising of main factory building, godowns, office , R & D<br />
labs / In-house Testing centre etc. would be 500 sq. mtrs. The cost of construction would<br />
again vary depending on the structure and the materials to be used. It has been assumed<br />
that the average cost of construction would be Rs 4500 per sq. mtr. Thus the total cost of<br />
building and other civil works would be around Rs 0.23 crores (Rs. 23 lakhs).<br />
Plant and Machinery<br />
9.31 Details of Plant and machinery as well as technology required for the project have been presented<br />
in earlier Section II . The installed cost of plant and machinery would be Rs 1.27 crores.<br />
9.32 Apart from the main process equipments the utilities required are:<br />
• Electricals,<br />
• Piping,<br />
• Water supply,<br />
• Compressors,<br />
• Fire Fighting equipments etc.<br />
9.33 The provision on this count is taken as 5% of the cost of machinery which works out to Rs 0.06<br />
crores (Rs 6 lakhs)<br />
203
Testing Equipments<br />
Appendix – 5A (Contd…)<br />
9.34 This project does not require heavy investments in testing facilities. An<br />
investment of Rs. 0.05 crores (Rs. 5 lakhs) for Weighing Balance, Rulers, Elongation,<br />
bonding strength, breaking strength etc. would be sufficient.<br />
Miscellaneous Fixed Assets<br />
9.35 Under this head the items included are Furniture and fixtures, Office equipments,<br />
Air Conditioners etc. and a provision of around Rs 0.10 crore (Rs 10 lakhs) is made.<br />
Project Engineering and Consulting<br />
9.36 Under this head the items included are the fees and expenses on account of Architect fees, project<br />
engineering and management (both local and overseas ), detailed project reports etc.<br />
Preliminary & Preoperative Expenses<br />
9.37 The items included under this head are company formation expenses, public issue<br />
expenses (if any), interest during construction, pre production expenses during the<br />
implementation phase etc.<br />
Contingency Expenses<br />
9.38 Depending on the gestation period and further detailing of the project cost by the<br />
promoter, the contingency provision has been made at the rate of 10%.<br />
Margin Money for Working capital<br />
9.39 The margin money for working capital forming part of the total project cost would<br />
be Rs 0.25 crores (Rs. 25 lakhs). [Exhibit 9.3]<br />
Total Project Cost (Total Investment)<br />
9.40 The total project cost as given in Exhibit 9.1 would be Rs 2.53 crores.<br />
Project Funding and Financing Pattern<br />
9.41 It has been assumed that the project would be financed through long term funds<br />
and Equity participation by the Promoter / Public. The technical textile sector being a<br />
high priority area , it is assumed that a Debt- Equity ratio of 1.5 : 1 would be feasible.<br />
(However the sensitivity analysis has also been presented for 1 : 1 and 2 : 1 Debt Equity<br />
ratio.<br />
204
Sales, Profitability and Sensitivity Analysis :<br />
Sales Realisation and Turnover<br />
Appendix – 5A (Contd…)<br />
9.42 As per the details available from the Technology and Equipment suppliers the<br />
economic size of a plant for the various disposable products would be as follows:<br />
Items Economic Size Plant<br />
Caps 100 caps per min<br />
Masks 120 masks per min<br />
Gowns 50 gowns per hour<br />
Drapes 75 drapes per hour<br />
Aprons 50 aprons per hour<br />
Beddings 50 beddings per hour<br />
9.43 Under the Indian conditions, it is assumed that the machine would operate at an efficiency level of<br />
75%. Hence the production from the plant operating 300 working days in a year would be:<br />
Items Operating Capacity Shifts in operation<br />
Caps 75 caps per min Two Shifts<br />
Masks 90 masks per min Two Shifts<br />
Gowns 38 gowns per hour One Shift<br />
Drapes 56 drapes per hour One Shift<br />
Aprons 38 aprons per hour One Shift<br />
Beddings 38 beddings per hour One Shift<br />
9.44 The capacity utilisation for the 1st year is assumed at 50% and thereafter for 2nd, 3rd and 4th year<br />
onwards 60%, 75% and 90% respectively.<br />
205
Appendix – 5A (Contd…)<br />
9.45 The average selling price of the end products (net of excise duties, sales tax and<br />
other incidental expenses) would be:<br />
Items Average Selling Price Unit<br />
Domestic Market<br />
Caps Rs 1.50<br />
Masks Rs 1.50<br />
Gowns Rs 90.00<br />
Drapes Rs 30.00<br />
Aprons Rs. 15.00<br />
Beddings Rs 90.00<br />
9.46 The international prices for caps, masks, gowns, drapes, aprons, beddings are 1.8<br />
cents, 2 cents, $1, 60 cents, 10 cents, $1 respectively. On these prices, the import duty,<br />
CVD, margins, etc. are added.<br />
9.47 The details of projected sales turnover as projected are given in Exhibit 9.2 (A-F).<br />
Cost of Production<br />
Major Raw materials and their specifications:<br />
9.48 The major raw materials required for manufacturing these disposable products are the spunbond<br />
polypropylene fabrics. These fabrics are currently imported by the Indian manufacturers.<br />
Major Raw Materials International Price Landed Cost<br />
Nonwoven US $1.6 - 1.8 Rs. 110 - 120 per kg<br />
9.49 The spunbond fabrics are used in various gsm range depending on their applications, for caps and<br />
masks spunbond fabric of 30 gsm is used, for gowns, drapes, etc. gsm range of around 40 is preferred while<br />
beddings use higher gsm of around 80.<br />
9.50 These healthcare textiles are manufactured in the country from the imported spunbond fabric<br />
available at US$1.6-1.8 per kg.<br />
206
Conversion Cost<br />
Appendix – 5A (Contd…)<br />
9.51 The conversion cost will include the cost of power, water, chemicals and additives,<br />
consumables etc., which is assumed at 5% of the cost of raw material.<br />
Manpower, Salaries and Wages<br />
9.52 The manpower requirements and the salary structure is given in Exhibit 9.4.<br />
9.53 The total manpower requirement comprising the managerial cadre of supervisors,<br />
machine operators and helpers would be 58 persons. The total wage bill come to around<br />
Rs 0.75 crores.<br />
Factory and Overhead Expenses<br />
9.54 The items covered under this head are establishment expenses, repairs and maintenance, stationery,<br />
travel expenses, packaging expenses etc.<br />
Marketing and Promotional Expenses<br />
9.55 The promotion of technical textiles will call for expenditure on this count and a provision of 5%<br />
of the annual sales has been made uniformly over the years.<br />
Interest and Depreciation<br />
9.56 The prevailing interest rate for long term and short term borrowed funds is assumed at 5% and<br />
11% per annum (Project included under Technology Upgradation Fund).<br />
9.57 The repayment of loans has been assumed for 10 years with a moratorium period<br />
of two years (2+8).<br />
9.58 The depreciation rates have been worked out as per Company’s act (SLM) and<br />
Income-Tax Ready Reckoner (WDV).<br />
9.59 The current corporate tax rate is assumed at 35 % and the surcharge is assumed at<br />
2.5% per annum.<br />
Profitability, Break-even, IRR, and Payback<br />
9.60 As presented in Exhibit 9.5, the sales turnover increases from Rs 4.57 crore in the<br />
first year to Rs 8.19 crore from the 4th year.<br />
9.61 The PBT increases from Rs 0.25 crore in the third year to Rs 0.52 crore in the fourth year onwards.<br />
207
9.62 The Break Even of the project is at 76.29 %.<br />
9.63 The Internal Rate of Return ( IRR ) has been worked out at 9.80%.<br />
9.64 The Payback period for the project is 7.09 years.<br />
Sensitivity Analysis<br />
9.65 The sensitivity analysis has been presented in the Exhibit 9.6.<br />
DEVELOPMENTAL AND PROMOTI<strong>ON</strong>AL MEASURES.<br />
Appendix – 5A (Contd…)<br />
9.66 The standards applicable for these items are: EN 46002, MDD (TUV Rheinland).<br />
However there are no standards for such products in India. Hence a need is felt to develop<br />
these standards in the country.<br />
9.67 The Indian government needs to introduce regulations similar to those in the U.<br />
S. like, Occupational Safety and Health Administration (OSHA) regulations etc.,<br />
which will convince the users of the good quality and the hygiene of the product.<br />
9.68 There is a good scope for the exports of masks and caps to the European countries.<br />
But for such exports “CE Certification” is mandatory which costs around Rs. 5 lakhs.<br />
The Government helps with only a part of the amount and hence the Indian players sell<br />
the product to Turkey (which accepts without CE certification) and then in turn it is<br />
exported to the other countries of the European Union. Hence we loose out on valuable<br />
Foreign Exchange.<br />
9.69 The total import duty on the raw materials is very high in the country as<br />
compared to the global markets where the total duties are not more than 5%. This<br />
makes our products uncompetitive in the global markets.<br />
9.70 Detailed Testing is not required for the products like Gowns, Drapes, etc., only<br />
test for bacteria filtration are performed for masks. The players manufacturing these<br />
products in India get these tests performed from the US Laboratories which are<br />
recognised globally.<br />
9.71 The absence of any such well recognised and standard laboratory creates<br />
economic problems for the manufacturers who have to spend huge amounts to get their<br />
products certified.<br />
9.72 Even countries like China and Japan have their own testing laboratories and on<br />
their model, even India can think of setting up a standardised teasing laboratory of help to<br />
all the players in the industry.<br />
208
Appendix – 5A (Contd…)<br />
9.73 SASMIRA can take a lead role by establishing small testing laboratories which<br />
can also serve as the Central Testing Laboratory for the country.<br />
9.74 Currently the requirement of spunbond fabric is met by imports, hence the raw<br />
material has to be stocked for 3 months. If good quality product is available, then such a<br />
high block up of capital would not be necessary.<br />
9.75 The Government and the manufacturers have to assume a proactive approach to<br />
promote the usage of the disposable products in the country. Some of the steps in this<br />
direction can be:<br />
• Single use nonwovens eliminate the potential for problems associated with<br />
the disposal of potentially infected liquids or wastewater.<br />
• With the rising water shortage, the consumption of disposable nonwovens<br />
will eventually increase. As the cost of washing a reusable cotton gown<br />
becomes higher, the people will shift to disposable gowns, hence a cost<br />
comparison of the two has to be shown.<br />
• The cost of using the textiles is higher as they must be cleaned with<br />
detergent, wrapped in separate plastic covers or bags and then labeled.<br />
Nonwovens are seen to be less expensive as the patient or the hospital needs<br />
to open it, use it and throw away, thus proving very cost effective. However<br />
this concept of cost saving is not that pronounced with the high one time<br />
cash out-go taken into consideration.<br />
• With increasing awareness about hygiene and traditional textiles being<br />
replaced by nonwovens, the safety factor of the disposable nonwovens is<br />
extremely appealing.<br />
• With the increasing incomes of the people and the availability of greater<br />
disposable incomes, the people undergoing the operations would readily<br />
spare a few more rupees for the cost of the nonwovens after understanding<br />
the immense benefits offered.<br />
• R&D efforts are underway in the developed countries to produce non<br />
wovens with increased barrier resistance while making them softer and<br />
more comfortable, thus improving the comfort of the wearer. Hence a<br />
proactive approach by the Indian manufacturers can help the cause.<br />
209
Appendix – 5A (Contd…)<br />
• Protective clothing for patients and surgeons drapes, which have proven<br />
to be infection free represent the greatest enduse potential for disposable<br />
nonwoven fabrics. Spunbond fabrics are preferred because of their low cost,<br />
which allows one time use and thus minimises sterilisation procedures<br />
• The rise of the diseases and the resistant strains being developed emphasizes<br />
the need for higher fluid protection in medical devices.<br />
9.76 Consequently, the nonwoven fabrics can be produced at mass-production<br />
facilities which in turn would reduce the cost of the products, thereby further increasing<br />
the volume of nonwovens used in the medical field.<br />
9.77 The government should accord the hospital hygiene and safety a priority basis<br />
as they are often a breeding ground for germs and diseases. Once the importance and<br />
advantages of disposables are imprinted upon the minds of the hospitals and the users the<br />
demand for these products would start increasing.<br />
210
Exhibit 9.1<br />
PROJECT COST<br />
(LAND, BUILDINGS, PROCESS PLANT & MACHINERY, UTILITIES & O<strong>THE</strong>R ASSETS)<br />
Project Cost (Rs. Cr.)<br />
1 Land: 0.12<br />
Area: 0.25 acres ( 1000 Sq Mtrs)<br />
Rate: (Rs.1200 /Sq. Mtr)<br />
2 Buildings 0.23<br />
(Plant Area, Office, Godown, Lab, Service Area etc.)<br />
Built-up Area : 500 Sq. Mtrs<br />
Avg Rate : Rs.4500 /Sq. Mtrs<br />
3 Process Plant & Equipment 1.27<br />
4 Utility & Other equipments (5%) 0.06<br />
(Power, Water, Compressor, Humidity Control,<br />
Fire Fighting, Material Handling etc.)<br />
5 Misc. Fixed Assets 0.10<br />
(Furniture & Fixtures, Office Equipment, etc.)<br />
6 Testing Equipments 0.05<br />
7 Project Engineering & Consultancy charges (2.5%) 0.04<br />
8 Preliminary & Pre-operative Expenses (12%) 0.20<br />
(Company Formation, Interest during construction,<br />
pre-production expenses, etc.)<br />
9 Contingency (10 %) 0.21<br />
10 Total 2.28<br />
11 Margin Money for Working Capital 0.25<br />
12 Total Project Cost 2.53<br />
211
EXHIBIT 9.2<br />
ESTIMATI<strong>ON</strong> <strong>OF</strong> SALES REVENUE<br />
(Rs. Cr.)<br />
ITEM YEAR <strong>OF</strong> OPERATI<strong>ON</strong><br />
I II III IV V VI VII VIII IX X<br />
Sales Revenue<br />
Caps 1.59 1.91 2.38 2.86 2.86 2.86 2.86 2.86 2.86 2.86<br />
Masks 1.91 2.29 2.86 3.43 3.43 3.43 3.43 3.43 3.43 3.43<br />
Aprons 0.07 0.08 0.10 0.12 0.12 0.12 0.12 0.12 0.12 0.12<br />
Drapes 0.20 0.24 0.30 0.36 0.36 0.36 0.36 0.36 0.36 0.36<br />
Gowns 0.40 0.48 0.60 0.71 0.71 0.71 0.71 0.71 0.71 0.71<br />
Beddings 0.40 0.48 0.60 0.71 0.71 0.71 0.71 0.71 0.71 0.71<br />
Total 4.55 5.46 6.83 8.19 8.19 8.19 8.19 8.19 8.19 8.19<br />
% Contribution<br />
Raw Material<br />
Caps 1.23 1.48 1.85 2.22 2.22 2.22 2.22 2.22 2.22 2.22<br />
Masks 1.39 1.67 2.08 2.50 2.50 2.50 2.50 2.50 2.50 2.50<br />
Aprons 0.03 0.04 0.05 0.06 0.06 0.06 0.06 0.06 0.06 0.06<br />
Drapes 0.06 0.07 0.08 0.10 0.10 0.10 0.10 0.10 0.10 0.10<br />
Gowns 0.07 0.08 0.10 0.12 0.12 0.12 0.12 0.12 0.12 0.12<br />
Beddings 0.32 0.38 0.47 0.57 0.57 0.57 0.57 0.57 0.57 0.57<br />
Total 3.09 3.71 4.64 5.57 5.57 5.57 5.57 5.57 5.57 5.57<br />
212
Exhibit 9.2 (A)<br />
ESTIMATI<strong>ON</strong> <strong>OF</strong> SALES REVENUE: CAPS<br />
(Rs. Cr.)<br />
ITEM YEAR <strong>OF</strong> OPERATI<strong>ON</strong><br />
I II III IV V VI VII VIII IX X<br />
Average Production per min 100 100 100 100 100 100 100 100 100 100<br />
75% efficiency 75 75 75 75 75 75 75 75 75 75<br />
Capacity Utilisation 50% 60% 75% 90% 90% 90% 90% 90% 90% 90%<br />
Actual Production per min (pcs) 38 45 56 68 68 68 68 68 68 68<br />
Actual Production per hr (pcs) 2250 2700 3375 4050 4050 4050 4050 4050 4050 4050<br />
Production per day (pcs) 36000 43200 54000 64800 64800 64800 64800 64800 64800 64800<br />
(Two Shift Operations)<br />
Production for 300 working days (pcs) 10800000 12960000 16200000 19440000 19440000 19440000 19440000 19440000 19440000 19440000<br />
Selling Price (Rs / cap) 1.50 1.50 1.50 1.50 1.50 1.50 1.50 1.50 1.50 1.50<br />
Sales Revenue (Rs. Cr) 1.62 1.94 2.43 2.92 2.92 2.92 2.92 2.92 2.92 2.92<br />
Value Loss ( 2% ) 0.03 0.04 0.05 0.06 0.06 0.06 0.06 0.06 0.06 0.06<br />
Net Sales Revenue (Rs. Cr) 1.59 1.91 2.38 2.86 2.86 2.86 2.86 2.86 2.86 2.86<br />
213
Exhibit 9.2 (B)<br />
ESTIMATI<strong>ON</strong> <strong>OF</strong> SALES REVENUE: MASKS<br />
ITEM YEAR <strong>OF</strong> OPERATI<strong>ON</strong><br />
I II III IV V VI VII VIII IX X<br />
Average Production per min 120 120 120 120 120 120 120 120 120 120<br />
75% efficiency 90 90 90 90 90 90 90 90 90 90<br />
Capacity Utilisation 50% 60% 75% 90% 90% 90% 90% 90% 90% 90%<br />
Actual Production per min (pcs) 45 54 68 81 81 81 81 81 81 81<br />
Actual Production per hr (pcs) 2700 3240 4050 4860 4860 4860 4860 4860 4860 4860<br />
Production per day (pcs) 43200 51840 64800 77760 77760 77760 77760 77760 77760 77760<br />
(Two Shift Operations)<br />
Production for 300 working days (pcs) 12960000 15552000 19440000 23328000 23328000 23328000 23328000 23328000 23328000 23328000<br />
Selling Price (Rs / mask) 1.50 1.50 1.50 1.50 1.50 1.50 1.50 1.50 1.50 1.50<br />
Sales Revenue (Rs. Cr) 1.94 2.33 2.92 3.50 3.50 3.50 3.50 3.50 3.50 3.50<br />
Value Loss ( 2% ) 0.04 0.05 0.06 0.07 0.07 0.07 0.07 0.07 0.07 0.07<br />
Net Sales Revenue (Rs. Cr) 1.91 2.29 2.86 3.43 3.43 3.43 3.43 3.43 3.43 3.43<br />
214<br />
(Rs. Cr.)
Exhibit 9.2 (C)<br />
ESTIMATI<strong>ON</strong> <strong>OF</strong> SALES REVENUE: APR<strong>ON</strong>S<br />
(Rs. Cr.)<br />
ITEM YEAR <strong>OF</strong> OPERATI<strong>ON</strong><br />
I II III IV V VI VII VIII IX X<br />
Average Production per hour 50 50 50 50 50 50 50 50 50 50<br />
75% efficiency 38 38 38 38 38 38 38 38 38 38<br />
Capacity Utilisation 50% 60% 75% 90% 90% 90% 90% 90% 90% 90%<br />
Actual Production per hr (pcs) 19 23 28 34 34 34 34 34 34 34<br />
Production per day (pcs) 150 180 225 270 270 270 270 270 270 270<br />
(One Shift Operations)<br />
Production for 300 working days (pcs) 45000 54000 67500 81000 81000 81000 81000 81000 81000 81000<br />
Selling Price (Rs / aprons) 15 15 15 15 15 15 15 15 15 15<br />
Sales Revenue (Rs. Cr) 0.07 0.08 0.10 0.12 0.12 0.12 0.12 0.12 0.12 0.12<br />
Value Loss ( 2% ) 0.00135 0.00162 0.002025 0.00243 0.00243 0.00243 0.00243 0.00243 0.00243 0.00243<br />
Net Sales Revenue (Rs. Cr) 0.07 0.08 0.10 0.12 0.12 0.12 0.12 0.12 0.12 0.12<br />
215
Exhibit 9.2 (D)<br />
ESTIMATI<strong>ON</strong> <strong>OF</strong> SALES REVENUE: DRAPES<br />
(Rs. Cr.)<br />
ITEM YEAR <strong>OF</strong> OPERATI<strong>ON</strong><br />
I II III IV V VI VII VIII IX X<br />
Average Production per hour 75 75 75 75 75 75 75 75 75 75<br />
75% efficiency 56 56 56 56 56 56 56 56 56 56<br />
Capacity Utilisation 50% 60% 75% 90% 90% 90% 90% 90% 90% 90%<br />
Actual Production per hr (pcs) 28 34 42 51 51 51 51 51 51 51<br />
Production per day (pcs) 225 270 338 405 405 405 405 405 405 405<br />
(One Shift Operations)<br />
Production for 300 working days (pcs) 67500 81000 101250 121500 121500 121500 121500 121500 121500 121500<br />
Selling Price (Rs / drape) 30 30 30 30 30 30 30 30 30 30<br />
Sales Revenue (Rs. Cr) 0.20 0.24 0.30 0.36 0.36 0.36 0.36 0.36 0.36 0.36<br />
Value Loss ( 2% ) 0.00405 0.00486 0.006075 0.00729 0.00729 0.00729 0.00729 0.00729 0.00729 0.00729<br />
Net Sales Revenue (Rs. Cr) 0.20 0.24 0.30 0.36 0.36 0.36 0.36 0.36 0.36 0.36<br />
216
Exhibit 9.2 (E)<br />
ESTIMATI<strong>ON</strong> <strong>OF</strong> SALES REVENUE: GOWNS<br />
(Rs. Cr.)<br />
ITEM YEAR <strong>OF</strong> OPERATI<strong>ON</strong><br />
I II III IV V VI VII VIII IX X<br />
Average Production per hour 50 50 50 50 50 50 50 50 50 50<br />
75% efficiency 38 38 38 38 38 38 38 38 38 38<br />
Capacity Utilisation 50% 60% 75% 90% 90% 90% 90% 90% 90% 90%<br />
Actual Production per hr (pcs) 19 23 28 34 34 34 34 34 34 34<br />
Production per day (pcs) 150 180 225 270 270 270 270 270 270 270<br />
(One Shift Operations)<br />
Production for 300 working days (pcs) 45000 54000 67500 81000 81000 81000 81000 81000 81000 81000<br />
Selling Price (Rs / gown) 90 90 90 90 90 90 90 90 90 90<br />
Sales Revenue (Rs. Cr) 0.41 0.49 0.61 0.73 0.73 0.73 0.73 0.73 0.73 0.73<br />
Value Loss ( 2% ) 0.01 0.01 0.01 0.01 0.01 0.01 0.01 0.01 0.01 0.01<br />
Net Sales Revenue (Rs. Cr) 0.40 0.48 0.60 0.71 0.71 0.71 0.71 0.71 0.71 0.71<br />
217
Exhibit 9.2 (F)<br />
ESTIMATI<strong>ON</strong> <strong>OF</strong> SALES REVENUE: BEDDINGS<br />
(Rs. Cr.)<br />
ITEM YEAR <strong>OF</strong> OPERATI<strong>ON</strong><br />
I II III IV V VI VII VIII IX X<br />
Average Production per hour 50 50 50 50 50 50 50 50 50 50<br />
75% efficiency 38 38 38 38 38 38 38 38 38 38<br />
Capacity Utilisation 50% 60% 75% 90% 90% 90% 90% 90% 90% 90%<br />
Actual Production per hr (pcs) 19 23 28 34 34 34 34 34 34 34<br />
Production per day (pcs) 150 180 225 270 270 270 270 270 270 270<br />
(One Shift Operations)<br />
Production for 300 working days (pcs) 45000 54000 67500 81000 81000 81000 81000 81000 81000 81000<br />
Selling Price (Rs / bedding) 90 90 90 90 90 90 90 90 90 90<br />
Sales Revenue (Rs. Cr) 0.41 0.49 0.61 0.73 0.73 0.73 0.73 0.73 0.73 0.73<br />
Value Loss ( 2% ) 0.01 0.01 0.01 0.01 0.01 0.01 0.01 0.01 0.01 0.01<br />
Net Sales Revenue (Rs. Cr) 0.40 0.48 0.60 0.71 0.71 0.71 0.71 0.71 0.71 0.71<br />
218
Factory Related<br />
Exhibit 9.3<br />
REQUIREMENT <strong>OF</strong> WORKING CAPITAL<br />
ITEM NO. <strong>OF</strong> MARGIN YEAR I YEAR II YEAR III YEAR IV<br />
(Rs.Lakhs)<br />
YEAR V<br />
M<strong>ON</strong>THS (%) W.CAP MARGIN BANK W.CAP MARGIN BANK W.CAP MARGIN BANK W.CAP MARGIN BANK W.CAP MARGIN BANK<br />
REQMT M<strong>ON</strong>EY FINANCE REQMT M<strong>ON</strong>EY FINANCE REQMT M<strong>ON</strong>EY FINANCE REQMT M<strong>ON</strong>EY FINANCE REQMT M<strong>ON</strong>EY FINANCE<br />
Raw materials & other commodities 1.00 25.00 0.26 0.06 0.19 0.31 0.08 0.23 0.39 0.10 0.29 0.46 0.12 0.35 0.46 0.12 0.35<br />
Finished Goods 1.00 25.00 0.37 0.09 0.28 0.43 0.11 0.32 0.52 0.13 0.39 0.61 0.15 0.46 0.61 0.15 0.46<br />
A/c Receivable 1.00 25.00 0.38 0.09 0.28 0.46 0.11 0.34 0.57 0.14 0.43 0.68 0.17 0.51 0.68 0.17 0.51<br />
Cash in hand<br />
Salaries & wages 1.00 0.00 0.06 0.00 0.06 0.07 0.00 0.07 0.07 0.00 0.07 0.07 0.00 0.07 0.08 0.00 0.08<br />
Utilities 1.00 0.00 0.01 0.00 0.01 0.02 0.00 0.02 0.02 0.00 0.02 0.02 0.00 0.02 0.02 0.00 0.02<br />
Advertising & Promotional Expenses 1.00 0.00 0.02 0.00 0.02 0.02 0.00 0.02 0.03 0.00 0.03 0.03 0.00 0.03 0.03 0.00 0.03<br />
Admin. Overheads 1.00 0.00 0.02 0.00 0.02 0.02 0.00 0.02 0.02 0.00 0.02 0.02 0.00 0.02 0.02 0.00 0.02<br />
Total Requirement 1.10 0.25 0.85 1.30 0.30 1.00 1.59 0.37 1.23 1.89 0.44 1.45 1.90 0.44 1.46<br />
219
Factory Related<br />
Exhibit 9.3 Contd.<br />
REQUIREMENT <strong>OF</strong> WORKING CAPITAL<br />
ITEM NO. <strong>OF</strong> MARGIN YEAR VI YEAR VII YEAR VIII YEAR IX<br />
(Rs.Lakhs)<br />
YEAR X<br />
M<strong>ON</strong>THS (%) W.CAP MARGIN BANK W.CAP MARGIN BANK W.CAP MARGIN BANK W.CAP MARGIN BANK W.CAP MARGIN BANK<br />
REQMT M<strong>ON</strong>EY FINANCE REQMT M<strong>ON</strong>EY FINANCE REQMT M<strong>ON</strong>EY FINANCE REQMT M<strong>ON</strong>EY FINANCE REQMT M<strong>ON</strong>EY FINANCE<br />
Raw materials & other commodities 1.00 25.00 0.46 0.12 0.35 0.46 0.12 0.35 0.46 0.12 0.35 0.46 0.12 0.35 0.46 0.12 0.35<br />
Finished Goods Stock 1.00 25.00 0.62 0.16 0.47 0.63 0.16 0.47 0.63 0.16 0.48 0.64 0.16 0.48 0.65 0.16 0.49<br />
A/c Receivable 1.00 25.00 0.68 0.17 0.51 0.68 0.17 0.51 0.68 0.17 0.51 0.68 0.17 0.51 0.68 0.17 0.51<br />
Cash in hand<br />
Salaries & wages 1.00 0.00 0.08 0.00 0.08 0.09 0.00 0.09 0.10 0.00 0.10 0.10 0.00 0.10 0.11 0.00 0.11<br />
Utilities 1.00 0.00 0.00 0.00 0.00 0.00 0.00 0.00 0.00 0.00 0.00 0.00 0.00 0.00 0.00 0.00 0.00<br />
Advertising & Promotional Expenses 1.00 0.00 0.00 0.00 0.00 0.00 0.00 0.00 0.00 0.00 0.00 0.00 0.00 0.00 0.00 0.00 0.00<br />
Admin. Overheads 1.00 0.00 0.03 0.00 0.03 0.03 0.00 0.03 0.03 0.00 0.03 0.03 0.00 0.03 0.03 0.00 0.03<br />
Total Requirement 1.91 0.44 1.47 1.92 0.44 1.48 1.94 0.45 1.49 1.95 0.45 1.50 1.97 0.45 1.52<br />
220
Exhibit 9.4<br />
MANPOWER REQUIREMENTS (Inclusive of Gowns, Drapes)<br />
Nos Monthly Total Monthly Salary Annual<br />
General Manager 1 30000 30000 360000<br />
Production Manager 1 20000 20000 240000<br />
Machine Operator / Helper 12 6000 72000 864000<br />
Sewing Machine Operators 16 3000 48000 576000<br />
R&D, Testing 2 8000 16000 192000<br />
Marketing Manager & Sales Manager 2 25000 50000 600000<br />
Sales Representatives 12 12000 144000 1728000<br />
Clerical Staff 6 6000 36000 432000<br />
Other Staff 4 3000 12000 144000<br />
Maintenance (Elec. & Mech.) 2 10000 20000 240000<br />
TOTAL 58 448000 5376000<br />
Fringe Benefits (40 % of the above) 2150400<br />
Total Wage Bill (Annual) Rs. lakhs:Salary + Other Benefits = 7526400.00<br />
Total Wage Bill (Annual) Rs. Cr.: 0.75264<br />
221
Exhibit 9.5<br />
PR<strong>OF</strong>ITABILITY STATEMENT AND COMPUTATI<strong>ON</strong> <strong>OF</strong> TAX<br />
(Rs.Cr)<br />
ACCOUNT HEAD FINANCIAL YEAR <strong>OF</strong> OPERATI<strong>ON</strong><br />
I II III IV V VI VII VIII IX X<br />
Revenue<br />
Net Sales Turnover 4.55 5.46 6.83 8.19 8.19 8.19 8.19 8.19 8.19 8.19<br />
Total Revenue 4.55 5.46 6.83 8.19 8.19 8.19 8.19 8.19 8.19 8.19<br />
Expenses<br />
Raw Materials 3.09 3.71 4.64 5.57 5.57 5.57 5.57 5.57 5.57 5.57<br />
Salaries & wages 0.75 0.79 0.83 0.87 0.91 0.99 1.07 1.15 1.24 1.34<br />
Conversion Costs 0.15 0.19 0.23 0.28 0.28 0.28 0.28 0.28 0.28 0.28<br />
Sales, Marketing & Training Expenses 0.23 0.27 0.34 0.41 0.41 0.41 0.41 0.41 0.41 0.41<br />
Factory & Office Overheads 0.19 0.19 0.19 0.19 0.19 0.19 0.19 0.19 0.19 0.19<br />
Interest on S.T. Loans 0.09 0.11 0.13 0.16 0.16 0.16 0.16 0.16 0.17 0.17<br />
Cost of Sales 4.53 5.28 6.38 7.49 7.54 7.61 7.69 7.78 7.87 7.97<br />
Depreciation (St.Line) 0.11 0.11 0.11 0.11 0.11 0.11 0.11 0.11 0.11 0.11<br />
Amort. of Expenses 0.01 0.01 0.01 0.01 0.01 0.01 0.00 0.00 0.00 0.00<br />
Interest on L.T Loan 0.08 0.08 0.07 0.06 0.05 0.04 0.03 0.02 0.01 0.00<br />
Profit Before Tax -0.17 -0.01 0.25 0.52 0.48 0.42 0.35 0.28 0.19 0.10<br />
Tax 0.00 0.00 0.03 0.05 0.04 0.14 0.12 0.10 0.08 0.05<br />
Profit After Tax -0.17 -0.01 0.23 0.46 0.44 0.28 0.23 0.17 0.11 0.05<br />
Dividend 0.00 0.00 0.05 0.05 0.05 0.10 0.10 0.10 0.10 0.10<br />
Profits For Appropriation -0.17 -0.01 0.18 0.41 0.39 0.18 0.13 0.07 0.01 -0.05<br />
COMPUTATI<strong>ON</strong> <strong>OF</strong> TAX<br />
Profit after interest before depreciation -0.06 0.10 0.37 0.63 0.60 0.53 0.47 0.39 0.31 0.21<br />
Depr.(WDV) to be claimed 0.47 0.89 1.07 0.93 0.47 0.14 0.11 0.09 0.08 0.06<br />
Depreciation claimed -0.06 0.10 0.37 0.63 0.47 0.14 0.11 0.09 0.08 0.06<br />
Depr. carried forward 0.53 0.79 0.71 0.30 0.00 0.00 0.00 0.00 0.00 0.00<br />
Taxable Profit 0.00 0.00 0.00 0.00 0.13 0.39 0.36 0.30 0.23 0.15<br />
Profit Before Tax (Book) -0.17 -0.01 0.25 0.52 0.48 0.42 0.35 0.28 0.19 0.10<br />
Minimum Alternate Tax 0.00 0.00 0.03 0.05 0.00 0.00 0.00 0.00 0.00 0.00<br />
Tax (Actual) 0.00 0.00 0.00 0.00 0.04 0.14 0.12 0.10 0.08 0.05<br />
Tax Provision 0.00 0.00 0.03 0.05 0.04 0.14 0.12 0.10 0.08 0.05<br />
222
EXHIBIT 9.6<br />
SENSITIVITY ANALYSIS<br />
HEALTHCARE TEXTILES<br />
Items Profit after Tax<br />
(PAT)<br />
( assumed at 90 %<br />
capacity )<br />
Break<br />
Even<br />
(%)<br />
Appendix – 5A (Contd…)<br />
Internal<br />
Rate of<br />
Return<br />
(IRR)<br />
Payback<br />
Period<br />
NORMAL VALUES 0.46 72.69 9.80 7.09<br />
Debt Equity Ratios<br />
(a) 2:1<br />
(b) 1:1<br />
Increase in Project Cost<br />
(a) 10 %<br />
(b) 20%<br />
0.46<br />
0.47<br />
0.45<br />
0.43<br />
76.60<br />
75.82<br />
77.18<br />
78.07<br />
9.87<br />
9.68<br />
8.73<br />
7.99<br />
7.03<br />
7.18<br />
7.75<br />
8.31<br />
223
Appendix – 5A (Contd…)<br />
224
ANNEXURE 9.1<br />
COST COMPARIS<strong>ON</strong> BETWEEN<br />
DISPOSABLES AND N<strong>ON</strong> DISPOSABLES<br />
COST <strong>OF</strong> CAPS & MASKS<br />
➯ COST <strong>OF</strong> <strong>THE</strong> N<strong>ON</strong>DISPOSABLE CAPS:<br />
Cloth + Stitching = Rs.35.00 (Fixed Cost)<br />
Appendix – 5A (Contd…)<br />
Recurring Cost : Laundry + Sterlisation = Rs.1.50 x 10 cycles = Rs.15.00<br />
Thus total cost = Rs.35.00 + Rs.15.00 = Rs.50.00<br />
Cost per usage = Rs.50.00/10 = Rs.5.00<br />
� Cost of DISPOSABLE Cap : Rs.2.00 - Rs.3.00<br />
➯ COST <strong>OF</strong> <strong>THE</strong> N<strong>ON</strong>DISPOSABLE MASKS:<br />
Cloth + Stitching = Rs.17.50 (Fixed Cost)<br />
Recurring Cost : Laundry + Sterlisation = Rs.1.50 x 10 cycles = Rs.15.00<br />
Thus total cost = Rs.17.50 + Rs.15.00 = Rs.32.50<br />
Cost per usage = Rs.32.50/10 = Rs.3.25<br />
� Cost of DISPOSABLE Mask : Rs.2.00 - Rs.3.00<br />
COST <strong>OF</strong> UNIFORMS<br />
➯ Cost of the N<strong>ON</strong>DISPOSABLE uniform : Cloth + Stitching = Rs.300.00<br />
(Fixed Cost)<br />
Recurring Cost: Laundry + Sterilisation =<br />
Rs.8.00 x 24 cycles (6 months) = Rs.192.00<br />
Thus total cost = Rs.300.00 + Rs.192.00 = Rs.492.00<br />
Cost per usage = Rs.492.00/24 = Rs.20.50<br />
Cost of DISPOSABLE uniform : Rs.115.00<br />
No. of usages = 5<br />
Cost per usage = 115/5 = Rs.23.00<br />
225
Appendix – 5A (Contd…)<br />
3. Cost of disposable v/s non disposables : (Broad indicative costs)<br />
Cost structure of the disposables<br />
Sr.No. Items Cost/piece (Rs.)<br />
1. Caps 2.00 - 3.00<br />
2. Masks 3.00<br />
3. Gowns 200.00 - 250.00<br />
Cost structure of the nondisposables<br />
1.<br />
&<br />
2.<br />
Items Cost per Usage (Rs.)<br />
Caps<br />
&<br />
Masks<br />
The non disposables caps and masks are cut from<br />
the remains of the cloth used for stitching the<br />
gowns/uniforms. There is no separate cloth<br />
purchased for the caps and masks. Hence the<br />
hospitals find it economical to use these; though the<br />
trend is changing rapidly with increasing penetration<br />
of the nonwovens/disposables in this segment.<br />
Caps & Masks are the target product segments in<br />
the nonwovens for wider acceptance. The units<br />
surveyed engaged in nonwoven disposables reveal<br />
that the cost can be further reduced if marketed<br />
directly to the hospitals, once the volumes increase<br />
3. Gowns ➯ Cost of the N<strong>ON</strong>DISPOSABLE gown : Cloth +<br />
Stitching = Rs.200.00 (Fixed Cost)<br />
Recurring Cost : Laundry + Sterilisation =<br />
Rs.8.00 x 24 cycles (6 months) = Rs.192.00<br />
Thus total cost = Rs.200.00 + Rs.192.00 =<br />
Rs.392.00<br />
Cost per usage = Rs.392.00/24 = Rs.16.33<br />
(say Rs.16.00)<br />
➯ Cost of DISPOSABLE gowns : Rs.200.00<br />
No. of usages = 4<br />
Cost per usage = Rs.200.00/4 = Rs.50.00<br />
➯ With the aggressive promotion of<br />
disposables and setting up of large economic<br />
size plants, it should be feasible to reduce<br />
the cost of disposables significantly, thereby<br />
selling the concept to the hospitals on<br />
commercial consideration.<br />
226
SPUNB<strong>ON</strong>D PROJECT<br />
Appendix – 5A (Contd…)<br />
SECTI<strong>ON</strong> I : PRODUCT BRIEF, APPLICATI<strong>ON</strong> AREAS AND<br />
MARKET POTENTIAL<br />
10.1 Spunbond Nonwoven Textiles are not made by conventional weaving or knitting<br />
processes, but are composed of ultra fine continuous fibers made from thermoplastics<br />
which are randomly laid to a web onto a conveyor belt and subsequently bonded together.<br />
10.2 Special properties such as water repellence or permeability or UV stability can be<br />
obtained by mixing additives to the raw materials or applying different agents to the<br />
fabric.<br />
10.3 Spunbond fabrics are characterized by tensile, tear, and burst strengths,<br />
elongation-to-break, weight, thickness, porosity and stability to heat and chemicals.<br />
These properties reflect fabric composition and structure. The Spunbonded webs offer a<br />
wide range of product characteristics such as:<br />
• High liquid retention capacity due to high void content,<br />
• High in-plane shear resistance, and low drapeability,<br />
• Random fibrous structure,<br />
• High opacity per unit area,<br />
• Most spunbond webs are layered or singled structure, the number of layers<br />
increases with increasing basis weight,<br />
• Basis weights typically range from 12 - 150 gsm,<br />
• Fiber diameters range preferred is between 15 to 35 µm,<br />
• Web thickness typically between 0.2 - 1.5 mm,<br />
• High strength-to-weight ratios compared to other nonwoven, woven, and<br />
knitted structures,<br />
• High tear strength (for area bonded webs only),<br />
• Good fray and crease resistance.<br />
Major Application and End-usages:<br />
• Sanitary and Hygiene: The use of spunbond web as a coverstock for Sanitary Napkins,<br />
Baby Diapers and Incontinence Diapers are the most widely used world over because of<br />
the unique structure of spunbond web which helps the skin of the user stay dry and<br />
comfortable. Additionally, the spunbond webs are cost effective over the conventional non<br />
wovens.<br />
• Medical and Surgical: In Medical applications world over, other traditional woven<br />
materials have been replaced by high performance spunbonded webs due to typical<br />
227
Appendix – 5A (Contd…)<br />
properties such as breathability, resistance to fluid penetration, lint free structure,<br />
sterilisability and impermeability to bacteria. The medical applications include gowns,<br />
masks, caps, drapes, etc.<br />
• Other Miscellaneous Applications like :- Filtration Material, Agriculture, Headliners, etc.<br />
Global Market Potential :<br />
10.4 Spunbond Polypropylene and spunbond Meltblown polypropylene composites are<br />
the fastest growing of the nonwoven technologies worldwide (See Graph below):<br />
1000000<br />
800000<br />
600000<br />
400000<br />
200000<br />
0<br />
Spunbonded Polypropylene Growth (Tonnes)<br />
120000<br />
226000<br />
382000<br />
603000<br />
847000<br />
1985 1989 1993 1997 2001<br />
10.5 The spunbond polypropylene has reflected an average growth rate over the 12 year period<br />
approaching 15% per year.<br />
10.6 It may be noted that the main focus area has been the fine denier spunbond and SMS<br />
polypropylene markets which accounted for 88% of the total spunbond and SMS production. The review of<br />
the global regional production of fine denier spunbond and SMS polypropylene reveals that North America<br />
is the largest market with 34% market share followed by Europe with 31% and the balance by rest of the<br />
world (1997) reflecting growth rate of 6% p.a. for the European and American markets between 1997 and<br />
2001.<br />
10.7 The largest of the spunbond and SMS composite markets is for coverstock<br />
used by absorbent products. In terms of tonnage, coverstock account for about half of<br />
the total fine denier spunbond PP material consumed. Spunbond coverstock is growing<br />
worldwide at the rate of 10% per annum and it’s share will reach about 64% of all fine<br />
denier spunbond PP and SMS consumption. The factors identified driving the market for<br />
228
spunbond and SMS coverstock worldwide are:<br />
• Increase consumption of disposable absorbent products,<br />
• New Diaper designs utilise more coverstock per diaper,<br />
• Spunbond share of the market in cover stock increasing<br />
Appendix – 5A (Contd…)<br />
10.8 Led by Kimberly Clark in North America, disposable medical nonwoven materials are also gaining<br />
a significant share of the medical markets in US, Europe and rest of the world. The major factor attributed<br />
to slower growth of disposable nonwoven apparel in the developing markets is the high cost of importing<br />
these finished products or the roll goods to produce them.<br />
10.9 The market potential for medical disposable products can grow significantly if the import duties,<br />
local taxes and distribution costs can be brought down.<br />
Indian Market Potential :<br />
Healthcare and Hygiene Applications:<br />
10.10 The spunbond fabric find varied applications in hygiene and healthcare segments<br />
as mentioned below:<br />
• Sanitary Napkins: The spunbond nonwoven is used in the napkin<br />
coverstock/top layer.<br />
• Incontinence /Adult Diapers and Baby Diapers: The nonwovens are used<br />
in the topsheet and cuffs.<br />
• Healthcare Textiles: This category includes the products used in hospitals<br />
like Caps, Masks, Gowns, Aprons, Beddings, etc.<br />
10.11 The All India nonwoven demand arising from these segments is as shown below:<br />
Products 2001-02<br />
Estimated<br />
Quantity (Tonnes) Value (Rs. Cr.)<br />
2003-04<br />
Estimated<br />
2007-08<br />
Projected<br />
2001-02<br />
Estimated<br />
2003-04<br />
Estimated<br />
2007-08<br />
Projected<br />
Sanitary napkins 818.81 919.85 1496.08 8.31 10.62 17.27<br />
Incontinence<br />
Diapers<br />
32.97 84.71 212.07 0.36 0.93 2.33<br />
Baby Diapers 161.55 184.95 242.43 1.78 2.04 2.67<br />
Healthcare Textiles 279.66 968.72 4485.07 3.20 11.15 51.19<br />
TOTAL* 1292.99 2158.23 9653.475 13.65 24.74 111.28 #<br />
*: Subject to realisation of the market potential for the above healthcare and hygiene products.<br />
# Includes the export of 50 % on Total of Rs. 74.18 Cr. (i.e. Rs. 37.10 Cr. (3217.825 T).<br />
10.12 At present the entire requirement of spunbond fabric for the above<br />
applications (and others) is met through imports by the parties directly.<br />
229
Appendix – 5A (Contd…)<br />
10.13 There are EOUs in the country like PVD and Uni products which are manufacturing the fabric in<br />
India. KT International is the trader selling another player producing the spunbond fabric in the country.<br />
10.14 Some of the established and potential customers for the spunbond fabric are:<br />
Company Products<br />
Johnson and Johnson Sanitary Napkins<br />
Procter & Gamble Hygiene and<br />
Healthcare Ltd.<br />
Sanitary Napkins and Baby Diapers<br />
Kimberly Clark Lever Ltd. Sanitary Napkins and Baby Diapers<br />
Godrej Baby Diapers<br />
Gufic Biosciences Sanitary Napkins<br />
Elder Hartmann Incontinence Diapers<br />
Noble Hygiene Incontinence and Baby Diapers<br />
Dima Products Sanitary Napkins<br />
10.15 Thus in the background of the projected market potential of short term period upto 2007-08 and<br />
long term prospects, there is scope for setting up an economic size spunbond project in India, using state-of-<br />
the-art technology. Setting up of this unit would provide a big boost to the above mentioned user industries.<br />
10.16 Other Technologies available for producing the above mentioned products are as follows:<br />
Products Other Technologies<br />
Healthcare Products Spunlace<br />
SECTI<strong>ON</strong> II : SPUNB<strong>ON</strong>D TECHNOLOGY AND EQUIPMENTS<br />
SUPPLIERS<br />
Process Description:<br />
10.17 The spunbond process is a nonwoven manufacturing system involving the direct conversion of a<br />
230
Appendix – 5A (Contd…)<br />
polymer into continuous filaments, integrated with the conversion of the filaments into a random-laid,<br />
bonded nonwoven fabric. The spun bond process is one of the newer nonwoven technologies, having first<br />
been commercialised in the mid-1960s. Spunbond technology has received considerable attention since its<br />
initial introduction, as the resulting product has met some important market needs.<br />
10.18 The typical spunbond nonwoven process consists of several integrated steps in the<br />
conversion of polymer / resin pellets into a finished nonwoven fabric. The major<br />
elements of the process are :<br />
Polymer Feed :<br />
10.19 Polymer feedstock in pellet or powder form is conveyed from storage bins or silos<br />
to the feeder section of an extruder.<br />
Extruder :<br />
10.20 Polymer feedstock is mixed with stabilisers, additives, color master-batch, resin<br />
modifiers, or other additives. This blend of raw materials is melted within the extruder<br />
barrel.<br />
Fiber Spinning :<br />
10.21 The molten polymer mix is pumped through a heated conduit to a resin filter<br />
system and then to a distributor section that leads to the spinnerette units. The spinnerette<br />
usually consists of a perforated plate arranged across the width of the line. The resin is<br />
forced through the many small holes in the spinnerette plate to form continuous filaments.<br />
Quenching / Attenuation Zone :<br />
10.22 As the filaments emerge through the spinnerette holes, they are directed<br />
downward into quench chambers or chimneys. As the filaments travel through these<br />
chambers, cool air is directed across the filament bundle to cool the molten filaments<br />
sufficiently to cause solidification. The filaments are then led further downward into a<br />
tapered conduit by an airstream. A second stream of high velocity air is directed parallel<br />
to the direction of the filaments, causing an acceleration and accompanying attenuation or<br />
stretching of the individual filaments. This mechanical stretching results in increased<br />
orientation of the polymer chains making up the continuous filament. Such orientation<br />
leads to increased filament strength, along with modification of other filament properties,<br />
including the filament denier or thickness.<br />
Web Forming :<br />
10.23 The filaments are deposited in a random manner on a moving, porous forming<br />
belt. A vacuum under the belt assists in forming the filament web on the forming belt and<br />
in removing the air used in the extrusion / orientation operation. In some processes, an<br />
231
Appendix – 5A (Contd…)<br />
electrostatic charge is placed on the filament bundle to ensure spreading and separation of<br />
individual filaments. In other processes, deflector plates are used to lay down the<br />
filament sheet in a random manner on the forming belt.<br />
Bonding :<br />
10.24 The continuous filament web is delivered to a bonding section, where one of<br />
several bonding methods can be used to bond the loose filaments into a strong, integrated<br />
fabric.<br />
Slitting / Winding :<br />
10.25 The bonded fabric encounters a slitting section where the two edges are trimmed<br />
to eliminate the nonuniform, rough edge created during the manufacturing step. In some<br />
operations, the fabric may also be further slit into precise, smaller widths to provide<br />
finished rolls of precise dimension. Following slitting, the fabric is wound onto a larger<br />
roll, either a full width roll or a series of narrow slit rolls. From this point, the fabric<br />
rolls are ready for wrapping and shipping.<br />
A GENERIC FLOW DIAGRAM <strong>OF</strong> <strong>THE</strong> SPUNB<strong>ON</strong>D PROCESSING:<br />
POLYMER FEEDING AND MIXING<br />
EXTRUSI<strong>ON</strong><br />
FILTRATI<strong>ON</strong><br />
MELT METERING<br />
COATHANGER SPINNING<br />
FILAMENT COOLING<br />
STRETCHING<br />
WEB FORMING<br />
<strong>THE</strong>RMOB<strong>ON</strong>DING<br />
FABRIC TREATMENT<br />
DRYING<br />
SLITTING AND WINDING<br />
Machinery Suppliers and Specifications:<br />
10.26 Globally, the two well known technology suppliers with proven track record<br />
contacted by TECS are:<br />
1. Rieter Perfojet (France),<br />
Local Representative:<br />
Rieter India Pvt. Ltd.,<br />
232
1005-1008, Hemkunt Tower,<br />
98, Nehru Place,<br />
New Delhi - 110 019.<br />
Tel.: (022) 2628 3896 / 2644 8501 / 02 / 03<br />
Fax: (022) 2644 8505<br />
2. Reifenhauser GmbH & Co. (Germany)<br />
Local Representative:<br />
Reifenhauser (India) Marketing Ltd.,<br />
229, Udyog Bhavan, Sonawala Road,<br />
Goregaon (E), Mumbai - 400 063.<br />
Tel.: (022) 28756361<br />
Fax: (022) 2875 6362<br />
Email: reifen@bom3.vsnl.net.in<br />
Appendix – 5A (Contd…)<br />
Note : The list contains the leading global players in Spunbond Technology and based<br />
on discussion with Industry experts the above list is exhaustive..<br />
10.27 TECS has received responses from both these gobal players and preliminary discussions were held<br />
with their local representatives in India.<br />
Process Systems and Equipments<br />
10.28 The main process equipment in the Spunbond Unit would comprise of the following:<br />
• The Spunbond Tower houses all Process Systems and Equipments described below:<br />
o Dosing and pellets handling system (Volumetric),<br />
o Extruder (Barrier Screw L/D = 30),<br />
o Screen Changer (Continuous Operation Type),<br />
o Polymer Transfer Line (with electrical heating system, instrumentation<br />
and controls),<br />
o Spinning Beam (Multi-layers Distribution Pack),<br />
o Quenching System,<br />
o Smoke Removal System,<br />
o Filament Drawing system (with one single liner injector feed with<br />
compressed and cooled air),<br />
o Formation System (for fire opening and deposition over the web<br />
former),<br />
o Filament Stabilisation System (controls the air flow and makes more<br />
stable the spinning filaments),<br />
o Web Former (mechanical appropriation upto 400 m/min),<br />
233
o Vacuum System / Forming,<br />
o Vacuum System / Hold down,<br />
o Process Stabilisation System (PSS),<br />
o Line Automation and Process Control System,<br />
• The Service Equipment consisting of:<br />
o Spin Pack Handling System,<br />
o Burning Oven,<br />
o Washing Bath,<br />
o Spin Pack Working Table,<br />
o Spinneret Inspection Table,<br />
o Polymer Local Storage Tanks<br />
Appendix – 5A (Contd…)<br />
• 2-Rolls Hydraulic Calender (Width : 3700 mm; diameter : 560 mm; Production Speed : 30 - 300<br />
m / min)<br />
• Winder (web width:3500 m; Production speed : 300 m/in; No. Of spools : 4)<br />
Minimum Recommended Economic Size:<br />
10.29 The spunbond project proposed to be set up in India will have a designed capacity<br />
of 690 kgs per hour* (Average)<br />
(1.6-2.0 dpf: 12-30 gsm: 630 kg/hr.;<br />
> 2.0 dpf: 30-150 gsm: 750 kg/hr.)<br />
*For Hygiene and Medical applications, less than 30 gsm is used.<br />
10.30 Under Indian operating conditions it is safer to assume machine efficiency factor<br />
of 90%, and therefore the production would be 621 kgs per hour.<br />
10.31 The plant would operate in three shifts, 24 hours and 300 working days in a year.<br />
Investment in Process Plant and Machinery.<br />
10.32 The list of major equipments for the spunbond project is as given above and as per<br />
the indicative budgetary quotations , the investment in the process plant and<br />
machinery will be Rs 33 crores (FOB) inclusive of 10% discount as given by the<br />
machinery manufacturers. Finer details on the Equipment listing, specification and the<br />
quotations need to be discussed with the technology supplier before the project is taken<br />
up. Taking into account the CIF value, the custom duties (Custom duty of 5%), inland<br />
transportation, erection and commissioning , the installed cost of process equipment<br />
would be Rs 37.85 crores.<br />
234
SECTI<strong>ON</strong> III : PROJECT COST AND PR<strong>OF</strong>ITABILITY<br />
PROJECTI<strong>ON</strong>S<br />
Land<br />
Appendix – 5A (Contd…)<br />
10.33 The total requirement of land for this project keeping in mind the possible future<br />
expansion is around 10115 Sq. Mtrs. ( 2.5 acres ).<br />
10.34 Based on the available information, the cost of land is assumed at Rs 1200<br />
per square meter (including the developmental cost). Depending on the exact location of<br />
the project to be determined by the promoter, the land cost could be higher or lower.<br />
Hence the total cost of developed land will be Rs 1.21 crore.<br />
Buildings<br />
10.35 The building area comprising of main factory building, godowns, office, R & D<br />
labs/In-house Testing centre etc. would be 4000 sq. mtrs. The cost of construction would<br />
again vary depending on the structure and the materials to be used. It has been assumed<br />
that the average cost of construction would be Rs 4500 per sq. Mt. Thus the total cost of<br />
building and other civil works would be around Rs 1.80 crores.<br />
Plant and Machinery<br />
10.36 Details of Plant and machinery as well as technology required for the project have<br />
been presented in earlier Section II . The installed cost of plant and machinery would be<br />
Rs 37.85 crores.<br />
10.37 Apart from the main process equipments, the utilities required are:<br />
• Water Supply System,<br />
• Humidity Control System,<br />
• Piping,<br />
• Compressors,<br />
• Fire Fighting Equipments etc.<br />
10.38 The provision on this count is taken as 3% of the cost of machinery which works<br />
out to Rs 1.14 crores.<br />
Captive Power Plant<br />
235
10.39 The cost for this unit is Rs 5.25 crores<br />
Testing Equipments<br />
10.40 The testing equipments required for a Spunbond Unit are:<br />
• Laboratory Equipment, Dynamometer, Oven Dryer, Balance etc.,<br />
• In-line monitoring equipment - GSM, humidity etc.,<br />
• Metal Parts detection,<br />
• Air Handling, Humidification system,<br />
• Automatic Packing System.<br />
10.41 A provision of Rs. 3.12 crores has been made on this account.<br />
Miscellaneous Fixed Assets<br />
Appendix – 5A (Contd…)<br />
10.42 Under this head the items included are Furniture and fixtures, Office equipments,<br />
Air Conditioners etc. and the provision made is around Rs 0.30 crore (Rs 30 lakhs)<br />
inclusive of the Testing and R & D facilities.<br />
Project Engineering and Consulting<br />
10.43 Under this head the items included are the fees and expenses on account of<br />
Architect fees, project engineering and management (both local and overseas ), detailed<br />
project reports etc.<br />
Preliminary & Preoperative Expenses<br />
10.44 The items included under this head are company formation expenses, public issue<br />
expenses (if any), interest during construction, pre production expenses during the<br />
implementation phase etc.<br />
Contingency Expenses<br />
10.45 Depending on the gestation period and further detailing of the project cost by the<br />
promoter, the contingency provision has been made at the rate of 10%.<br />
Margin Money for Working capital<br />
10.46 The margin money for working capital forming part of the total project cost would<br />
be Rs 1.87 crores. [Exhibit 10.3]<br />
Total Project Cost (Total Investment)<br />
10.47 The total project cost as given in Exhibit 10.1 would be Rs 64.29 crores.<br />
236
Project Funding and Financing Pattern :<br />
Appendix – 5A (Contd…)<br />
10.48 It has been assumed that the project would be financed through long term funds<br />
and Equity participation by the Promoter / Public. The technical textile sector being a<br />
high priority area , it is assumed that a Debt- Equity ratio of 1.5 : 1 would be feasible.<br />
(However the sensitivity analysis has also been presented for 1 : 1 and 2 : 1 Debt Equity<br />
ratios.)<br />
Sales, Profitability and Sensitivity Analysis :<br />
Sales Realisation and Turnover<br />
10.49 As per the details available from the Technology and Equipment suppliers the<br />
economic size of a plant is 690 kgs per hour.<br />
10.50 Under the Indian conditions, it is assumed that the machine would operate at an<br />
efficiency level of 90%. Hence the production from the plant would be 621 kgs per hour.<br />
10.51 The plant would operate on 3-shift basis and 300 working days in year.<br />
10.52 Being a continuous operation, the capacity utilisation for the 1st year is assumed<br />
at 75% and thereafter for the 2nd and 3rd year onwards 85% and 90% respectively.<br />
10.53 The average selling price of the end product would be Rs 100 per kg . (net of<br />
excise duties, sales tax and other incidental expenses). The international price of the<br />
spunbond fabric is $1.6-$1.8 / kg and accordingly the landed cost is seen to be Rs 110 -<br />
Rs 120 per kg<br />
10.54 The details of projected sales turnover as projected are given in Exhibit 10.2.<br />
Cost of Production:<br />
Major Raw materials and their specifications::<br />
10.55 The main raw materials used and the corresponding prevailing prices as an<br />
indicator are as follows:<br />
Raw Material Prices Landed cost<br />
(inclusive of import duty of 15%<br />
& inland transportation etc.)<br />
Polypropylene Chips $800/tonne Rs 45.00/kg<br />
(PP chips) (Rs 37/kg)<br />
237
10.56 The major suppliers of these raw materials are :<br />
(a) Exxon<br />
(b) BP - Amoco<br />
(c) Borealis<br />
(d) Fina<br />
Appendix – 5A (Contd…)<br />
10.57 Along with the PP Chips, other additives like TiO2 and dyes are also added which<br />
account for another 2.5% of the raw material cost (Rs. 50 lakhs).<br />
10.58 The requirement of PP chips would be 4560.62 kg, accounting for a process waste<br />
of 2%. Hence the total raw material cost is Rs 21.03 crores. These PP Chips are mainly<br />
of 25-35 MFI.<br />
Power Cost<br />
10.59 The total connected load is about 2000KW and the norm of consumption of power<br />
per kg is 1.10 Kwh, priced at Rs. 4.50 per unit.<br />
Manpower, Salaries and Wages<br />
10.60 The manpower requirements and the salary structure is given in Exhibit 10.4<br />
10.61 The total manpower requirement comprising the managerial cadre of supervisors,<br />
machine operators and helpers would be 62 persons.<br />
Repairs and Maintenance<br />
10.62 The provision for Repairs and Maintenance has been made at 2% of the process<br />
plant and equipment cost.<br />
Factory and Overhead Expenses<br />
10.63 The items covered under this head are establishment expenses, repairs and<br />
maintenance, stationery, travel expenses, packaging expenses etc.<br />
Marketing and Promotional Expenses<br />
10.64 The promotion of technical textiles will call for expenditure on this count and a<br />
provision of 5% of the annual sales has been made uniformly over the years. This<br />
includes the margins and commission to the agents, distributors, etc.<br />
238
Interest and Depreciation<br />
Appendix – 5A (Contd…)<br />
10.65 The prevailing interest rate for long term and short term borrowed funds is<br />
assumed at 5% and 11% per annum respectively. (Project under Technology Upgradation<br />
Fund-TUF).<br />
10.66 The repayment of loans has been assumed for 10 years with a moratorium period<br />
of two years (2+8).<br />
10.67 The depreciation rates have been worked out as per Company’s act (SLM) and<br />
Income-Tax Ready Reckoner (WDV).<br />
10.68 The current corporate tax rate is assumed at 35% and the surcharge is assumed at<br />
2.5% per annum.<br />
Profitability, Break-even, IRR and Payback<br />
10.69 As presented in Exhibit 10.5, the sales turnover increases from Rs 32.86 crore in<br />
the first year to Rs 39.44 crore from the 3rd year onwards.<br />
10.70 The PBT increases from Rs 6.14 crore in the first year to Rs 8.42 crore in the<br />
fourth year.<br />
10.71 The Break Even of the project is at 52.38%.<br />
10.72 The Internal Rate of Return ( IRR ) has been worked out at 14.61%.<br />
10.73 The Payback period for the project is 5.57 years.<br />
Sensitivity Analysiss<br />
10.74 The sensitivity analysis has been presented in the Exhibit 10.6.<br />
DEVELOPMENTAL AND PROMOTI<strong>ON</strong>AL MEASURES.<br />
1. Nonwoven fabrics manufactured from Spunbond technology have the widest<br />
applications for healthcare and medical products.<br />
2. This sector is one of the most important for development of Medical and Healthcare<br />
technical textile industry.<br />
3. It will be a Mother Unit for supplying the raw materials for healthcare and medical<br />
products such as Sanitary Napkins, Incontinence and Baby Diapers, Masks, Caps,<br />
etc.<br />
239
Appendix – 5A (Contd…)<br />
4. There is scope for setting up this unit in India to meet the requirement of<br />
Spunbond nonwoven fabrics for the current decade subject to the realisation of<br />
India’s untapped market potential for the user sectors of sanitary napkins,<br />
incontinence diapers, baby diapers, caps, masks, medical disposables, etc.<br />
5. The assumed customs duty on PP Chips is 20% BCD and it is recommended that for<br />
level laying field it should be reduced to 5%.<br />
6. With the implementation of this project, imported spunbond fabric should carry<br />
higher customs duty to discourage the customers to use imported fabrics.<br />
7. The Indian product should satisfy the national and international standards. Bureau<br />
of Indian Standards should take a lead in this direction. With the quality standards at<br />
par with the International market and competitive pricing policies, a level playing<br />
field can be assured to the Indian entrepreneurs.<br />
8. The manufacturers of the healthcare products and the spunbond fabric should have<br />
representation in the Committees set up by the Ministry of Health.<br />
9. Over the years, attempts may be initiated by companies like Reliance to take up the<br />
manufacturing of PP Chips, the main raw material for spunbond industry.<br />
10. There are no regulatory issues connected with this project. As a forward linkage,<br />
this project will not only be an import substitution, but provide the critical raw<br />
material for the medical and healthcare products.<br />
240
EXHIBIT 10.1<br />
PROJECT COST<br />
(LAND, BUILDINGS, PROCESS PLANT & MACHINERY, UTILITIES & O<strong>THE</strong>R ASSETS)<br />
Project Cost (Rs. Cr.)<br />
1 Land 1.21<br />
Area: 2.5 acres ( 10115 Sq Mtrs)<br />
Rate: (Rs.1200 /Sq. Mtr)<br />
2 Buildings 1.80<br />
Plant Area, Office, Godown, Lab, Service Area etc.)<br />
Built-up Area : 4000 Sq. Mtrs<br />
Avg Rate : Rs. 4500 /Sq. Mtrs<br />
3 Process Plant & Equipment 37.85<br />
(List of Equipments given in the Section II)<br />
4 Utility & Other equipments (3%) 1.14<br />
(List of Equipments given in the Section III)<br />
5 Captive Power Plant (1880 kW) 5.25<br />
6 Misc. Fixed Assets 0.30<br />
(Furniture & Fixtures, Office Equipment, etc.)<br />
7 Testing Lab Equipments 3.12<br />
(List of Equipments given in the Section III)<br />
8 Project Engineering & Consultancy charges (2.5%) 1.02<br />
9 Preliminary & Pre-operative Expenses (12%) 5.04<br />
(Company Formation, Interest during construction,<br />
pre-production expenses, etc.)<br />
10 Contingency (10 %) 5.67<br />
11 Total 62.41<br />
12 Margin Money for Working Capital 1.87<br />
13 Total Project Cost 64.29<br />
241
EXHIBIT 10.2<br />
ESTIMATI<strong>ON</strong> <strong>OF</strong> SALES REVENUE<br />
ITEM YEAR <strong>OF</strong> OPERATI<strong>ON</strong><br />
I II III IV V VI VII VIII IX X<br />
Average Production per hour (kg) 690 690 690 690 690 690 690 690 690 690<br />
90% efficiency 621 621 621 621 621 621 621 621 621 621<br />
Capacity Utilisation 75% 85% 90% 90% 90% 90% 90% 90% 90% 90%<br />
Actual Production per hour 466 528 559 559 559 559 559 559 559 559<br />
(Rs. Cr.)<br />
Production per day (kg) 11178 12668 13414 13414 13414 13414 13414 13414 13414 13414<br />
Production for 300 working days (kg) 3353400 3800520 4024080 4024080 4024080 4024080 4024080 4024080 4024080 4024080<br />
Selling Price (Rs/Kg) 100.00 100.00 100.00 100.00 100.00 100.00 100.00 100.00 100.00 100.00<br />
Sales Revenue (Rs. Cr) 33.53 38.01 40.24 40.24 40.24 40.24 40.24 40.24 40.24 40.24<br />
Value Loss ( 2% ) 0.67 0.76 0.80 0.80 0.80 0.80 0.80 0.80 0.80 0.80<br />
Net Sales Revenue (Rs. Cr) 32.86 37.25 39.44 39.44 39.44 39.44 39.44 39.44 39.44 39.44<br />
242
Factory Related<br />
EXHIBIT 10.3<br />
REQUIREMENT <strong>OF</strong> WORKING CAPITAL<br />
ITEM NO. <strong>OF</strong> MARGIN YEAR I YEAR II YEAR III YEAR IV<br />
(Rs.Lakhs)<br />
YEAR V<br />
M<strong>ON</strong>THS (%) W.CAP MARGIN BANK W.CAP MARGIN BANK W.CAP MARGIN BANK W.CAP MARGIN BANK W.CAP MARGIN BANK<br />
REQMT M<strong>ON</strong>EY FINANCE REQMT M<strong>ON</strong>EY FINANCE REQMT M<strong>ON</strong>EY FINANCE REQMT M<strong>ON</strong>EY FINANCE REQMT M<strong>ON</strong>EY FINANCE<br />
Raw materials & other com. 2.00 25.00 2.63 0.66 1.97 2.98 0.74 2.23 3.15 0.79 2.37 3.15 0.79 2.37 3.15 0.79 2.37<br />
Goods in process 0.25 25.00 0.40 0.10 0.30 0.45 0.11 0.34 0.48 0.12 0.36 0.49 0.12 0.36 0.49 0.12 0.37<br />
Finished Goods 1.00 25.00 1.73 0.43 1.30 1.95 0.49 1.46 2.08 0.52 1.56 2.11 0.53 1.58 2.11 0.53 1.58<br />
A/c Receivable 1.00 25.00 2.74 0.68 2.05 3.10 0.78 2.33 3.29 0.82 2.46 3.29 0.82 2.46 3.29 0.82 2.46<br />
Cash in hand<br />
Salaries & wages 1.00 0.00 0.07 0.00 0.07 0.07 0.00 0.07 0.07 0.00 0.07 0.08 0.00 0.08 0.08 0.00 0.08<br />
Utilities 1.00 0.00 0.09 0.00 0.09 0.11 0.00 0.11 0.14 0.00 0.14 0.17 0.00 0.17 0.17 0.00 0.17<br />
Marketing & Promotional Expenses 1.00 0.00 0.14 0.00 0.14 0.16 0.00 0.16 0.16 0.00 0.16 0.16 0.00 0.16 0.16 0.00 0.16<br />
Admin. Overheads 1.00 0.00 0.06 0.00 0.06 0.06 0.00 0.06 0.06 0.00 0.06 0.06 0.00 0.06 0.06 0.00 0.06<br />
Total Requirement 7.86 1.87 5.98 8.88 2.12 6.76 9.44 2.25 7.19 9.51 2.26 7.25 9.52 2.26 7.26<br />
243
EXHIBIT 10.3 (contd..)<br />
REQUIREMENT <strong>OF</strong> WORKING CAPITAL<br />
ITEM NO. <strong>OF</strong> MARGIN YEAR VI YEAR VII YEAR VIII YEAR IX<br />
(Rs.Lakhs)<br />
YEAR X<br />
Factory Related<br />
M<strong>ON</strong>THS (%) W.CAP MARGIN BANK W.CAP MARGIN BANK W.CAP MARGIN BANK W.CAP MARGIN BANK W.CAP MARGIN BANK<br />
REQMT M<strong>ON</strong>EY FINANCE REQMT M<strong>ON</strong>EY FINANCE REQMT M<strong>ON</strong>EY FINANCE REQMT M<strong>ON</strong>EY FINANCEREQMT M<strong>ON</strong>EY FINANCE<br />
Raw materials & other 2.00 25.00 3.15 0.79 2.37 3.15 0.79 2.37 3.15 0.79 2.37 3.15 0.79 2.37 3.15 0.79 2.37<br />
Goods in Process 0.50 25.00 0.98 0.24 0.73 0.98 0.25 0.74 0.98 0.25 0.74 0.99 0.25 0.74 0.99 0.25 0.74<br />
Finished Goods Stock 1.00 25.00 2.12 0.53 1.59 2.12 0.53 1.59 2.13 0.53 1.60 2.14 0.54 1.61 2.15 0.54 1.61<br />
A/c Receivable 1.00 25.00 3.29 0.82 2.46 3.29 0.82 2.46 3.29 0.82 2.46 3.29 0.82 2.46 3.29 0.82 2.46<br />
Cash in hand<br />
Salaries & wages 1.00 0.00 0.09 0.00 0.09 0.09 0.00 0.09 0.10 0.00 0.10 0.11 0.00 0.11 0.12 0.00 0.12<br />
Utilities 1.00 0.00 0.00 0.00 0.00 0.00 0.00 0.00 0.00 0.00 0.00 0.00 0.00 0.00 0.00 0.00 0.00<br />
Marketing & Promotional 1.00 Expenses 0.00 0.06 0.00 0.06 0.06 0.00 0.06 0.06 0.00 0.06 0.06 0.00 0.06 0.06 0.00 0.06<br />
Admin. Overheads 1.00 0.00 0.16 0.00 0.16 0.16 0.00 0.16 0.16 0.00 0.16 0.16 0.00 0.16 0.16 0.00 0.16<br />
Total Requirement 10.02 2.38 7.64 10.04 2.39 7.65 10.06 2.39 7.67 10.08 2.39 7.68 10.10 2.40 7.70<br />
244
EXHIBIT 10.4<br />
MANPOWER REQUIREMENTS<br />
Nos Monthly Total Mon. Annual<br />
General Manager 1 30000 30000 360000<br />
Production Manager 1 20000 20000 240000<br />
Machine Operators 12 6000 72000 864000<br />
(4 X 3 shifts)<br />
Machine Helper (Semi Skilled) 9 3000 27000 324000<br />
(3 X 3 sgifts)<br />
Material Handling 3 6000 18000 216000<br />
R&D, Testing 6 10000 60000 720000<br />
Marketing & Sales<br />
Marketing Head 1 25000 25000 300000<br />
Sales Team 5 12000 60000 720000<br />
Clerical Staff 10 6000 60000 720000<br />
Other Staff (Peon, Security) 5 3000 15000 180000<br />
Maintenance Department 9 10000 90000 1080000<br />
TOTAL 62 477000 5724000<br />
Fringe Benefits (40 % of the above) 2289600<br />
Total Wage Bill (Annual) Salary + Rs. Other lakhs: Benefits = 8013600.00<br />
Total Wage Bill (Annual) Rs. Cr.: 0.80136<br />
245
EXHIBIT 10.5<br />
PR<strong>OF</strong>ITABILITY STATEMENT AND COMPUTATI<strong>ON</strong> <strong>OF</strong> TAX<br />
(Rs.Cr)<br />
ACCOUNT HEAD FINANCIAL YEAR <strong>OF</strong> OPERATI<strong>ON</strong><br />
I II III IV V VI VII VIII IX X<br />
Revenue<br />
Net Sales Turnover 32.86 37.25 39.44 39.44 39.44 39.44 39.44 39.44 39.44 39.44<br />
Total Revenue 32.86 37.25 39.44 39.44 39.44 39.44 39.44 39.44 39.44 39.44<br />
Expenses<br />
Raw Materials 15.77 17.88 18.93 18.93 18.93 18.93 18.93 18.93 18.93 18.93<br />
Salaries & wages 0.80 0.84 0.88 0.93 0.97 1.05 1.14 1.23 1.33 1.43<br />
Power, Fuel, Stores & Other Expenses (including 1.13 packing 1.35materials) 1.69 2.03 2.03 2.03 2.03 2.03 2.03 2.03<br />
Repairs & Maintenance 0.76 0.76 0.76 0.76 0.76 0.76 0.76 0.76 0.76 0.76<br />
Marketing & Promotional Expenses 1.64 1.86 1.97 1.97 1.97 1.97 1.97 1.97 1.97 1.97<br />
Factory & Office Overheads 0.67 0.67 0.67 0.67 0.67 0.67 0.67 0.67 0.67 0.67<br />
Interest on S.T. Loans 0.66 0.74 0.79 0.80 0.80 0.84 0.84 0.84 0.85 0.85<br />
Cost of Sales 21.43 24.11 25.70 26.09 26.13 26.25 26.34 26.43 26.53 26.64<br />
Depreciation (St.Line) 3.20 3.20 3.20 3.20 3.20 3.20 3.20 3.20 3.20 3.20<br />
Amort. of Expenses 0.17 0.17 0.17 0.17 0.17 0.17 0.00 0.00 0.00 0.00<br />
Interest on L.T Loan 1.93 1.93 1.81 1.57 1.33 1.08 0.84 0.60 0.36 0.12<br />
Profit Before Tax 6.14 7.84 8.57 8.42 8.61 8.73 9.06 9.21 9.35 9.48<br />
Tax 0.64 0.82 0.90 1.46 2.32 2.72 3.10 3.36 3.56 3.72<br />
Profit After Tax 5.49 7.02 7.67 6.96 6.29 6.01 5.95 5.85 5.79 5.76<br />
Dividend 0.00 0.00 1.29 1.29 1.29 2.57 2.57 2.57 2.57 2.57<br />
Profits For Appropriation 5.49 7.02 6.38 5.67 5.01 3.44 3.38 3.28 3.21 3.18<br />
COMPUTATI<strong>ON</strong> <strong>OF</strong> TAX<br />
Profit after interest before depreciation 9.33 11.04 11.76 11.61 11.81 11.93 12.25 12.40 12.54 12.68<br />
Depr.(WDV) to be claimed 13.94 15.36 12.66 7.44 5.18 4.16 3.39 2.81 2.37 2.03<br />
Depreciation claimed 9.33 11.04 11.76 7.44 5.18 4.16 3.39 2.81 2.37 2.03<br />
Depr. carried forward 4.61 4.32 0.90 0.00 0.00 0.00 0.00 0.00 0.00 0.00<br />
Taxable Profit 0.00 0.00 0.00 4.17 6.62 7.77 8.87 9.60 10.18 10.64<br />
Profit Before Tax (Book) 6.14 7.84 8.57 8.42 8.61 8.73 9.06 9.21 9.35 9.48<br />
Minimum Alternate Tax 0.64 0.82 0.90 0.00 0.00 0.00 0.00 0.00 0.00 0.00<br />
Tax (Actual) 0.00 0.00 0.00 1.46 2.32 2.72 3.10 3.36 3.56 3.72<br />
Tax Provision 0.64 0.82 0.90 1.46 2.32 2.72 3.10 3.36 3.56 3.72<br />
246
EXHIBIT 10.6<br />
SENSITIVITY ANALYSIS<br />
Items Profit after Tax<br />
(PAT)<br />
Rs. Cr.<br />
(assumed at 90 %<br />
capacity)<br />
Break<br />
Even<br />
(%)<br />
Appendix – 5A (Contd…)<br />
Internal<br />
Rate of<br />
Return<br />
(IRR)<br />
(%)<br />
Payback<br />
Period<br />
(Years)<br />
NORMAL VALUES 6.96 52.38 14.61 5.57<br />
Debt Equity Ratios<br />
(a) 2:1<br />
(b) 1:1<br />
Increase in Project Cost<br />
by 10 %<br />
Decrease in Selling<br />
Price to Rs. 95 / kg<br />
Increase in Selling Price<br />
to Rs 110 / kg<br />
Decrease in Raw<br />
Material Prices by 10%<br />
7.07<br />
6.81<br />
53.37<br />
50.91<br />
14.71<br />
14.46<br />
5.53<br />
5.63<br />
7.10 55.15 13.11 6.03<br />
5.87 58.27 12.33 6.30<br />
9.06 43.81 19.25 4.48<br />
7.90 47.20 17.04 4.9<br />
247
SPUNLACE PROJECT<br />
Appendix – 5A (Contd…)<br />
SECTI<strong>ON</strong> I : PRODUCT BRIEF, APPLICATI<strong>ON</strong> AREAS AND<br />
MARKET POTENTIAL<br />
11.1 The oldest technique for consolidating a web is mechanical bonding, which entangles the fibers to<br />
give strength to the web. Under mechanical bonding, the two most widely used methods are<br />
needlepunching and spunlacing (hydroentanglement).<br />
11.2 There are many different specific terms for spunlace nonwoven like jet entangled,<br />
water entangled, hydroentangled or hydraulically needled. The term, spunlace, is used<br />
more popularly in the nonwoven industry. The spunlace process can be defined as: the<br />
spunlace process is a nonwovens manufacturing system that employs jets of water to<br />
entangle fibers and thereby provide fabric integrity.<br />
11.3 Hydroentanglement uses high-speed jets of water to strike a web so that the<br />
fibers knot about one another. As a result, nonwoven fabrics made by this method have<br />
specific properties, as soft handle and drapability.<br />
11.4 Hydroentanglement is considered to be a highly versatile process because it can be used to produce<br />
nonwovens with a broad range of end-use properties. These differences are achieved as a result of a wide<br />
range of fibers that are available and also because of the wide range of possible parameter adjustments.<br />
Spunlace fabrics can be further finished, usually dyed and/or printed, treated with binders to allow for wash<br />
durability, or fire retardants can be applied to resist burning. The fabric can be treated by antimicrobial<br />
agents to enhance resistance against microorganisms.<br />
11.5 The Spunlaced fabrics offer a wide range of product characteristics such as:<br />
• High density,<br />
• Absorbency,<br />
• Strength Modulus,<br />
• Softness,<br />
• Drapeability,<br />
• Lint free,<br />
• Excellent cover,<br />
• Uniformity,<br />
• Bulky property,<br />
• Printability,<br />
• Durable fabrics<br />
249
Major Application and End-usages:<br />
Appendix – 5A (Contd…)<br />
11.6 Spunlaced fabrics have a wide use in various applications due to relatively high absorption abilities<br />
and absence of a binder in the fabric allowing sterilization of the fabric at high temperatures. Some of the<br />
application areas are:<br />
• Wipes: Baby Wipes, Household Wipes, Industrial Wipes, Consumer<br />
premoistened wipes<br />
• Cosmetic Cotton pads,<br />
• Hospital use: surgical gowns, drapes, operation cover sheets<br />
North American Wipes Market Potential :<br />
11.7 Over the five year period from 1997-2002, the North American (US & Canada)<br />
wipes industry expanded about 14% per year. This was due to the increasing use of<br />
consumer and industrial wipes and introduction of new classifications of products that<br />
expanded the market.<br />
11.8 During 2002, the sales of nonwoven wipes to the endusers industry reached $2.8 bn consuming an<br />
estimated 2.2 bn sq. mts. of various nonwovens valued at $470 mn.<br />
Consumer<br />
72%<br />
Source: INDA<br />
Total Wipes Market:<br />
(2.2 bn sq. mts.)<br />
Industrial<br />
28%<br />
11.9 The total wipes market as seen above can be classified into:<br />
1. Consumer Wipes accounting for 1.6 bn sq. Mts.,<br />
2. Industrial Wipes accounting for 0.6 bn sq. mts.,<br />
250
1. Consumer Wipes<br />
Appendix – 5A (Contd…)<br />
11.10 The consumer wipes market account for 72% or 1.6 bn sq. mts. of the total wipes<br />
market in 2002.<br />
Source : INDA<br />
11.11 This segment can be further divided into<br />
I) Baby Wipes<br />
II) Non baby personal wipes<br />
III) Non baby household wipes.<br />
11.12 INDA forecasts that North American consumer wipes sales at retail will rise about<br />
8% p.a. during the 5-year period upto 2007 rising from current $2.2 bn to $ 3.2 bn.<br />
I) BABY WIPES:<br />
11.13 The baby wipes market is estimated at $ 860 mn at retail in North America (2002)<br />
11.14 Baby wipes were meant for cleaning babies face at feeding time and babies’<br />
bottoms during diaper change. However the consumers were using it for a multitude of<br />
enduses besides these, giving rise to other non baby personal and household products.<br />
II) N<strong>ON</strong> BABY PERS<strong>ON</strong>AL WIPES:<br />
11.15 In North America, retail sales during 2002 for personal wipes were about $ 470<br />
mn.<br />
N on B ab y<br />
h ou s eh old w ip es<br />
3 0 %<br />
N on B ab y<br />
P ers on al W ip es<br />
1 2 %<br />
11.16 The personal wipes are further segmented into:<br />
A) Body Wash/Incontinent Wipes:<br />
C o n s u m e r W ip e S e g m e n t<br />
(1 .6 b n S q .M ts .)<br />
11.17 Represents a retail market of $ 180 mn.<br />
B ab y W ip es<br />
5 8 %<br />
11.18 Growth rate :- 30% per annum as new products entered the market.<br />
251
B) Moist Toilet Tissue:<br />
Appendix – 5A (Contd…)<br />
11.19 Produced from Airlaid Pulp. Participants are Georgia Pacific Quitted Northern<br />
Fresh, Kimberly - Clark’s Cottonelle Fresh and Proctor & Gamble’s Charmin Fresh<br />
mates. This segment accounts for less than $ 70 mn.<br />
C) Feminine Care :<br />
11.20 Include intimate care products by Always, Playtex and others. This segment has<br />
been growing rapidly and has witnessed rapid proliferation of facial care products.<br />
11.21 Cosmetic/Facial Wipes include Facial cleansing and makeup remove wipes, nail<br />
polish removers and hair remover pull strips.<br />
D) Medicinal Wipes:<br />
11.22 Retail sales are estimated at less than $ 50 mn per year. Products include Stridex,<br />
Oxy, Clearsil and haemorrhoid Wipes.<br />
III) N<strong>ON</strong> BABY HOUSEHOLD WIPES:<br />
11.23 The household wipes segment had retail sales estimated at $ 806 mn in 2002 growing at about 15%<br />
per annum.<br />
11.24 This segment includes hard surface wipes, electrostatic wipes, antibacterial and cleansing wipes,<br />
floor cleaning products polish cloth and automotive care.<br />
11.25 The household wipes segment can be pictorially represented as under:<br />
E lectrostatic<br />
38%<br />
H o u seh o ld W ip es M arket<br />
(490 m n S q .M ts.)<br />
O ther M arkets<br />
8%<br />
Source: INDA<br />
11.26 Hard surface wipes such as Clorox, Mr. Clean and Lysol products account for over half of the total<br />
household segment and consumed estimated 270 mn sq.mt. of nonwoven fabric.<br />
H ard S urface<br />
54%<br />
252
Appendix – 5A (Contd…)<br />
11.27 Electrostatic and related wipes (Swiffer, pledge Grab-It) accounted for around 190 mn sq.mt. of<br />
the fabric.<br />
11.28 Accounting for the remaining consumption of non woven materials is the kitchen<br />
dry wipes, mop heads, silver cleanes, furniture polishing wipes, computer wipes, glass<br />
wipes, various auto interior wipes and stain remover wipes.<br />
Wipes Market Trends in the World<br />
11.29 Mature boomers and grandparents have the disposable income to splurge on these value added<br />
products.<br />
11.30 Baby wipe material is hydroentangled to give just enough strength for conversion<br />
allowing the maximum softness to be obtained. The fibre blend varies from 50/50 to<br />
70/30 viscose/polyester depending on price, and polypropylene can be used to economise<br />
on polyester without sacrificing softness. However PP tends to be harder to<br />
hydroentangle.<br />
11.31 In case of General Purpose Wipes, the fabric is stronger, heavier and more<br />
abrasion resistant than the baby wipe material, and is usually apertured to create dirt-<br />
holding voids. These fabrics tend to be more costly to make than baby-wipes, and yet<br />
have a lower retail value.<br />
11.32 Wipes prices in Europe have fallen in the last two years and the market is now<br />
very competitive with low cost imports being available from Turkey, Israel and China.<br />
11.33 Established consumer companies are employing nonwoven wipes as brand<br />
extensions.<br />
11.34 Viscose/Polyester hydroentangled wet-wiping cloths have been a major growth<br />
area for viscose in Europe over the last 5 years.<br />
11.35 The Nonwoven Technology Competition in the Global Wipes market is shown<br />
below:<br />
253
Indian Wipes Market Potential:<br />
Appendix – 5A (Contd…)<br />
11.36 Based on the preliminary field investigations, the total market size for wipes is<br />
around Rs 450 crores comprising domestic, medical, cosmetic and baby wipes.<br />
11.37 Presently wipes are used on very restrictive basis and availability is confined to<br />
large retail outlets and department stores in metros and major city centres. With greater<br />
awareness and promotion, consumer preference will gradually increase over the years in<br />
all application areas.<br />
11.38 Based on the deliberations and discussions with Indian market players, the market<br />
size for spunlace based wipes is around Rs 25 crores in 2003-04 expected to reach Rs<br />
110 crore by 2007-08.<br />
11.39 It should be noted that Industrial Wipes are manufactured by Needle Punch or<br />
Chemical Bonding Technology; hence not considered under this project.<br />
11.40 Also, the assumed price of Spunlace Fabric around Rs 165 per kg and through conversion a value<br />
addition of around 40 - 50% for the final end products.<br />
11.41 Some of the brands available in the Indian market are as shown :<br />
Brand Purpose Pack Price Size (cm 2 )<br />
Magic cleen Multi-purpose One 55 25 x 29<br />
Supreme Multi-purpose One 20 33 x 36<br />
Easy wipe Multi- purpose One 10 20 x 20<br />
Simoniz Multi- purpose One 18 31 x 45<br />
Supreme handy mop Multi- purpose One 25 19 x 17<br />
Super wipe Multi- purpose Two 20 17 x 20<br />
Magic touch Kitchen wipe Two 11 30 x 30<br />
Magic touch Crockery wipe One 11 17 x 20<br />
Facial wipes<br />
Fresh Ones 100 150 1.4 x 2.2<br />
50 99 1.4 x 2.2<br />
Fresh Ones-Car pack 50 99 1.4 x 2.2<br />
Fresh Ones-Car pack 75 125 1.4 x 2.2<br />
Fresh Ones-Car pack Wet Wipes 30 75 1.4 x 2.2<br />
Convenience Pack 15 35 1.4 x 2.2<br />
Pouch Pack 10 25 1.4 x 2.2<br />
Koolers 25 75 1.65 x 2.0<br />
Clarus 8 15 15.0 x 25.0<br />
Clarus 30 50 15.0 x 20.0<br />
254
Appendix – 5A (Contd…)<br />
Brand Purpose Pack Price Size (cm 2 )<br />
Fresh Ones- 15 35 2.20 x 1.40<br />
Baby fun 50 99 2.20 x 1.40<br />
Baby Wipes 100 150 2.20 x 1.40<br />
Clarus 12 (small) 25 15.0 x 20.0<br />
Fresh ones Premium 25 (XL) 125 2.0 x 2.0<br />
Sctoch Brite 1 35 17.5 x 20.0<br />
Oil filter 1 25 23.0 x 23.0<br />
Mop Kitchen Wipes 1 20 30.5 x 30.5<br />
Kitchen Wipe 1 30 30.5 x 38.0<br />
Kitchen Wipe 1 50 46.0 x 53.0<br />
11.42 Our survey has revealed that some of the companies who may consider entering the wipes market<br />
are :<br />
• Hindustan Lever Ltd. (marketing and distribution),<br />
• Supreme Nonwovens,<br />
• Safetec Disposables,<br />
• Healthcare Disposables Ltd.<br />
• Rajasthan based private company, etc.<br />
Medical Applications:<br />
11.43 Apart from wipes, spunlace nonwoven fabric has the potential in the medical field<br />
of guazes, for which the current total market is estimated at around Rs 145.61 crores and<br />
assuming the penetration level of 5%, the market size in the year 2003-04 would be<br />
around Rs 7.28 crores. (Details are presented in the Phase I Market Survey Report on<br />
Surgical Dressings).<br />
11.44 There are multinational and large Indian companies like J&J, Elder, Smith and<br />
Nephew, Bierersdorf, 3M India, etc. and a large number of small and medium size<br />
companies.<br />
11.45 Our discussions with the knowledgeables in the industry reveal that in view of the<br />
increasing health awareness, the total market for medical field of guazes will increase to<br />
Rs. 158 crores out of which market potential for spunlace based guazes will be 25% i.e.<br />
Rs. 39.5 crores (approx. Rs 40 crores ) by 2007-08.<br />
11.46 These market estimates have also accounted the time period required for setting up the spunlace<br />
unit, marketing & promotional efforts, etc. in creating the market for spunlace guazes replacing the<br />
traditional woven guazes<br />
255
Appendix – 5A (Contd…)<br />
11.47 The current practice in India for manufacturing Healthcare Disposables like<br />
Caps, Masks, Gowns, Drapes, Beddings, is through the use of Spunbond fabric. With<br />
regard to the choice between spunlace and spunbond fabric, the trend in India for caps<br />
and masks which are mass production items would be for spunbond whereas for drapes<br />
and gowns would be either spunlace or spunbond.<br />
11.48 Another important factor is the price differential between the spunbond and<br />
spunlace fabric [Spunbond Price: $2/kg; Spunlace Price: $3/kg - International prices]. The<br />
landed cost of spunbond is around Rs 100 - 125 per kg and spunlace is around Rs.150 -<br />
175 per kg.<br />
11.49 The current and future market potential for the healthcare disposable products is as shown below:<br />
Reusable / Washable Textiles Demand for Nonwovens (Spunlace<br />
Fabric)<br />
2001-02 2003 - 04 2007 - 08 2001-02 2003-04 2007 - 08<br />
Beddings Rs. 0.73 cr. Rs. 4.74 cr. Rs. 32.05 cr. - - Rs. 4.49 cr.<br />
(62.02) (403.02) (2722.74) - - (272.27 T)<br />
Clothings Rs. 2.00 cr. Rs. 5.20 cr. Rs. 21.95 cr. - - Rs. 6.42 cr.<br />
(177.38) (461.06) (1946.76) - - (389.35T)<br />
Covers Rs. 0.47 cr. Rs. 1.21 cr. Rs. 6.12 cr. - - Rs. 0.87 cr.<br />
(40.26) (104.64) (530.21) - - (53.02T)<br />
Total Rs. 3.20 cr. Rs. 11.15 cr. Rs. 60.12 cr. - - Rs. 11.78 cr.<br />
(279.66) (968.72) (5199.71) - - (714.64 T)<br />
Fig. in brackets denote values in tonnes.<br />
11.50 Thus the market potential for spunlace fabric from the healthcare sector is shown in the table and<br />
the actual realisation would depend on the combined efforts of the concerned ministry, existing fabric<br />
manufacturers and the user sector (hospitals, nursing homes, etc.).<br />
11.51 Thus the total market for Spunlace Fabric from the above sectors would be as<br />
follows:<br />
256
Item Market Size<br />
(Rs. Cr.)<br />
2001-02<br />
(Estimated)<br />
Market Size<br />
(Rs. Cr.)<br />
2003-04<br />
(Estimated)<br />
Appendix – 5A (Contd…)<br />
Market Size<br />
(Rs. Cr.)<br />
2007-08<br />
(Projected)<br />
Wipes - 25.00 110.00<br />
Guazes 2.52 7.28 40.00<br />
Healthcare Applications - - 11.78<br />
Total Spunlace Market 2.52 32.28 242.69*<br />
*The total includes the exports of 50% on total Domestic market of Rs. 161.78 Cr. i.e. Rs. 80.91 Cr.<br />
Other Technologies Available For Producing The Following Products:<br />
Products Other Technologies<br />
Healthcare Applications Spunbond<br />
SECTI<strong>ON</strong> III : SPUNLACE TECHNOLOGY AND EQUIPMENTS<br />
SUPPLIERS<br />
Process Description:<br />
11.52 Spunlacing is a process of entangling a web of loose fibers on a porous belt or<br />
moving perforated or patterned screen to form a sheet structure by subjecting the fibers to<br />
multiple rows of fine high-pressure jets of water. Various steps are of importance in the<br />
hydroentangling process. The steps characteristic for producing hydroentangled<br />
nonwoven fabric include:<br />
Precursor web formation<br />
1. The formed web (usually air-laid or wet-laid) is first compacted and prewetted to<br />
eliminate air pockets and then water-needled. The water pressure generally<br />
increases from the first to the last injectors. Pressures as high as 2200 psi are used to<br />
direct the water jets onto the web. This pressure is sufficient for most nonwoven<br />
fibers, although higher pressures are used in specialized applications.<br />
2. The impinging of the water jets on the web causes the entanglement of fibers. The<br />
jets exhaust most of the kinetic energy primarily in rearranging fibers within the<br />
web and, secondly, in rebounding against the substrates, dissipating energy to the<br />
fibers. A vacuum within the roll removes used water from the product, preventing<br />
flooding of the product and reduction in the effectiveness of the jets to move the<br />
fibers and cause entanglement.<br />
257
Appendix – 5A (Contd…)<br />
3. Usually, hydroentanglement is applied on both sides in a step-wise manner. The<br />
first entanglement roll acts on the first side a number of times in order to impart to<br />
the web the desired amount of bonding and strength. The web then passes over a<br />
second entanglement roll in a reverse direction in order to treat and, thereby,<br />
consolidate the other side of the fabric. The hydroentangled product is then passed<br />
through a dewatering device where excess water is removed and the fabric is dried.<br />
Process Systems and Equipments<br />
The main process equipment of the spunlace line are listed below:<br />
1. Blow Room :<br />
• Bale Openers : 1.600 mm width,<br />
• Blending Conveyor,<br />
• Fibre Lubricating System,<br />
• Recycling of Fibres from the carding machines,<br />
• Horizontal Opener,<br />
• Blowers,<br />
• Super mix blenders,<br />
• Fine openers,<br />
• Air / Fiber Seperators with static Filters,<br />
• Electronic metal detector, etc.<br />
2. Injection Cards :<br />
• Volumetric Control Chute Feeds: Working Width-3700 mm,<br />
• System for Dust Suction,<br />
• Weighing Bridges,<br />
• Injection Cards : 3700 mm width,<br />
• Card Suction system,<br />
• System for webs suction,<br />
• Lateral Foot Boards, etc.<br />
3. Spunlace (Hydroentanglement) Line,<br />
Three entanglement cylinders with five injectors, dewatering conveyors and<br />
complete filtration system for fibres including all aperturing capabilities.<br />
• Water jets working width : 2500 mm,<br />
• Production Rating Max : 800 kgs / hr,<br />
• Web : 30 to 100 gsm,<br />
• Fibres denier : 1 to 3,<br />
258
• Fibber type : Polyester, Polypropylene, viscose and Blends<br />
4. Dryer<br />
• Design basis weight of product : 30 to 220 gsm,<br />
Appendix – 5A (Contd…)<br />
• Maximum water content at the entrance of the dryer : 1.3 kg H2O per kg<br />
dry fibre,<br />
• Maximum working width : 3500 mm,<br />
• Speed (m / min) : 60 gsm designed product at 190 m / min<br />
• Rolls dimensions : 2.8 mt. (dia),<br />
• Hood, Airheater, Main Fans, etc.<br />
5. Automatic Winder and Inline Slitting machine:<br />
• Winder : Web Width - 3500 mm,<br />
• Inline Slitting system : Slitting Width : 100 mm<br />
• Winder Equipment with its accessory, driving system control desk,<br />
foundation plates, etc.<br />
Materials used in the spunlace technology<br />
11.53 Hydroentanglement could be carried out using dry-laid (carded or air-laid) or wet-<br />
laid webs as a precursor. Most commonly, precursors are mixtures of cellulose and man-<br />
made fibers (PET, PP, nylon, acrylics, Kevlar P84, (imide) etc.).<br />
11.54 In general, cellulosic fibers are preferred for their high strength, pliability, plastic<br />
deformation resistance and water insolubility. Cellulosic fibers are hydrophilic,<br />
chemically stable and relatively colorless. Another advantage is that cellulose has an<br />
inherent bonding ability caused by a high content of hydroxyl groups, which attract water<br />
molecules. As the water evaporates from the fabric, the hydroxyl groups on fiber surface<br />
link together by hydrogen bonds.<br />
11.55 Also, greige cotton has been used in spunlacing technology. It has been shown<br />
that the absorbency rate increases with increasing hydroentangling energy. This is the<br />
result of oil and wax removal from the fiber surface. These nonwovens can be<br />
subsequently bleached, which should raise the strength of the fabric<br />
Machinery Suppliers<br />
11.56 Globally, the three well known technology suppliers with proven track record<br />
contacted by TECS are:<br />
259
1. Rieter Perfojet (France),<br />
Local Representative:<br />
Rieter India Pvt. Ltd.,<br />
1005-1008, Hemkunt Tower,<br />
98, Nehru Place,<br />
New Delhi - 110 019.<br />
Tel.: (022) 2628 3896 / 2644 8501 / 02 / 03<br />
Fax: (022) 2644 8505<br />
2. Fleissner GmbH & Co. (Germany),<br />
Local Representative:<br />
A.T.E. Marketing Pvt. Ltd.,<br />
A-19, CTS No. 689, Veera Desai Road,<br />
Andheri (W), Mumbai - 400 053<br />
Tel: (022)-5676 6139 / 5676 6100<br />
Fax: (022)-2673 2446<br />
3. Taiwan Spunlace<br />
Appendix – 5A (Contd…)<br />
11.57 TECS has received responses from two of the global players and preliminary discussions were<br />
held with their local representatives in India.<br />
Recommended Minimum Economic Size:<br />
11.58 The spunlace project proposed to be set up in India will have a designed capacity<br />
of 800 kgs per hour<br />
11.59 Under Indian operating conditions it is safer to assume machine efficiency factor<br />
of 90%, and therefore the production would be 720 kgs per hour. The plant would operate<br />
in three shifts, 24 hours and 300 working days in a year.<br />
Investment in Process Plant and Machinery:<br />
11.60 The comparisons of the various technologies used in manufacturing the wipes in<br />
the global market are as shown below:<br />
11.61 The list of major equipments for the spunlace project is given above and as per<br />
the indicative budgetary quotations, the investment in the process plant and machinery<br />
will be Rs 24.30 crores (FOB). Finer details on the Equipment listing, specification and<br />
the quotations need to be discussed with the technology supplier before the project is<br />
taken up. Taking into account the CIF value, the custom duties (5%), inland<br />
260
Appendix – 5A (Contd…)<br />
transportation, erection and commissioning, the installed cost of process equipment<br />
would be Rs 28 crores.<br />
Note: The list contains the leading global players in Spunlace Technology and based on<br />
discussion with Industry experts the above list is exhaustive.<br />
SECTI<strong>ON</strong> III : PROJECT COST AND PR<strong>OF</strong>ITABILITY<br />
PROJECTI<strong>ON</strong>S<br />
Land<br />
11.62 The total requirement of land for this project keeping in mind the possible future expansion is<br />
around 6069 Sq. Mtrs. ( 1.5 acres ).<br />
11.63 Based on the available information, the cost of land is assumed at Rs 1200 per<br />
square meter (including the developmental cost). Depending on the exact location of the<br />
project to be determined by the promoter, the land cost could be higher or lower. Hence<br />
the total cost of developed land will be Rs 0.73 crore (Rs 73 lakhs).<br />
Buildings<br />
11.64 The building area comprising of main factory building, godowns, office, R & D<br />
labs/In-house Testing centre etc. would be 4000 sq. mtrs. The cost of construction would<br />
again vary depending on the structure and the materials to be used. It has been assumed<br />
that the average cost of construction would be Rs 4500 per sq. mt. Thus the total cost of<br />
building and other civil works would be around Rs 1.80 crores.<br />
261
Plant and Machinery<br />
Appendix – 5A (Contd…)<br />
11.65 Details of Plant and machinery as well as technology required for the project have<br />
been presented in earlier Section II . The installed cost of plant and machinery would be<br />
Rs 28 crores. Apart from the main process equipments, the other equipments required<br />
are:<br />
• Electricals,<br />
• Piping,<br />
• Water supply,<br />
• Compressors,<br />
• Fire fighting equipments etc.<br />
11.66 The provision on this count is taken as 3% of the cost of machinery which works<br />
out to Rs 0.84 crores.<br />
Captive Power Plant<br />
11.67 The cost for this unit is Rs 5.25 crores.<br />
Miscellaneous Fixed Assets<br />
11.68 Under this head the items included are Furniture and fixtures, Office equipments,<br />
Air Conditioners etc. and the provision made is around Rs 0.30 crore (Rs 30 lakhs) .<br />
Testing Equipments<br />
11.69 The testing equipments required for a Spunlace Unit are:<br />
• Laboratory Equipment, Dynamometer, Oven Dryer, Balance etc.,<br />
• In-line monitoring equipment - GSM, humidity etc.,<br />
• Metal Parts detection,<br />
• Air Handling, Humidification system,<br />
• Automatic Packing System.<br />
11.70 A provision of Rs 3.12 crores has been made on this account.<br />
Project Engineering and Consulting<br />
11.71 Under this head the items included are the fees and expenses on account of Architect fees, project<br />
engineering and management (both local and overseas ), detailed project reports etc.<br />
262
Preliminary & Preoperative Expenses<br />
Appendix – 5A (Contd…)<br />
11.72 The items included under this head are company formation expenses, public issue<br />
expenses (if any), interest during construction, pre production expenses during the<br />
implementation phase etc.<br />
Contingency Expenses<br />
11.73 Depending on the gestation period and further detailing of the project cost by the promoter, the<br />
contingency provision has been made at the rate of 10%.<br />
Margin Money for Working capital<br />
11.74 The margin money for working capital forming part of the total project cost would<br />
be Rs 3.40 crores. [Exhibit 11.3]<br />
Total Project Cost (Total Investment)<br />
11.75 The total project cost as shown in Exhibit 11.1 would be Rs 52.43 crores.<br />
Project Funding and Financing Pattern :<br />
11.76 It has been assumed that the project would be financed through long term funds and Equity<br />
participation by the Promoter / Public. The technical textile sector being a high priority area , it is<br />
assumed that a Debt- Equity ratio of 1.5 : 1 would be feasible. (However the sensitivity analysis has also<br />
been presented for 1 : 1 and 2 : 1 Debt Equity ratios.)<br />
Sales, Profitability and Sensitivity Analysis :<br />
Sales Realisation and Turnover<br />
11.77 As per the details available from the Technology and Equipment suppliers the economic size of a<br />
plant is 800 kgs per hour.<br />
11.78 Under the Indian conditions, it is assumed that the machine would operate at an<br />
efficiency level of 90%. Hence the production from the plant would be 720 kgs per hour.<br />
11.79 The plant would operate on Three-shift basis and 300 workings days in a year.<br />
11.80 The capacity utilisation for the 1st year is assumed at 75% and thereafter for the<br />
2nd and the 3rd year onwards 85% and 90% respectively.<br />
263
Appendix – 5A (Contd…)<br />
11.81 The average selling price of the end product would be Rs 165 per kg (net of<br />
excise duties, sales tax and other incidental expenses) The international price of the<br />
spunlace fabric is $3-$3.5 / kg.<br />
11.82 The details of projected sales turnover as projected are given in Exhibit 11.2.<br />
Cost of Production<br />
Major Raw materials and their specifications:<br />
11.83 The main raw materials used and the corresponding prevailing prices as an indicator are as<br />
follows:<br />
Raw Material Landed cost<br />
(inclusive of all duties)<br />
Polyester Staple Fiber (PSF) Rs. 65 / kg<br />
Viscose Rs. 75 / kg<br />
11.84 The two raw materials are taken in the ratio 1:1 and are used in the denier of 1.4<br />
and 1.6. The major suppliers of these raw materials are :<br />
(a) Reliance Industries Ltd.,<br />
(b) Grasim Industries Ltd.<br />
11.85 The requirement of these raw materials would be 5391.36 tonnes costing Rs 37.74<br />
crores after accounting for a process waste of 4%.<br />
Power Cost<br />
11.86 The connected load is 1076 kW. The power cost is Rs 2.51 crores<br />
Manpower, Salaries and Wages<br />
11.87 The manpower requirements and the salary structure is given in Exhibit 11.4.<br />
11.88 The total manpower requirement comprising the managerial cadre of supervisors, machine<br />
operators and helpers would be 62 persons.<br />
Factory and Overhead Expenses<br />
11.89 The items covered under this head are establishment expenses, repairs and maintenance, stationery,<br />
travel expenses, packaging expenses etc.<br />
264
Marketing and Promotional Expenses<br />
Appendix – 5A (Contd…)<br />
11.90 The promotion of technical textiles will call for expenditure on this count and a provision of 5%<br />
of the annual sales has been made uniformly over the years.<br />
Interest and Depreciation<br />
11.91 The prevailing interest rate for long term and short term borrowed funds is<br />
assumed at 5% and 11% per annum respectively. (Project covered under Technology<br />
Upgradation Fund)<br />
11.92 The repayment of loans has been assumed for 10 years with a moratorium period<br />
of two years (2+8).<br />
11.93 The depreciation rates have been worked out as per Company’s act (SLM) and<br />
Income-Tax Ready Reckoner (WDV).<br />
11.94 The current corporate tax rate is assumed at 35% and the surcharge is assumed at<br />
2.5% per annum.<br />
Profitability, Break-even, IRR and Payback<br />
11.95 As presented in Exhibit 11.5, the sales turnover increases from Rs 62.87 crore in<br />
the first year to Rs 75.44 crore from the 3rd year onwards<br />
11.96 The PBT increases from Rs 21.99 crore in the first year to Rs 27.19 crore in the<br />
tenth year.<br />
11.97 The Break Even of the project is at 28.06%.<br />
11.98 The Internal Rate of Return ( IRR ) has been worked out at 41.03%.<br />
11.99 The Payback period for the project is 2.39 years.<br />
Sensitivity Analysis<br />
11.100 The sensitivity analysis has been presented in the Exhibit 11.6.<br />
DEVELOPMENTAL AND PROMOTI<strong>ON</strong>AL MEASURES.<br />
11.101 This project is a state-of-the-art high tech and capital intensive project with a total<br />
investment of Rs.50 crores.<br />
11.102 The Indian market is not yet ready for the wipes, as the current consumption is<br />
265
Appendix – 5A (Contd…)<br />
very negligible due to the availability of cheaper substitutes such as mops manufactured<br />
from natural fibre waste.<br />
11.103 However at the initial stages the product promotion has to be through chain of<br />
converting line using imported spunlace fabric and once, the market expands, then the<br />
mother unit could be set up.<br />
11.104 The Indian Pharmacopoeia (IP) needs to be upgraded to take cognisance of the<br />
latest developments in the wipes and hygiene market and the guazes and wipes should be<br />
incorporated in the IP.<br />
11.105 A legislation for hygiene products should be introduced for preventing the use<br />
of raw cotton and the unhygienic manufacturing process adopted for manufacturing<br />
guazes and other medical products in the decentralised sector.<br />
11.106 Converting lines for hygienic, baby, adult, household, toilet, bathroom and floor wipes would<br />
require an investment of around S$600,00 (Entry level machine) or US$798,000 for the higher level<br />
machine. The machine gives an output of 75 packs per minute. These wipes so manufactured would require<br />
a value addition of around 40% in selling price of the spunlace fabric.<br />
266
Exhibit 11.1<br />
PROJECT COST<br />
(LAND, BUILDINGS, PROCESS PLANT & MACHINERY, UTILITIES & O<strong>THE</strong>R ASSETS)<br />
Project Cost (Rs. Cr.)<br />
1 Land 0.73<br />
Area: 1.5 acres ( 6069 Sq Mtrs)<br />
Rate: (Rs.1200 /Sq. Mtr)<br />
2 Buildings 1.80<br />
Plant Area, Office, Godown, Lab, Service Area etc.)<br />
Built-up Area : 4000 Sq. Mtrs<br />
Avg Rate : Rs. 4500 /Sq. Mtrs<br />
3 Process Plant & Equipment 28.00<br />
4 Utility & Other equipments (3%) 0.84<br />
5 Captive Power Plant 5.25<br />
5 Misc. Fixed Assets 0.30<br />
(Furniture & Fixtures, Office Equipment, Testing Lab etc.)<br />
6 Testing Lab Equipments 3.12<br />
(Furnished in Section III)<br />
7 Project Engineering & Consultancy charges (2.5%) 0.76<br />
8 Preliminary & Pre-operative Expenses (12%) 3.76<br />
(Company Formation, Interest during construction,<br />
pre-production expenses, etc.)<br />
9 Contingency (10 %) 4.46<br />
10 Total 49.03<br />
11 Margin Money for Working Capital 3.40<br />
12 Total Project Cost 52.43<br />
267
Exhibit 11.2<br />
ESTIMATI<strong>ON</strong> <strong>OF</strong> SALES REVENUE<br />
ITEM YEAR <strong>OF</strong> OPERATI<strong>ON</strong><br />
I II III IV V VI VII VIII IX X<br />
Average Production per hour (kg) 800 800 800 800 800 800 800 800 800 800<br />
90% efficiency 720 720 720 720 720 720 720 720 720 720<br />
Capacity Utilisation 75% 85% 90% 90% 90% 90% 90% 90% 90% 90%<br />
Actual Production per hour 540 612 648 648 648 648 648 648 648 648<br />
Production per day (kg) 12960 14688 15552 15552 15552 15552 15552 15552 15552 15552<br />
(Rs. Cr.)<br />
Production for 300 working days (kg) 3888000 4406400 4665600 4665600 4665600 4665600 4665600 4665600 4665600 4665600<br />
(In tonnes) 3888.00 4406.40 4665.60 4665.60 4665.60 4665.60 4665.60 4665.60 4665.60 4665.60<br />
Selling Price (Rs/Kg) 165.00 165.00 165.00 165.00 165.00 165.00 165.00 165.00 165.00 165.00<br />
Sales Revenue (Rs. Cr) 64.15 72.71 76.98 76.98 76.98 76.98 76.98 76.98 76.98 76.98<br />
Value Loss ( 2% ) 1.28 1.45 1.54 1.54 1.54 1.54 1.54 1.54 1.54 1.54<br />
Net Sales Revenue (Rs. Cr) 62.87 71.25 75.44 75.44 75.44 75.44 75.44 75.44 75.44 75.44<br />
268
Factory Related<br />
EXHIBIT 11.3<br />
REQUIREMENT <strong>OF</strong> WORKING CAPITAL<br />
ITEM NO. <strong>OF</strong> MARGIN YEAR I YEAR II YEAR III YEAR IV<br />
(Rs.Lakhs)<br />
YEAR V<br />
M<strong>ON</strong>THS (%) W.CAP MARGIN BANK W.CAP MARGIN BANK W.CAP MARGIN BANK W.CAP MARGIN BANK W.CAP MARGIN BANK<br />
REQMT M<strong>ON</strong>EY FINANCEREQMT M<strong>ON</strong>EY FINANCE REQMT M<strong>ON</strong>EY FINANCEREQMT M<strong>ON</strong>EY FINANCE REQMT M<strong>ON</strong>EY FINANCE<br />
Raw materials & other com. 2.00 25.00 4.72 1.18 3.54 5.35 1.34 4.01 5.66 1.42 4.25 5.66 1.42 4.25 5.66 1.42 4.25<br />
Goods in process 0.25 25.00 0.67 0.17 0.51 0.77 0.19 0.58 0.81 0.20 0.61 0.82 0.20 0.61 0.82 0.20 0.61<br />
Finished Goods 1.00 25.00 2.96 0.74 2.22 3.38 0.85 2.54 3.57 0.89 2.68 3.58 0.89 2.68 3.58 0.89 2.68<br />
A/c Receivable 1.00 25.00 5.24 1.31 3.93 5.94 1.48 4.45 6.29 1.57 4.72 6.29 1.57 4.72 6.29 1.57 4.72<br />
Cash in hand<br />
Salaries & wages 1.00 0.00 0.07 0.00 0.07 0.07 0.00 0.07 0.07 0.00 0.07 0.08 0.00 0.08 0.08 0.00 0.08<br />
Utilities 1.00 0.00 0.10 0.00 0.10 0.18 0.00 0.18 0.19 0.00 0.19 0.19 0.00 0.19 0.19 0.00 0.19<br />
Marketing & Promotional Expenses 1.00 0.00 0.26 0.00 0.26 0.30 0.00 0.30 0.31 0.00 0.31 0.31 0.00 0.31 0.31 0.00 0.31<br />
Admin. Overheads 1.00 0.00 0.11 0.00 0.11 0.11 0.00 0.11 0.11 0.00 0.11 0.11 0.00 0.11 0.11 0.00 0.11<br />
Total Requirement 14.08 3.40 10.68 16.04 3.86 12.18 16.97 4.08 12.89 16.98 4.08 12.89 16.99 4.09 12.90<br />
269
EXHIBIT 11.3 (C<strong>ON</strong>TD...)<br />
REQUIREMENT <strong>OF</strong> WORKING CAPITAL<br />
ITEM NO. <strong>OF</strong> MARGIN YEAR VI YEAR VII YEAR VIII YEAR IX<br />
(Rs.Lakhs)<br />
YEAR X<br />
Factory Related<br />
M<strong>ON</strong>THS (%) W.CAP MARGIN BANK W.CAP MARGIN BANK W.CAP MARGIN BANK W.CAP MARGIN BANK W.CAP MARGIN BANK<br />
REQMT M<strong>ON</strong>EY FINANCEREQMT M<strong>ON</strong>EY FINANCEREQMT M<strong>ON</strong>EY FINANCEREQMT M<strong>ON</strong>EY FINANCEREQMT M<strong>ON</strong>EY FINANCE<br />
Raw materials & other 2.00 25.00 5.66 1.42 4.25 5.66 1.42 4.25 5.66 1.42 4.25 5.66 1.42 4.25 5.66 1.42 4.25<br />
Goods in Process 0.50 25.00 1.64 0.41 1.23 1.64 0.41 1.23 1.64 0.41 1.23 1.65 0.41 1.24 1.65 0.41 1.24<br />
Finished Goods Stock 1.00 25.00 3.59 0.90 2.69 3.59 0.90 2.69 3.60 0.90 2.70 3.61 0.90 2.71 3.62 0.90 2.71<br />
A/c Receivable 1.00 25.00 6.29 1.57 4.72 6.29 1.57 4.72 6.29 1.57 4.72 6.29 1.57 4.72 6.29 1.57 4.72<br />
Cash in hand<br />
Salaries & wages 1.00 0.00 0.09 0.00 0.09 0.09 0.00 0.09 0.10 0.00 0.10 0.11 0.00 0.11 0.12 0.00 0.12<br />
Utilities 1.00 0.00 0.11 0.00 0.11 0.11 0.00 0.11 0.11 0.00 0.11 0.11 0.00 0.11 0.11 0.00 0.11<br />
Marketing & Promotional Expenses 1.00 0.00 0.06 0.00 0.06 0.06 0.00 0.06 0.06 0.00 0.06 0.06 0.00 0.06 0.06 0.00 0.06<br />
Admin. Overheads 1.00 0.00 0.31 0.00 0.31 0.31 0.00 0.31 0.31 0.00 0.31 0.31 0.00 0.31 0.31 0.00 0.31<br />
Total Requirement 17.93 4.29 13.63 17.94 4.30 13.65 17.96 4.30 13.66 17.98 4.30 13.68 18.00 4.30 13.70<br />
270
Exhibit 11.4<br />
MANPOWER REQUIREMENTS<br />
Nos Monthly Total Mon. Annual<br />
General Manager 1 30000 30000 360000<br />
Production Manager 1 20000 20000 240000<br />
Machine Operators 12 6000 72000 864000<br />
Machine Helper (Semi Skilled) 9 3000 27000 324000<br />
Material Handling 3 6000 18000 216000<br />
R&D, Testing 6 10000 60000 720000<br />
Marketing & Sales<br />
Marketing Head 1 25000 25000 300000<br />
Sales Team 5 12000 60000 720000<br />
Clerical Staff 10 6000 60000 720000<br />
Other Staff (Peon, Security) 5 3000 15000 180000<br />
Maintenance Department 9 10000 90000 1080000<br />
TOTAL 62 477000 5724000<br />
Fringe Benefits (40 % of the above) 2289600<br />
Total Wage Bill (Annual) Rs. lakhs: Salary + Other Benefits = 8013600.00<br />
Total Wage Bill (Annual) Rs. Cr.: 0.80136<br />
271
Exhibit 11.5<br />
PR<strong>OF</strong>ITABILITY STATEMENT AND COMPUTATI<strong>ON</strong> <strong>OF</strong> TAX<br />
(Rs.Cr)<br />
ACCOUNT HEAD FINANCIAL YEAR <strong>OF</strong> OPERATI<strong>ON</strong><br />
I II III IV V VI VII VIII IX X<br />
Revenue<br />
Net Sales Turnover 62.87 71.25 75.44 75.44 75.44 75.44 75.44 75.44 75.44 75.44<br />
Total Revenue 62.87 71.25 75.44 75.44 75.44 75.44 75.44 75.44 75.44 75.44<br />
Expenses<br />
Raw Materials 28.30 32.08 33.97 33.97 33.97 33.97 33.97 33.97 33.97 33.97<br />
Salaries & wages 0.80 0.84 0.88 0.93 0.97 1.05 1.14 1.23 1.33 1.43<br />
Conversion Costs (Power, Fuel, Stores & Other 1.26 Expenses 2.13 including 2.26 packing materials) 2.26 2.26 2.26 2.26 2.26 2.26 2.26<br />
Marketing & Promotional Expenses 3.14 3.56 3.77 3.77 3.77 3.77 3.77 3.77 3.77 3.77<br />
Factory & Office Overheads 1.28 1.28 1.28 1.28 1.28 1.28 1.28 1.28 1.28 1.28<br />
Interest on S.T. Loans 1.18 1.34 1.42 1.42 1.42 1.50 1.50 1.50 1.50 1.51<br />
Cost of Sales 36.66 41.94 44.28 44.33 44.37 44.53 44.62 44.71 44.81 44.92<br />
Depreciation (St.Line) 2.52 2.52 2.52 2.52 2.52 2.52 2.52 2.52 2.52 2.52<br />
Amort. of Expenses 0.13 0.13 0.13 0.13 0.13 0.13 0.00 0.00 0.00 0.00<br />
Interest on L.T Loan 1.57 1.57 1.47 1.28 1.08 0.88 0.69 0.49 0.29 0.10<br />
Profit Before Tax 21.99 25.09 27.04 27.19 27.34 27.38 27.62 27.72 27.82 27.91<br />
Tax 4.80 6.73 8.05 8.58 8.99 9.27 9.56 9.75 9.90 10.02<br />
Profit After Tax 17.19 18.36 19.00 18.62 18.35 18.11 18.06 17.97 17.92 17.89<br />
Dividend 0.00 0.00 1.05 1.05 1.05 2.10 2.10 2.10 2.10 2.10<br />
Profits For Appropriation 17.19 18.36 17.95 17.57 17.31 16.01 15.96 15.87 15.82 15.79<br />
COMPUTATI<strong>ON</strong> <strong>OF</strong> TAX<br />
Profit after interest before depreciation 24.51 27.61 29.56 29.71 29.86 29.90 30.14 30.24 30.34 30.43<br />
Depr.(WDV) to be claimed 10.78 8.38 6.57 5.21 4.18 3.41 2.82 2.38 2.04 1.79<br />
Depreciation claimed 10.78 8.38 6.57 5.21 4.18 3.41 2.82 2.38 2.04 1.79<br />
Depr. carried forward 0.00 0.00 0.00 0.00 0.00 0.00 0.00 0.00 0.00 0.00<br />
Taxable Profit 13.72 19.23 22.99 24.50 25.68 26.49 27.32 27.86 28.29 28.64<br />
Profit Before Tax (Book) 21.99 25.09 27.04 27.19 27.34 27.38 27.62 27.72 27.82 27.91<br />
Minimum Alternate Tax 0.00 0.00 0.00 0.00 0.00 0.00 0.00 0.00 0.00 0.00<br />
Tax (Actual) 4.80 6.73 8.05 8.58 8.99 9.27 9.56 9.75 9.90 10.02<br />
Tax Provision 4.80 6.73 8.05 8.58 8.99 9.27 9.56 9.75 9.90 10.02<br />
272
EXHIBIT 11.6<br />
SENSITIVITY ANALYSIS<br />
Items Profit after Tax<br />
(PAT)<br />
Rs. Cr.<br />
(assumed at 90 %<br />
capacity)<br />
Break<br />
Even<br />
(%)<br />
Appendix – 5A (Contd…)<br />
Internal<br />
Rate of<br />
Return<br />
(IRR)<br />
(%)<br />
Payback<br />
Period<br />
(Years)<br />
NORMAL VALUES 18.62 28.06 41.03 2.39<br />
Debt Equity Ratios<br />
(a) 2:1<br />
(b) 1:1<br />
Increase in Project Cost<br />
by 10 %<br />
Decrease in Selling<br />
Price to Rs 155<br />
Increase in Selling Price<br />
to Rs 175<br />
Decrease in Raw<br />
Material Prices by 10%<br />
18.52<br />
18.76<br />
28.43<br />
27.50<br />
41.44<br />
40.88<br />
2.39<br />
2.40<br />
15.71 32.11 33.18 2.87<br />
15.87 30.96 35.97 2.68<br />
18.62 28.06 41.03 2.39<br />
18.13 28.02 40.38 2.43<br />
273
SURGICAL DRESSINGS COMPLEX<br />
Appendix - 5A (Contd…)<br />
SECTI<strong>ON</strong> I : PRODUCT BRIEF, APPLICATI<strong>ON</strong> AREAS AND<br />
MARKET POTENTIAL<br />
12.1 Wound healing is a dynamic process & the requirements of the dressing change as<br />
the wound healing progresses. For effective wound management, extensive knowledge of<br />
tissue repair and that of the dressing properties is necessary, as no single dressing is<br />
universally available for all types of wounds.<br />
12.2 Broadly items included are as follows:<br />
Absorbent Pad – Wound<br />
contact layer – Backing<br />
Layer – surgical Pads<br />
Elastic<br />
Bandages<br />
Light<br />
Support<br />
Bandages<br />
and Crepe<br />
Bandages<br />
Non adhering dressings<br />
(including Island, Hypoallergenic<br />
and Tulle<br />
dressings)<br />
Inelastic<br />
Bandages<br />
Surgical Dressings<br />
Wound Care Products Castings & Bandages<br />
Open<br />
woven<br />
Bandages<br />
Surgical Adhesive Tapes<br />
(including Woven, Nonwoven<br />
and Perforated)<br />
Orthopedic<br />
Cushion<br />
Plaster<br />
of<br />
Paris<br />
(POP)<br />
Gauzes,<br />
Guaze<br />
Swabs,<br />
Waddings<br />
Absorbent<br />
Lint<br />
275
Appendix - 5A (Contd…)<br />
12.3 The surgical dressings are required to have the following characteristics :<br />
♦ Ease of application, Good padding characteristics,<br />
♦ Non-sticking nature to the wound and painless on removal,<br />
♦ Creation of an optimal environment for wound healing,<br />
♦ Require fewer dressing changes, thereby reduce the nursing time,<br />
♦ Softness, Pliability,<br />
♦ Highly absorbent,<br />
♦ Easily cleanable, etc.<br />
I. Wound Care Products : Product Composition<br />
A. Wound Contact Layer-Absorbent pad-Backing Layer<br />
12.4 Traditional wound dressings have been made from cellulosic fibres such as<br />
cotton and viscose rayon, in the form of a woven or non-woven pad or guaze. Modern<br />
wound dressings are composed of absorbent layers held between a wound contact layer<br />
and a backing layer. Alternatively, dressings are also available with just the two layers;<br />
wound contact layer and the backing layer.<br />
12.5 The wound contact layer (primary dressing) is generally placed directly over<br />
the wound. It is low adherent and can easily be removed without disturbing new tissue<br />
growth. The wound contact layer is perforated made of Silk, Polyamide, Viscose,<br />
Polyethylene of Knitted, woven, non-woven material.<br />
12.6 The absorbent layer (pad) is a nonwoven material made of bleached Cotton,<br />
Viscose and other synthetic materials. Viscose helps to absorb the fluids while synthetic<br />
helps to maintain the thickness of the pad even after absorbing the fluids. Absorbent pads<br />
are also available as individual single use items, which are cotton pads covered with a<br />
guaze cloth.<br />
12.7 The backing layer is a non-woven of cellulosic material or plastic film.<br />
12.8 Thus the complete dressing has a wound contact layer placed over the wound and<br />
covered with an absorbent pad, and the whole dressing retained with a backing layer. The<br />
function of the wound contact layer is to pass the pus or the other exudates from the<br />
wound to the backing layer, which then absorbs it, and to allow the medication to reach<br />
the wound from the backing layer.<br />
276
Appendix - 5A (Contd…)<br />
B. Non-adherent Dressings (including Island, Hypo-allergenic, Tulle dressings):<br />
12.9 Non-adherent Dressings (Tulle Gras) are applied to avoid adhesion when<br />
dealing with large area wounds such as burns and skin grafts. They are paraffin gauze<br />
dressings having a soft paraffin base and gels for keeping the wound moist and at the<br />
same time absorbing the exudate. These dressings are also medicated with an antibiotic<br />
or any topical antiseptic. For use in tropical countries, suitable mixture of hard<br />
paraffin and soft paraffin is used. Fabrics made from continuous filaments yarns,<br />
viscose, rayon are used. Knitted fabrics are very satisfactory. The open structure of fabric<br />
is important with a leno weave imparting stability to the dressing.<br />
C. Surgical Adhesive Tapes (including Woven, Non-woven and Perforated):<br />
12.10 Surgical adhesive tapes are manufactured both from woven and non-woven<br />
fabrics. The future trend is likely to for the use of non-woven fabric only. Nonwoven<br />
Tapes consist of backing material of nonwoven synthetic fibres, laid in a net or randomly<br />
and bonded in or on evenly spread non-occlusive acrylic adhesive mass. They are<br />
permeable to air and water vapour, and this results in the maintenance of the normal<br />
environment at the skin surface beneath the tape. They are light in weight and their<br />
cohesive characteristics allow them to be removed from the skin without leaving debris<br />
on the surface.<br />
II. Bandages : Product Composition<br />
A. Elastic Bandages<br />
12.11 Elastic Bandages are cotton crepe bandages consisting of high twist yarns<br />
imparting the necessary elasticity used in treating vericose veins. They are manufactured<br />
by weaving and warping the thread/yarn and the cloth is then processed in water based<br />
bath causing it to shrink and then after drying it develops it’s properties for stretchbility<br />
and regain so as to conform to body contours and provide compression support. The<br />
bandages consist of two types of twists: S twist (clockwise) and Z twist (Anti clockwise).<br />
B. Light Support Bandages<br />
12.12 Light Support Bandages provides retention and prevents development of a<br />
deformity change in the shape of a mass of tissue owing to swelling or sagging.<br />
277
C. Inelastic Bandages<br />
Appendix - 5A (Contd…)<br />
12.13 Inelastic Bandages are medicated cloth bandages. These three are grouped<br />
together as Adhesive Bandages. They have a layer of adhesive impregnated on the cloth<br />
layer.<br />
D. Open wove bandages<br />
12.14 Open wove bandages consists of a cloth of plain weave made of cotton, viscose<br />
or combined cotton and viscose yarns. It is used mainly to protect absorbent dressings<br />
and to hold them in place. It gives a degree of support and provides partial restriction of<br />
movement, which can assist in rapid healing of the wound.<br />
E. Orthopedic Cushion Bandages<br />
12.15 Orthopedic Cushions are made of cotton and synthetics. These bandages retain<br />
their cushioning effect in the moist atmosphere between skin and plaster. In India, cotton<br />
rolls are used for this purpose where a fluffy cotton layer is rolled together and applied on<br />
the fractured area to serve as a protection layer and does the function of shock absorber,<br />
thus protecting the damaged area. However this conventional cotton layer has been<br />
replaced by needle punched nonwoven viscose of uniform grammage of around 100 gsm<br />
for tropical climate and a similar nonwoven is also available in polyester for cold climate.<br />
F. Plaster of Paris<br />
12.16 The Plaster of Paris bandages are made of cotton guaze material of Leno<br />
weave cloth. The interlocking thread is impregnated in the plaster of paris slurry<br />
consisting of binding agents, antiseptic, wetting agents including solvents that are oven<br />
dried and then slit into the required size for bandages. The main function is limb<br />
protection and to render the limb immobile to allow the dislocated bones to regain it’s<br />
original shape. Now-a-days, Synthetic Casting Materials are also available.<br />
G. Gauzes and Guaze Swabs<br />
12.17 Guaze consist of either cotton cloth or a mixed cotton and viscose cloth,<br />
containing upto 45% of viscose. Guaze absorbs water and fluids readily and is used in a<br />
number of simple and compound absorbent products.<br />
12.18 Guaze Swabs are the simple absorbent type, produced by folding into rectangles or<br />
squares in such a manner that the cut edges of the cloth are not exposed. Guazes and<br />
swabs are used pre-operatively (to swab the area of the skin prior to the operations),<br />
during operations (to absorb blood and body fluids) and post-operatively.<br />
278
H. Waddings<br />
Appendix - 5A (Contd…)<br />
12.19 Waddings are single use cotton pieces in great demand abroad. In India, for<br />
clinical practice as well as for domestic purposes cotton rolls are preferred, pieces of<br />
cotton are removed as and when required. In the foreign countries, the sterile, single-use<br />
cotton waddings are highly popular.<br />
I. Absorbent Lint<br />
12.20 Absorbent Lint consists of cloth of plain weave made of cotton or viscose or<br />
combination of the two. It absorbs water and fluid readily. In its unmedicated form it is<br />
used as an external absorbent and protective dressing, and is used widely in first aid<br />
treatment in home. It is also used with medications in wound application.<br />
12.21 The Surgical Products world over is classified under the category of Medical<br />
Devices whereas in India, it falls under the purview of Drugs and Cosmetics Act 1940.<br />
Medical Devices are classified into Low Risk, Medium Risk, High Risk and Very High<br />
Risk, based on the risk management and product claims made by the manufacturer.<br />
Target Areas<br />
12.22 The major sales of these items are through the Health Departments,<br />
Institutions/Hospitals, Nursing Homes and Clinics requiring the wound care products<br />
in their Operation Theaters, Out Patient Department (OPD), etc.<br />
12.23 The retail sales are from the general practitioners requiring the product for their<br />
practice and the individuals buying it for their first aid boxes and other household<br />
requirements.<br />
Producers of Surgical Dressings in India<br />
12.24 The wound care and wound management industry is distributed between the<br />
organized sector representing the MNCs and the SSI / Cottage Scale sector.<br />
12.25 Some of the players representing the organized sector are:<br />
♦ Johnson & Johnson Ltd. ♦ Golden Surgimed Ltd.<br />
♦ Smith & Nephew ♦ Beiersdorf India Ltd.<br />
♦ 3M India Ltd. ♦ Elder Pharmaceuticals Ltd. (Hartmann Div.)<br />
♦ Casil Health Products Ltd. ♦ Dr. Sabharwal Laboratories<br />
♦ Carl - Otto ♦ Dutt Mediproducts<br />
♦ Ramaraju Surgicals Pvt.<br />
Ltd.<br />
♦ Dynamic Orthopaedics Pvt. Ltd.<br />
279
Appendix - 5A (Contd…)<br />
12.26 In India it is an established practice to have the company manufacturing complete<br />
range of products partly through contract manufacturing and the then selling it through<br />
retail and institutional markets. The high operational cost makes it uneconomical for the<br />
companies to undertake their own manufacturing.<br />
Market Size for Surgical Dressings (2001 - 02)<br />
12.27 Based on the industry feedback the market size of wound care surgicals in 2001<br />
– 02, was assessed at around Rs. 450 crores with the units concentrated in Delhi,<br />
Ichalkaranji, Jalgaon, Meerut, Modinagar, Mumbai, Palghar, Rajapalayam, etc.<br />
(However, the unconfirmed sources have projected the market size to be around Rs. 1000<br />
- 1200 Crores. in 2001-02, but the market size of around Rs. 450 Crores in 2001-02<br />
appears more realistic)<br />
12.28 The major sales of the surgical dressings are through the State Health<br />
Departments, Institutions/Hospitals accounting for nearly 60% of the total sales of the<br />
surgical dressings. The Retail Sales through the individuals and the general practitioners<br />
account for 40% of the sales of the product in the Rs. 450 cr. Market.<br />
R e ta il<br />
4 0 %<br />
S u r g i c a l D r e ssi n g s M a r k e t:<br />
R s. 4 5 0 c r o r e s (2 0 0 1 - 0 2 )<br />
In s titu tio n a l<br />
6 0 %<br />
12.29 Major group wise assessed market has shown that the various bandages have a<br />
larger share (65%) of the market share pie as compared to the wound care products<br />
(35%). This has been depicted graphically as follows<br />
280
W ound Care<br />
Produc ts<br />
35%<br />
S urgica l Dre ssing M a rke t:<br />
Rs. 450 cro re s (2001 - 02)<br />
12.30 Each of the group-based segmentation is as follows:<br />
Elastic /<br />
Inealstic<br />
Bandages<br />
30%<br />
Appendix - 5A (Contd…)<br />
Bandages<br />
65%<br />
Bandages Wound Care Products<br />
Bandages Market Size:<br />
Rs. 292 crores (2001 - 02)<br />
Plasters /<br />
Wadding /<br />
Orthopaedic<br />
Cusion<br />
35%<br />
Guazes /<br />
Lint<br />
35%<br />
Perforated<br />
Films<br />
5%<br />
Wound Care Products Market Size:<br />
Rs. 158 crores (2001 - 02)<br />
Non-adherent<br />
dressings<br />
10%<br />
12.31 The high tech sector having the presence of the MNCs, contract manufacturing<br />
has become the natural practice due to high operational cost making it uneconomical for<br />
the companies to undertake their own manufacturing.<br />
12.32 In view of the unstructured status of the industry, our survey has revealed that the<br />
anticipated growth is unlikely to be more than 5-10% p.a. (Avg. 7.5%).<br />
12.33 Hence the future market potential of these products is expected can be summarised<br />
as follows:<br />
Wound Contact<br />
Layer /<br />
Absorbent Pad /<br />
Base Material<br />
85%<br />
281
Appendix - 5A (Contd…)<br />
Year Market Size (Rs. Cr.)<br />
2001 - 02 450.00<br />
2003 - 04 (Estm.) 520.03<br />
2007 -08 (Proj.) 694.48<br />
12.34 This group covers highly heterogeneous range of items available in different<br />
medical sizes, shapes and configuration depending upon the end use application in the<br />
hospitals and for retail trade.<br />
12.35 The hospitals, the existing establishments of these products, dealers and agents,<br />
are of the opinion that this is a slow growth industry where any company can set up an<br />
unit, resulting in unhealthy competition leading to price cutting. Some of the individual<br />
segments are facing the onslaught of new products thus degrowing the market<br />
Surgical Dressings Sector: Impediments and Main Issues of Concern<br />
12.36 In the Indian context, the industry is concentrated in the cottage and the<br />
unorganized sector using:<br />
♦ Local obsolete technology,<br />
♦ No testing facilities,<br />
♦ Absence of Research & Development facility.<br />
12.37 There is no standard testing facility available at the All India level, while these<br />
products need to be checked for bioburden, biocompatibility, and cytotoxicity, nor any<br />
clinical trials being undertaken for new products that are being imported.<br />
12.38 This industry is facing problems like unhealthy competition and threat from the<br />
decentralised sector flooding the market with low quality, substandard products.<br />
12.39 The taxes are paid only by the organised sector whereas tax evasion being<br />
rampant in the unorganized sector. The unorganized sector is known to operate on the<br />
power looms, and at the same time claiming to be operating on handlooms to avail of the<br />
tax benefits.<br />
12.40 The main competitor for India in the Meditech segment is China. The Chinese<br />
products are 25 - 40 % cheaper due to low raw material costs, better infrastructure, large<br />
production capacities in conjunction with better technology making it economically<br />
282
Appendix - 5A (Contd…)<br />
feasible for them to sell their products at a very low price. The Chinese units are lax in<br />
following any standards. For example, the Chinese Adhesive Tapes don’t confirm to any<br />
pharmacopoeial standards while the Indian Adhesive Tapes are manufactured according<br />
to the USP standards making it mandatory to perform all the tests, thus increasing the<br />
costs. The Chinese also score over India in the resources available like the labour and<br />
infrastructure.<br />
12.41 There is no association to represent the medical device industry, hence they<br />
face immense problems and the sector on the whole is neglected.<br />
12.42 Under normal circumstances, the producers of these healthcare products are<br />
expected to follow standards and regulations as per British, Indian or United States<br />
Pharmacopoeia. The varied usage pattern for these products across the medical fraternity<br />
highlights the importance of the standards etc. to be followed:<br />
♦ Orthopedic surgeons: POP bandages, Elastic bandages, Light support and<br />
cushion bandages<br />
♦ Cardiac Surgeons: Pre and post operative dressings, Surgical pad, Tulle<br />
dressings, Elastic bandages<br />
♦ Plastic Surgeons: Skin Grafts, Burns<br />
♦ Gynaecologists<br />
12.43 Inspite of all the problems mentioned above, India offers immense potential as a<br />
manufacturing base for outsourcing the products provided the guidelines set by<br />
European Union and other Asian countries are followed.<br />
12.44 The European companies are finding it difficult to compete in their homeland and<br />
are willing to transfer their technology to India or China. Their willingness to enter<br />
into foreign collaboration offers immense opportunities for the Indian companies, as<br />
coupled with the cheap labour the lower operational cost make India a very attractive<br />
destination.<br />
12.45 The foreign parties prefer dealing with the private parties/ entrepreneurs in<br />
India rather than the Chinese Government. Indian Private Enterprise is preferred over the<br />
Government working in China. The major disadvantage hampering the future potential of<br />
this sector is the poor infrastructure facilities - perennial problems of bad roads, water<br />
scarcity etc.<br />
283
Appendix - 5A (Contd…)<br />
12.46 To take advantage of this, the Government should formulate a policy to<br />
facilitate the transfer of machinery, technical know-how and take steps to ensure the<br />
formulation of a simple Exit Policy.<br />
12.47 For the market to grow and prosper, healthy competition among various players<br />
is necessary.<br />
12.48 The current trend witnessed in the industry is to use PE / Viscose instead of<br />
cotton, both of which are available in abundance in India. 10% of the dressings in India<br />
are non-wovens while this ratio all over the world is 50-60%. Even in the future, there is<br />
expected to be a 50:50 share of the market between both the wovens and the nonwovens.<br />
SECTI<strong>ON</strong> II : INTEGRATED SURGICAL DRESSING COMPLEX<br />
Surgical Dressings Complex:<br />
12.49 It is proposed to set up a state-of-the-art integrated surgical dressings complex<br />
starting from manufacture of woven fabric using narrow and broad width loom with<br />
processing and finishing facilities comprising washing, dyeing, bleaching, tensionless<br />
drying, metering, batching, folding, etc. to inclusion of commodity and value added<br />
products as shown below:<br />
Sr. No. Particulars<br />
Installed<br />
Capacity<br />
Value (Crores)<br />
1 Elastic Adhesive Bandage 24 Lacs Rolls Rs. 15.00<br />
2 Adhesive Tapes 30 Lacs Sq. Mt Rs. 20.00<br />
3 Gauze Products 60 Lacs Sq. Mt Rs. 15.00<br />
4 Surgical Pads 5 Million Pcs. Rs. 3.00<br />
5 Casting & Bandaging 10 Million<br />
Pcs.<br />
Rs. 8.00<br />
6 Tulle Dressings Rs. 12.00<br />
7 Island Dressings Rs. 10.00<br />
8 Hypoallergenic Paper Tapes Rs. 5.00<br />
9 Crepe Bandages Rs. 10.00<br />
10 Drapes & Disposables Rs. 10.00<br />
11 Other Misc. Dressings Rs. 12.00<br />
Total Rs. 120.00<br />
* product mix as recommended by one of the recognized producer and<br />
exporter of surgical dressings<br />
284
Recommended Technology and Plant & Machinery:<br />
Appendix - 5A (Contd…)<br />
12.50 The machinery required for the project can be made to order or sourced locally<br />
except for certain critical equipments such as Gauze Swab Folding Machine, Island<br />
Dressing Equipment, etc.<br />
12.51 The section wise break up of equipment and machinery is given below<br />
Sr. No. Equipments Price (Rs Lakhs)<br />
A. ADHESIVE SECTI<strong>ON</strong> :<br />
1. Sigma Mixer (2 Nos.) 15.00<br />
2. Rubber Mill 12.00<br />
3. Cooling Tower 1.50<br />
4. Day Tank for Storage of Solvents 1.00<br />
5. Underground Tank for Solvent Storage 5.00<br />
6. Adhesive Coating Machine for Cloth Tape 20.00<br />
7. Adhesive Coating Machine for Crepe Cloth 12.00<br />
8. Slitting Machine 9.00<br />
9. Spooling Machines 2.50<br />
Total - A 78.00<br />
B. GAUZE SECTI<strong>ON</strong> :<br />
10. Gauze Rolling Machine 9.00<br />
11. Gaize Cittomg
Appendix - 5A (Contd…)<br />
Sr. No. Equipments Price (Rs Lakhs)<br />
E. TULLE GRAS SECTI<strong>ON</strong> :<br />
24. Coating Line Under Laminar 12.00<br />
25. Dosing Line Under Laminar 12.00<br />
26. Pouching Machine Under Laminar 16.00<br />
27. Dry Heat Sterilizer 3.50<br />
28. U. V. Hatches 4.00<br />
29. Air Handling with Modules 25.00<br />
30. Preparation Area & Equipment 15.00<br />
Total - E 87.50<br />
F. ISLAND DRESSING SECTI<strong>ON</strong> :<br />
31. Assembling Line (Small & Large) 70.00<br />
32. Medication Impregnation Tanks 3.00<br />
33. Tooling & Dies 6.00<br />
34. Air Handling 12.00<br />
Total - F 91.00<br />
G. HYPO ALLERGENIC DRESSING SECTI<strong>ON</strong> :<br />
35. Mixers 15.00<br />
36. Transfer Coating Line 45.00<br />
37. Slitting Machine 15.00<br />
38. Packing Line 5.00<br />
Total - G 80.00<br />
H. DRAPES SECTI<strong>ON</strong> :<br />
39. Assembly Line (Cutting & Fusing) 40.00<br />
40. Packing Line 3.00<br />
41. Testing & Checking 0.50<br />
42. Tools & Jigs 1.50<br />
Total - H 45.00<br />
286
Appendix - 5A (Contd…)<br />
Sr. No. Equipments Price (Rs Lakhs)<br />
I. HYPO ALLERGENIC DRESSING SECTI<strong>ON</strong> :<br />
43. Narrow Width Looms (20) 80.00<br />
44. Broad Width Looms + Leno Heals 120.00<br />
45. Steaming Autoclave 2.00<br />
46. Warping 4.00<br />
47. Washing & Dyeing 5.00<br />
48. Tensionless Drying 5.00<br />
49. Fluorescence Free Bleaching Keir 6.00<br />
50. Stenter 30.00<br />
51. Metering, Batching & Folding 3.00<br />
Total - I 255.00<br />
Grand Total : (A + B + C + D + E + F + G + H + I ) 755.00<br />
LIST <strong>OF</strong> PLANT AND MACHINERY (Contd..)<br />
Sr. No. Equipments Price (Rs Lakhs)<br />
J. UTILITIES SECTI<strong>ON</strong> :<br />
1. Steam Boiler - 2 Nos. 9.00<br />
2. Thermic Heating 3.00<br />
3. Air Compressor - 4 Nos. 6.00<br />
4. Solvent Recovery Plant 35.00<br />
Total - J 53.00<br />
K. QUALITY C<strong>ON</strong>TROL DEPARTMENT :<br />
1. Incubator B.O.D. = 2 Nos. 1.50<br />
2. Muffle Furnace 1.10<br />
3. Vaccum Oven = 2 Nos. 1.00<br />
4. Single Pan Electronic Balance = 2 Nos. 0.80<br />
5. Other Misc. Laboratory Apparatus 1.50<br />
6. U. V. Spectrophotometer 1.50<br />
7. HPLC 8.00<br />
8. Fluorescence Test Equipment 0.10<br />
287
Appendix - 5A (Contd…)<br />
Sr. No. Equipments Price (Rs Lakhs)<br />
9. Yarn & Fabric Testing Apparatus 2.00<br />
10. Tensile Testing 1.50<br />
11. Laboratory Oven 2 0.90<br />
12. Adhesion Bonding Test Apparatus 3.00<br />
13. Brookshield Viscometer 1.50<br />
14. Cast Strength Testing Machine 1.30<br />
15. Laminar Flow 1.50<br />
16. Refrigerator 0.25<br />
17. P. H. Meter 0.15<br />
18. Colony Counter 0.15<br />
19. Modules for Micro-Sterility 4.00<br />
20. Water Still (Amnesty) 0.25<br />
21. Flask Shaker 0.10<br />
22. Vellometer 0.10<br />
23. Air Sampler 0.30<br />
24. Other Misc. Equipment 2.50<br />
Total - K 35.00<br />
L. ELECTRICAL INSTALLATI<strong>ON</strong>S :<br />
1. Electrical Installations 15.00<br />
2. Electrical Panels, etc. 10.00<br />
Total - L 25.00<br />
M. EFFLUENT TREATMENT SYSTEMS :<br />
1. ETP System with Tanks 15.00<br />
Total - M 15.00<br />
N. O<strong>THE</strong>R ASSETS :<br />
1. Furniture 5.00<br />
2. Air Conditioners 5.00<br />
3. Air Handling System 25.00<br />
4. Misc. Maint. Etc. 5.00<br />
Total - N 40.00<br />
288
Appendix - 5A (Contd…)<br />
SECTI<strong>ON</strong> III : PROJECT COST & PR<strong>OF</strong>ITABILITY PROJECTI<strong>ON</strong>S<br />
Land<br />
12.52 The total requirement of land for this project keeping in mind the possible future<br />
expansion is around 20000 Sq. Mtrs. ( 5 acres ).<br />
12.53 Based on the available information the cost of land is assumed at Rs 1200 per<br />
square meter ( including the developmental cost ).Depending on the exact location of the<br />
project to be determined by the promoter the land cost could be higher or lower. Hence<br />
the total cost of developed land will be Rs 2.4 crores.<br />
Buildings<br />
12.54 The building area comprising of main factory building, godowns, office , R & D<br />
labs / In-house Testing centre etc would be 10000 sq. mtrs. The cost of construction<br />
would again vary depending on the structure and the materials to be used. It has been<br />
assumed that the average cost of construction would be Rs 4500 per sq mtr. Thus the<br />
total cost of building and other civil works would be around Rs 4.5 crores.<br />
Plant and Machinery<br />
12.55 Details of Plant and machinery as well as technology required for the project have<br />
been presented in earlier Section II . The installed cost of plant and machinery would be<br />
Rs 7.55 crores. Apart from the main process equipments the utilities required are<br />
Electricals, Piping, Power , Water supply, compressors ,fire fighting equipments and<br />
effluent treatment plant etc. The provision on this count is taken as 0.68 crores.<br />
Miscellaneous Fixed Assets<br />
12.56 Under this head the items included are Furniture and fixtures, Office equipments,<br />
Air Conditioners etc and the provision made is around Rs 0.40 crores.<br />
R & D And Testing Equipment<br />
12.57 The Testing and R& D facilities as elaborated in the section II would call for an<br />
investment of around Rs 0.35 crore.<br />
289
Project Engineering and Consulting<br />
Appendix - 5A (Contd…)<br />
12.58 Under this head the items included are the fees and expenses on account of<br />
Architect fees, project engineering and management (both local and overseas ),etc. and the<br />
provision made is of 0.36 Crore.<br />
Preliminary & Preoperative Expenses<br />
12.59 The items included under this head are company formation expenses, public issue<br />
expenses (if any ), interest during construction, pre-production expenses, during the<br />
implementation phase etc and the provision made is Rs. 1.82 crores.<br />
Contingency Expenses<br />
12.60 Depending on the gestation period and further detailing of the project cost by the<br />
promoter, the contingency provision has been made Rs. 1.81 Crores.<br />
Margin Money for Working capital<br />
12.61 The margin money for working capital forming part of the total project cost would<br />
be Rs 2.16 crores .<br />
Total Project Cost<br />
12.62 The total project cost as given in Exhibit 3.1 would be Rs 22.02 crores (say Rs.<br />
22 crores)<br />
Project Funding And Financing Pattern<br />
12.63 It has been assumed that the project would be financed through long term funds<br />
and Equity participation by the Promoter / Public. The technical textile sector being a<br />
high priority area, it is assumed that a Debt- Equity ratio of 1.5 : 1 would be feasible.<br />
Sales and Profitability Analysis<br />
Sales Realisation and Turnover<br />
12.64 Based on the market considerations and other parameters the product mix<br />
recommended and the sales realization for the surgical complex is as shown below.<br />
(Installed capacity)<br />
290
Sr. No. Particulars<br />
Installed<br />
Capacity<br />
Appendix - 5A (Contd…)<br />
Value<br />
(Crores)<br />
Average Per unit<br />
price (net of taxes<br />
)(Rs)<br />
1 Elastic Adhesive Bandage 24 Lacs Rolls Rs. 15.00 62.5 per roll<br />
2 Adhesive Tapes 30 Lacs Sq. Mt Rs. 20.00 66.66 per sq. mt.<br />
3 Gauze Products 60 Lacs Sq. Mt Rs. 15.00 25 per sq. mt<br />
4 Surgical Pads 5 Million Pcs. Rs. 3.00 6 per pc.<br />
5 Casting & Bandaging 10 Million Pcs. Rs. 8.00 8 per pc.<br />
6 Tulle Dressings Rs. 12.00 Aggregate in and<br />
7 Island Dressings Rs. 10.00 turnover is shown<br />
8 Hypoallergenic Paper Tapes Rs. 5.00 view of the<br />
9 Crepe Bandages Rs. 10.00 diversity of<br />
10 Drapes & Disposables Rs. 10.00 products, types<br />
11 Other Misc. Dressings Rs. 12.00 usages.<br />
Total Rs. 120.00<br />
* product mix as recommended by one of the recognized producer and exporter of<br />
surgical dressings<br />
12.65 Under the Indian conditions, it is assumed that the surgical dressing plant would<br />
operate at an efficiency level of 75 %. Hence the production from the plant would be Rs.<br />
90 crores.<br />
12.66 The plant would operate on Two or Three -shift basis depending on the process<br />
requirements and 330 working days in a year.<br />
12.67 The capacity utilisation for the 1st year is assumed at 50% and thereafter for the<br />
2nd ,3rd and 4th year onwards 60%, 75% and 90% respectively.<br />
12.68 The details of sales turnover projected are given in Exhibit 3.2.<br />
Cost of Production<br />
Major Raw materials<br />
12.69 As an integrated complex it is proposed to have captive weaving and processing<br />
facilities of woven, narrow and broad width fabric using cotton viscose as the main raw<br />
material for outsourced Yarns.<br />
12.70 Cotton yarns used are normally in the count range 25, 30 ,32 and 40. Besides<br />
spunlace Non-woven fabric will be outsourced along with the chemicals dyes adhesives<br />
291
Appendix - 5A (Contd…)<br />
and packaging materials. At full capacity the requirement of raw materials as shown<br />
below:<br />
Raw Materials Cost in Rs. Crores<br />
Yarn, Fabrics & Cloth 52.00<br />
Chemicals (Dyes, pigments, adhesives, Bleaching<br />
agents, etc)<br />
7.00<br />
Primary and secondary Packing Materials 16.00<br />
Total (at installed capacity) 75.00<br />
12.71 Thus the basic cost of conversion from raw material stage of yarn, fabric and cloth<br />
to finished products at full capacity will be Rs. 23 crores. (Basic raw materials (Rs. 52<br />
crores) + conversion cost (Rs. 23 crores)<br />
Manpower ,Salaries and Wages<br />
12.72 The manpower requirements and the salary structure is given as follows.<br />
Technical :<br />
• G. M.<br />
• Chemists<br />
• Maintenance<br />
Type of Manpower Number Annual Wage Bill<br />
3<br />
8<br />
6<br />
Rs. 60.00 Lacs<br />
Administrative & accounts 10 Rs. 20.00 Lacs<br />
Sales / Marketing 100 Rs. 200.00 Lacs<br />
Skilled Labour 75 Rs. 60.00 Lacs<br />
Unskilled Labour 200 Rs. 72.00 Lacs<br />
TOTAL 405 Rs. 412.00 Lacs<br />
Factory and Overhead Expenses<br />
12.73 The items covered under this head are repairs and maintenance, establishment<br />
expenses, travel expenses, packaging expenses, etc. The provision made for this is Rs.<br />
1.35 crores<br />
Marketing and Promotional Expenses<br />
12.74 The promotion of surgical dressings will call for expenditure on this account and a<br />
provision of 10% of sales has been made uniformly over the first five years as the small<br />
industries have to give certain promotional discounts and schemes. Then the marketing<br />
and promotional expenses can be lowered to 5 % uniformly over the next years.<br />
292
Interest and Depreciation<br />
Appendix - 5A (Contd…)<br />
12.75 The prevailing interest rate for long term and short term borrowed funds is<br />
assumed at 5 % per annum and 11 % per annum respectively.<br />
12.76 The repayment of loans has been assumed for 8 years with two year moratorium.<br />
12.77 The depreciation rates as per the Company Law and Income-Tax Ready Reckoner<br />
have been worked out for Straight Line and WDV Method basis.<br />
12.78 The current corporate tax rate is assumed at 35 % and the surcharge is assumed at<br />
2.5% per annum.<br />
Profitability, Break-even, IRR and Payback .<br />
12.79 The Sales turnover increases from Rs 44.10 Cr in the first year to Rs 79.38 Cr.<br />
from the 4 th year onwards.<br />
12.80 The PBT increases from Rs 2.55 Cr. in the first year to Rs. 9.85 Cr. In the 4 th<br />
year. and Rs. 11.81 crores in the 10 th year (See Exhibit 3.4)<br />
12.81 The Break Even of the project is at 61.33%.<br />
12.82 The Internal Rate of Return ( IRR ) has been worked out at 27.54 %.<br />
12.83 The Payback period for the project is 4.05 years .<br />
DEVELOPMENTAL AND PROMOTI<strong>ON</strong>AL MEASURES.<br />
12.84 In the Indian context, the industry is concentrated in the cottage and the<br />
decentralized sector using:<br />
♦ Local obsolete technology,<br />
♦ No testing facilities,<br />
♦ Absence of Research & Development facility.<br />
12.85 There is no standard common testing facility available at the All India level,<br />
while these products need to be checked for bioburden, biocompatibility, and cytotoxicity,<br />
nor any clinical trials being undertaken for new products that are being imported.<br />
12.86 This industry is facing problems like unhealthy competition and threat from the<br />
decentralised sector flooding the market with low quality and substandard products.<br />
293
Appendix - 5A (Contd…)<br />
12.87 The taxes are paid only by the organised sector whereas tax evasion being<br />
rampant in the unorganized sector. The decentralized sector is known to operate on the<br />
power looms, and at the same time claiming to be operating on handlooms to avail of the<br />
tax benefits.<br />
12.88 The main competitor for India in the Meditech segment is China. The Chinese<br />
products are 25 - 40 % cheaper due to low raw material costs, better infrastructure, large<br />
production capacities in conjunction with better technology making it economically<br />
feasible for them to sell their products at a very low price. The Chinese units are lax in<br />
following any standards. For example, the Chinese Adhesive Tapes don’t confirm to any<br />
pharmacopoeial standards while the Indian Adhesive Tapes are manufactured according<br />
to the USP standards making it mandatory to perform all the tests, thus increasing the<br />
costs. The Chinese also score over India in the resources available like the labour and<br />
infrastructure.<br />
12.89 There is no association to represent the medical device industry, hence they<br />
face immense problems and the sector on the whole is neglected.<br />
12.90 Under normal circumstances, the producers of these healthcare products are<br />
expected to follow standards and regulations as per British, Indian or United States<br />
Pharmacopoeia. The varied usage pattern for these products across the medical fraternity<br />
highlights the importance of the standards etc. to be followed:<br />
• Orthopedic surgeons: POP bandages, Elastic bandages, Light support and<br />
cushion bandages<br />
• Cardiac Surgeons: Pre and post operative dressings, Surgical pad, Tulle<br />
dressings, Elastic bandages<br />
• Plastic Surgeons: Skin Grafts, Burns<br />
• Gynaecologists<br />
12.91 Inspite of all the problems mentioned above, India offers immense potential as a<br />
manufacturing base for outsourcing the products provided the guidelines set by<br />
European Union and other Asian countries are followed.<br />
12.92 The European companies are finding it difficult to compete in their homeland and<br />
are willing to transfer their technology to India or China. Their willingness to enter<br />
into foreign collaboration offers immense opportunities for the Indian companies, as<br />
294
Appendix - 5A (Contd…)<br />
coupled with the cheap labour the lower operational cost make India a very attractive<br />
destination.<br />
12.93 The foreign parties prefer dealing with the private parties / entrepreneurs in<br />
India rather than the Chinese Government. Indian Private Enterprise is preferred over the<br />
Government working in China. The major disadvantage hampering the future potential of<br />
this sector is the poor infrastructure facilities - perennial problems of bad roads, water<br />
scarcity etc.<br />
12.94 To take advantage of this, the Government should formulate a policy to<br />
facilitate the transfer of machinery, technical know-how and take steps to ensure the<br />
formulation of a simple Exit Policy.<br />
12.95 For the market to grow and prosper, healthy competition among various players<br />
is necessary.<br />
12.96 The current trend witnessed in the industry is to use PE / Viscose instead of<br />
cotton, both of which are available in abundance in India. 10% of the dressings in India<br />
are non-wovens while this ratio all over the world is 50-60%. Even in the future, there is<br />
expected to be a 50:50 share of the market between both the wovens and the nonwovens.<br />
12.97 In the above back ground, the proposal to set up an integrated surgical complex is<br />
the step in the right direction for the future development of this sector which takes into<br />
account multiplicity of products - both commodity and value added.<br />
295
EXHIBIT 12.1<br />
PROJECT COST<br />
(LAND, BUILDINGS, PROCESS PLANT & MACHINERY, UTILITIES & O<strong>THE</strong>R ASSETS)<br />
Project Cost (Rs. Cr.)<br />
1 Land 2.40<br />
(Area: 20000 Sq. Mtrs.)<br />
Rate: (Rs.1200 /Sq. Mtr)<br />
2 Buildings 4.50<br />
(Plant Area, Office, Godown, Lab, Service Area etc.)<br />
Built-up Area : 10000 Sq. Mtrs<br />
Avg Rate : Rs.4500 /Sq. Mtrs<br />
3 Process Plant & Equipment 7.55<br />
4 Utility & Other equipments 0.68<br />
(Compressor, Stem Boiler, Effluent Treatment Plant, etc.)<br />
5 Testing Equipments 0.35<br />
5 Misc. Fixed Assets 0.40<br />
(Furniture & Fixtures, Office Equipment, etc.)<br />
6 Project Engineering & Consultancy charges (2.5%) 0.36<br />
7 Preliminary & Pre-operative Expenses (12%) 1.82<br />
(Company Formation, Interest during construction,<br />
pre-production expenses, etc.)<br />
8 Contingency (10 %) 1.81<br />
9 Total 19.86<br />
10 Margin Money for Working Capital 2.16<br />
11 Total Project Cost 22.02<br />
297
EXHIBIT 12.2<br />
ESTIMATI<strong>ON</strong> <strong>OF</strong> SALES REVENUE<br />
ITEM YEAR <strong>OF</strong> OPERATI<strong>ON</strong><br />
I II III IV V VI VII VIII IX X<br />
Average Production per hr (mt.) 120 120 120 120 120 120 120 120 120 120<br />
75% efficiency 90 90 90 90 90 90 90 90 90 90<br />
Capacity Utilisation 50% 60% 75% 90% 90% 90% 90% 90% 90% 90%<br />
Actual Production per hr (mt.) 45 54 68 81 81 81 81 81 81 81<br />
Sales Revenue (Rs. Cr) 45.00 54.00 67.50 81.00 81.00 81.00 81.00 81.00 81.00 81.00<br />
Value Loss ( 2% ) 0.90 1.08 1.35 1.62 1.62 1.62 1.62 1.62 1.62 1.62<br />
Net Sales Revenue (Rs. Cr) 44.10 52.92 66.15 79.38 79.38 79.38 79.38 79.38 79.38 79.38<br />
298<br />
(Rs. Cr.)
Factory Related<br />
EXHIBIT 12.3<br />
REQUIREMENT <strong>OF</strong> WORKING CAPITAL<br />
ITEM NO. <strong>OF</strong> MARGIN YEAR I YEAR II YEAR III YEAR IV<br />
(Rs.Lakhs)<br />
YEAR V<br />
M<strong>ON</strong>THS (%) W.CAP MARGIN BANK W.CAP MARGIN BANK W.CAP MARGIN BANK W.CAP MARGIN BANK W.CAP MARGIN BANK<br />
REQMT M<strong>ON</strong>EY FINANCEREQMT M<strong>ON</strong>EY FINANCE REQMT M<strong>ON</strong>EY FINANCEREQMT M<strong>ON</strong>EY FINANCE REQMT M<strong>ON</strong>EY FINANCE<br />
Raw materials & other commodities1.00 25.00 1.71 0.43 1.28 2.05 0.51 1.54 2.56 0.64 1.92 3.07 0.77 2.30 3.07 0.77 2.30<br />
Finished Goods 1.00 25.00 3.26 0.82 2.45 3.84 0.96 2.88 4.69 1.17 3.52 5.55 1.39 4.16 5.57 1.39 4.18<br />
A/c Receivable 1.00 25.00 3.68 0.92 2.76 4.41 1.10 3.31 5.51 1.38 4.13 6.62 1.65 4.96 6.62 1.65 4.96<br />
Cash in hand<br />
Salaries & wages 1.00 0.00 0.34 0.00 0.34 0.36 0.00 0.36 0.38 0.00 0.38 0.40 0.00 0.40 0.42 0.00 0.42<br />
Utilities 1.00 0.00 0.72 0.00 0.72 0.86 0.00 0.86 1.08 0.00 1.08 1.29 0.00 1.29 1.29 0.00 1.29<br />
Advertising & Promotional Expenses 1.00 0.00 0.37 0.00 0.37 0.44 0.00 0.44 0.55 0.00 0.55 0.66 0.00 0.66 0.66 0.00 0.66<br />
Admin. Overheads 1.00 0.00 0.11 0.00 0.11 0.11 0.00 0.11 0.11 0.00 0.11 0.11 0.00 0.11 0.11 0.00 0.11<br />
Total Requirement 10.08 2.16 7.92 11.97 2.57 9.40 14.78 3.19 11.59 17.60 3.81 13.79 17.64 3.81 13.83<br />
299
Factory Related<br />
EXHIBIT 12.3 (C<strong>ON</strong>TD...)<br />
REQUIREMENT <strong>OF</strong> WORKING CAPITAL<br />
ITEM NO. <strong>OF</strong> MARGIN YEAR VI YEAR VII YEAR VIII YEAR IX<br />
(Rs.Lakhs)<br />
YEAR X<br />
M<strong>ON</strong>THS (%) W.CAP MARGIN BANK W.CAP MARGIN BANK W.CAP MARGIN BANK W.CAP MARGIN BANK W.CAP MARGIN BANK<br />
REQMT M<strong>ON</strong>EY FINANCEREQMT M<strong>ON</strong>EY FINANCEREQMT M<strong>ON</strong>EY FINANCEREQMT M<strong>ON</strong>EY FINANCEREQMT M<strong>ON</strong>EY FINANCE<br />
Raw materials & other commodities 1.00 25.00 3.07 0.77 2.30 3.07 0.77 2.30 3.07 0.77 2.30 3.07 0.77 2.30 3.07 0.77 2.30<br />
Finished Goods Stock 1.00 25.00 5.27 1.32 3.95 5.31 1.33 3.98 5.35 1.34 4.01 5.39 1.35 4.04 5.43 1.36 4.08<br />
A/c Receivable 1.00 25.00 6.62 1.65 4.96 6.62 1.65 4.96 6.62 1.65 4.96 6.62 1.65 4.96 6.62 1.65 4.96<br />
Cash in hand<br />
Salaries & wages 1.00 0.00 0.45 0.00 0.45 0.49 0.00 0.49 0.53 0.00 0.53 0.57 0.00 0.57 0.61 0.00 0.61<br />
Utilities 1.00 0.00 0.00 0.00 0.00 0.00 0.00 0.00 0.00 0.00 0.00 0.00 0.00 0.00 0.00 0.00 0.00<br />
Advertising & Promotional Expenses 1.00 0.00 0.01 0.00 0.01 0.01 0.00 0.01 0.01 0.00 0.01 0.01 0.00 0.01 0.01 0.00 0.01<br />
Admin. Overheads 1.00 0.00 0.33 0.00 0.33 0.33 0.00 0.33 0.33 0.00 0.33 0.33 0.00 0.33 0.33 0.00 0.33<br />
Total Requirement 17.05 3.74 13.31 17.12 3.75 13.37 17.20 3.76 13.44 17.28 3.77 13.51 17.37 3.78 13.59<br />
300
EXHIBIT 12.4<br />
MANPOWER REQUIREMENTS<br />
Nos AnnualTotal Monthly Salary Annual<br />
General Manager 3 30000 90000 1080000<br />
Chemists 8 15000 120000 1440000<br />
Maintenance 6 10000 60000 720000<br />
Admini 0 10000 0 0<br />
Marketing & Sales Staff 2 12000 24000 288000<br />
Clerical Staff 2 6000 12000 144000<br />
Other Staff 2 3000 6000 72000<br />
Maintenance (Elec. & Mech.) 1 10000 10000 120000<br />
TOTAL 24 322000 3864000<br />
Fringe Benefits (40 % of the above) 1545600<br />
Total Wage Bill (Annual) Rs. Salary lakhs: + Other Benefits = 41200000.00<br />
Total Wage Bill (Annual) Rs. Cr.: 4.12<br />
301
EXHIBIT 12.5<br />
PR<strong>OF</strong>ITABILITY STATEMENT AND COMPUTATI<strong>ON</strong> <strong>OF</strong> TAX<br />
(Rs.Cr)<br />
ACCOUNT HEAD FINANCIAL YEAR <strong>OF</strong> OPERATI<strong>ON</strong><br />
I II III IV V VI VII VIII IX X<br />
Revenue<br />
Net Sales Turnover 44.10 52.92 66.15 79.38 79.38 79.38 79.38 79.38 79.38 79.38<br />
Total Revenue 44.10 52.92 66.15 79.38 79.38 79.38 79.38 79.38 79.38 79.38<br />
Expenses<br />
Raw Materials 20.48 24.57 30.71 36.86 36.86 36.86 36.86 36.86 36.86 36.86<br />
Salaries & wages 4.12 4.33 4.54 4.77 5.01 5.41 5.84 6.31 6.81 7.36<br />
Conversion Cost 8.63 10.35 12.94 15.53 15.53 15.53 15.53 15.53 15.53 15.53<br />
Repairs & Maintenance 0.15 0.15 0.15 0.15 0.15 0.15 0.15 0.15 0.15 0.15<br />
Marketing & Promotional Expenses 4.41 5.29 6.62 7.94 7.94 3.97 3.97 3.97 3.97 3.97<br />
Factory & Office Overheads 1.35 1.35 1.35 1.35 1.35 1.35 1.35 1.35 1.35 1.35<br />
Interest on S.T. Loans 0.87 1.03 1.28 1.52 1.52 1.46 1.47 1.48 1.49 1.49<br />
Cost of Sales 40.00 47.07 57.58 68.11 68.35 64.72 65.16 65.64 66.15 66.70<br />
Depreciation (St.Line) 0.82 0.82 0.82 0.82 0.82 0.82 0.82 0.82 0.82 0.82<br />
Amort. of Expenses 0.06 0.06 0.06 0.06 0.06 0.06 0.00 0.00 0.00 0.00<br />
Interest on L.T Loan 0.66 0.66 0.62 0.54 0.45 0.37 0.29 0.21 0.12 0.04<br />
Profit Before Tax 2.55 4.30 7.06 9.85 9.70 13.40 13.11 12.71 12.28 11.81<br />
Tax 0.27 0.90 2.05 3.18 3.24 4.62 4.59 4.51 4.40 4.27<br />
Profit After Tax 2.29 3.41 5.01 6.68 6.46 8.78 8.52 8.21 7.89 7.55<br />
Dividend 0.00 0.00 0.44 0.44 0.44 0.88 0.88 0.88 0.88 0.88<br />
Profits For Appropriation 2.29 3.41 4.57 6.23 6.02 7.90 7.64 7.33 7.01 6.67<br />
COMPUTATI<strong>ON</strong> <strong>OF</strong> TAX<br />
Profit after interest before depreciation 3.38 5.13 7.89 10.68 10.52 14.23 13.93 13.54 13.11 12.64<br />
Depr.(WDV) to be claimed 3.28 2.57 2.02 1.60 1.27 1.02 0.83 0.67 0.55 0.46<br />
Depreciation claimed 3.28 2.57 2.02 1.60 1.27 1.02 0.83 0.67 0.55 0.46<br />
Depr. carried forward 0.00 0.00 0.00 0.00 0.00 0.00 0.00 0.00 0.00 0.00<br />
Taxable Profit 0.09 2.56 5.87 9.08 9.24 13.20 13.10 12.86 12.55 12.18<br />
Profit Before Tax (Book) 2.55 4.30 7.06 9.85 9.70 13.40 13.11 12.71 12.28 11.81<br />
Minimum Alternate Tax 0.27 0.00 0.00 0.00 0.00 0.00 0.00 0.00 0.00 0.00<br />
Tax (Actual) 0.03 0.90 2.05 3.18 3.24 4.62 4.59 4.51 4.40 4.27<br />
Tax Provision 0.27 0.90 2.05 3.18 3.24 4.62 4.59 4.51 4.40 4.27<br />
302
EXHIBIT 12.6<br />
SENSITIVITY ANALYSIS<br />
Items Profit after Tax<br />
(PAT)<br />
Rs. Cr.<br />
( assumed at 90 %<br />
capacity )<br />
Break<br />
Even<br />
(%)<br />
Appendix - 5A (Contd…)<br />
Internal<br />
Rate of<br />
Return<br />
(IRR)<br />
(%)<br />
Payback<br />
Period<br />
(Years)<br />
NORMAL VALUES 6.68 61.33 27.54 4.00<br />
Debt Equity Ratios<br />
(a) 2:1<br />
(b) 1:1<br />
Increase in Project Cost<br />
by a)<br />
10 %<br />
b) 20%<br />
6.64<br />
6.73<br />
6.60<br />
6.53<br />
61.56<br />
60.98<br />
61.92<br />
62.52<br />
27.60<br />
27.44<br />
25.69<br />
24.10<br />
4.00<br />
4.00<br />
4.01<br />
4.02<br />
303
PRODUCTI<strong>ON</strong> <strong>OF</strong> GREY TAFFETA FABRICS<br />
Appendix-5B<br />
SECTI<strong>ON</strong> I: PRODUCT BRIEF, APPLICATI<strong>ON</strong> AREAS & MARKET<br />
POTENTIAL<br />
12.1 A lustrous medium weight plain weave fabric with a slight ribbed<br />
appearance in the weftwise ( cross-wise). It provides crisp hand, with lots of body.<br />
Earlier silk yarns was extensively used; however, today it is replaced by nylon and<br />
polyester filament yarns with rare exception of viscose and acetate.<br />
12.2 Prerequisites of Taffeta fabrics are:<br />
• Medium weight<br />
• High abrasion resistance<br />
• High tear resistance<br />
• Flexibility in use, etc.<br />
12.3 For these properties mainly Nylon Filament Yarn (NFY) and Polyester<br />
Filament Yarn (PFY) (70 dtex) normally used. Global constructions are 190 T,<br />
210 T and 230 T where T indicates the thread densities.<br />
Usage and Application Areas:<br />
12.4 Taffeta fabrics are used for<br />
• Lining<br />
• Umbrella cloth<br />
• Wind cheater<br />
• Kites<br />
• Courier bags<br />
• Variety of domestic bags<br />
• Artificial flowers<br />
• Sleeping bags<br />
• Tents<br />
• Substrate for Coating materials<br />
• Range of other applications
Umbrellas and Wind Cheaters<br />
Appendix-5B (Contd..)<br />
12.5 Umbrellas and wind cheaters are mainly used during the rainy season.<br />
Umbrellas are also used as protection from the sun but this usage is mainly in<br />
South India as this region being closer to the Equator is also hotter.<br />
12.6 In earlier times the most commonly used material for umbrella cloth was<br />
cotton. However, over the last two decades usage has shifted to Nylon and<br />
Polyester.<br />
12.7 Manufacture of umbrellas and wind cheaters is basically an activity carried<br />
out in the small scale sector. Some of the famous brands of umbrellas are<br />
“Stag”, “Citizen”, “Sun”, “Avon”, “Captain”, “Elephant”, “Johns” etc.<br />
Umbrellas are available in prices ranging from Rs.60 / pc to Rs.250 / pc.<br />
Market size<br />
12.8 Umbrella and windcheater cloth (Taffeta) is not being produced in the<br />
country but is entirely imported from China, Taiwan, UAE etc. Total quantum<br />
imported, as per import statistics was as follows over the two years.<br />
Year Qty<br />
(Tonnes)<br />
Value<br />
(Rs./Lakhs)<br />
2000-2001 520.60 996.39<br />
2001-2002 293.13 520.13<br />
Total 813.73 1516.52<br />
Average of two years 406.86 758.26<br />
12.9 Major Importers of Umbrella and Windcheater Cloth are (1) Sagar Impex,<br />
Mumbai & Calcutta, (2) Chandanlal & Co. Mumbai, (3) Mr.Arun Kumar & Co.<br />
Mumbai.<br />
12.10 Since about 75 gm of material are required in both umbrellas and<br />
windcheater, 407 tonnes of imported cloth translates into about 5.5 mln. numbers<br />
of final product. In addition there could be about 15 to 20% coming in through<br />
unofficial channels which puts total output of windcheaters and umbrellas at 6.5<br />
mln. nos.<br />
12.11 Some of the major umbrella manufacturers are as follows :<br />
1. Ebrahim Currim & Sons, Mumbai, Calicut, Mangalore.<br />
2. K.C. Pal & Co. Calcutta’<br />
306
Market Potential<br />
3. Mahendra Datto, Calcutta<br />
4. Metro Umbella Industries, Mumbai<br />
5. John’s Umbrellas, Alepey, Kerala<br />
6. Kwality Umbrella Mfg. Co. Mumbai<br />
7. Bhupendra Umbrellas Mfg. Co. Palghar<br />
8. Capital Chathla Udyog, Delhi<br />
9. Lion Brand Umbrella, Madurai<br />
10. Citizen Umbrellas, Mumbai .<br />
Appendix-5B (Contd..)<br />
12.12 Based on discussions with major manufacturers and other knowledgeable<br />
people the estimated market for umbrellas and windcheaters is expected to grow<br />
from 6.50 mln. Nos. In 2001-02 to about 12.50 mln. numbers by 2007-08 of<br />
which the share of umbrellas would be 9.7 mln numbers and of windcheaters 2.7<br />
mln numbers. This translates into a total textile requirement of about 540 tonnes<br />
valued at Rs.10 crores in 2003-04 and 940 tonnes worth Rs.17.5 crores by 2007-<br />
08 (a CARG of 5%/yr).<br />
12.13 Since the entire requirement of umbrella and windcheater cloth is being<br />
imported it would be worth while carrying out a techno-ecomonic feasibility<br />
study to ascertain the prospects of manufacture in India.<br />
12.14 It could be integrated composite unit starting from chips (raw material) to<br />
yarn/fabrics processing and finishing.<br />
Sleeping Bags (Camping)<br />
Product Type and Range<br />
12.15 A sleeping bag may be used in high altitudes with -50 O C temperature or in<br />
warmer places having temperature in the range of 10 O C. Such widely varying uses<br />
make sleeping bag construction a highly technical job. As a result, it requires<br />
substantial knowledge regarding raw material selection, sewing method, and<br />
design.<br />
12.16 Sleeping bags need to be light-weight and should be capable of providing<br />
warmth, comfort and protection from wind and water. According to international<br />
standards, the maximum permissible total weight of a sleeping bag is around 1.5<br />
kg.<br />
12.17 Keeping in view such functional requirements, the following fabrics are<br />
used in sleeping bags:<br />
307
Sr.<br />
No.<br />
Product<br />
Type<br />
1 Sleeping<br />
Bags<br />
Textile Application Performance<br />
Requirements<br />
nylon taffeta<br />
(90-230<br />
GSM)<br />
Polyester<br />
Outer and<br />
inner fabric<br />
Light weight,<br />
wind proof,<br />
water resistant,<br />
durable,<br />
washable<br />
Appendix-5B (Contd..)<br />
Consumption<br />
Norm per unit<br />
7 sq meters of<br />
cloth<br />
12.18 Sleeping bags are constructed with tough yet soft touch nylon taffeta shells<br />
filled either with holofil fiber, down feathers, cotton, or polyfill sheet in mummy<br />
shape. These fabrics range from 90-125 GSM, are extremely light weight, windproof<br />
and have very high tear resistance.<br />
12.19 Water-resistance is a desirable characteristic in the nylon fabric used for<br />
making sleeping bags. But the water-proof fabric must be breathable too. Such<br />
breathable water-proof nylon fabric is not produced in India. It has been<br />
developed and patented by Goretex (USA). These fabrics are expensive and the<br />
water-resistance property usually lasts for three years only.<br />
12.20 Nylon taffeta which is used as outer fabric is also used as inner fabric. In<br />
certain sleeping bags cotton or fleece inner lining is also used. Since light-weight<br />
and durability are desired characteristics, nylon taffeta is used in most of the<br />
sleeping bags. Cotton is considered better than nylon for skin but cotton linings in<br />
sleeping bags are susceptible to fungus.<br />
12.21 Ultra-holofil or polyfil is the most commonly used filling material in<br />
sleeping bags in India because in addition to being light-weight and providing heat<br />
insulation, it is washable and does not form lumps. It is estimated that 80% of the<br />
sleeping bags produced uses synthetic fiber filling and the remaining uses cotton<br />
filling. The quality of polyfil fiber used varies greatly. According to market<br />
sources, low-grade polyfill fibers obtained from the recycling of disposed PET<br />
bottles is also used in sleeping bags.<br />
12.22 The quantity of filling used depends on the purpose of a sleeping bag. The<br />
following table indicates the quantity of ultra-holofil used in different types of<br />
sleeping bags:<br />
Sr. No. Sleeping bag types Quantity of filling<br />
1 High altitude sleeping bags Down feather filling of 1300 gms;<br />
Ultra-hollofil of 1700 gms<br />
2 Low altitude sleeping bags Ultra-hollofil filling of 1200 gms<br />
3 Rectangular - summer travel bags Filling of 500 gms<br />
308
Usage and Application Areas<br />
Appendix-5B (Contd..)<br />
12.23 The major users of sleeping bags in India are military forces and paramilitary<br />
forces. They are estimated to be accounting for nearly 90% consumption<br />
of the total number of sleeping bags produced in India. The other segments<br />
comprise of corporate sectors, school children going for camping and excursions,<br />
mountaineering departments and adventure loving people.<br />
Producers of Sleeping Bags in India<br />
12.24 Stikage is a Delhi based firm specializing in outdoor adventure sports<br />
equipment. The firm follows UIAA world standard in making sleeping bags. It<br />
uses imported nylon taffeta and depending upon the requirement uses either down<br />
feathers or polyfill as filling material. The firm claims to be selling around 500<br />
sleeping bags a year. It carries a range of other equipment required in<br />
mountaineering.<br />
12.25 Canvas Emporium is also a Delhi based firm that produces tents and<br />
sleeping bags. It produces sleeping bags only upon demand. The company buys<br />
nylon taffeta from the importers and converts them into sleeping bags. The unit<br />
tried to process the polyester fabric produced in India for wind-proofing. But the<br />
cost of wind-proof processing amounted to Rs. 60 a meter whereas a processed<br />
wind-proof imported fabric is available for merely Rs. 45 a meter. It uses polyfill<br />
for stuffing in sleeping bags.<br />
Market Size for Sleeping Bags (2001 - 02)<br />
12.26 The sleeping bag industry is concentrated in small sized firms operating in<br />
the unorganized sector. It is a localized industry with production taking place in<br />
smaller quantities in a number of places. The military forces are the major<br />
consumers and they have also set up their own production unit. Azad Market in<br />
Delhi is lined with a number of producers engaged in sleeping bags, tents and<br />
tarpaulins production.<br />
12.27 Sleeping bag production is a highly technical job and requires specialized<br />
machines for shell construction, quilting, down or polyfill filling so that<br />
appropriate quantity of down, or feathers, or polyfill is filled such that there is no<br />
lumping and the user gets a cozy bag cushioned well to ensure a good sleep even<br />
in harsh conditions. However, the producers in India do not use such specialized<br />
machines. Almost all of them are using simple sewing machines and a few of them<br />
are using quilting machines priced between Rs. 3000 to Rs. 30000.<br />
309
Appendix-5B (Contd..)<br />
12.28 The industry is highly localized, fragmented, and consists of firms who are<br />
engaged in producing other items such as tents and tarpaulins and make sleeping<br />
bags only upon demand. In view of all these factors, the current market for the<br />
sleeping bags is estimated to be around Rs. 6.25 Cr.<br />
12.29 The demand for sleeping bags is linked to adventure loving lifestyle<br />
involving active participation in hiking, trekking, income and spending power,<br />
awareness about desired product attributes for specific uses.<br />
12.30 As mentioned earlier, military is the major consumer of sleeping bags in<br />
India. The sleeping bags required by military forces deployed in the northern<br />
frontiers of Siachen and Kargil is absolutely different from the ones required in the<br />
lower foothills. Light-weight and construction to suit varying climatic conditions<br />
are critical aspects of the sleeping bags for military. It was learnt that the variety<br />
required for use in extreme conditions such as Siachen and Kargil is met<br />
exclusively through imports.<br />
12.31 According to the producers, the sleeping bags used by army deployed in<br />
other parts of the country are not suitable to their requirements. They are not lightweight,<br />
and neither are they constructed appropriately.<br />
12.32 Nylon taffeta is the major raw material required and is met entirely<br />
through imports from Korea and China because the quality produced in the mills<br />
located at Surat is extremely poor with respect to tear resistance. Besides Korea<br />
and China, nylon taffeta is also imported from Chinese Taipei, Indonesia, Japan,<br />
Sri Lanka, UAE, and U.K.<br />
Impediments and Major Issues of Concern<br />
12.33 The sleeping bags used by the army deployed in other parts of the country<br />
apart form Siachen and Kargil use lower quality and cheaper bags often with<br />
cotton filling or inappropriate quantity of polyfill filling due to:<br />
� Lack of awareness,<br />
� Cost consciousness<br />
12.34 The percentage of the population participating in adventurous activities is<br />
extremely low and hence the demand for the bags is lower.<br />
12.35 The level of awareness regarding quality and capability of spending<br />
higher amounts in better quality of sleeping bags is also very low.<br />
12.36 Most of the buyers especially parents of the children going for camping as a<br />
part of school excursions look at sleeping bag purchases as one-time purchase and<br />
base their decision on price than on the quality required.<br />
310
Appendix-5B (Contd..)<br />
12.37 The Indian producers have to depend fully on imports of nylon taffeta from<br />
China and Korea. Since the quantity of nylon taffeta required by the industry is<br />
lower than the minimum quantum supplied by an exporter, the Indian importers<br />
meet the demand by importing stock lots from these countries.<br />
12.38 It is never possible to assure supply, quality and price consistency for goods<br />
purchased in stock lots. Rather, Chinese producers are in a more advantageous<br />
position and are cost efficient producer and exporter of sleeping bags.<br />
Future Market Potential for Sleeping Bags<br />
12.39 Television channels such as BBC, Discovery, and National Geographic<br />
have definitely propagated adventurous pastimes and created demand for related<br />
products. The market for sleeping bags according to producers has expanded by<br />
approximately 30-40% but the market size is still extremely small.<br />
12.40 It was learnt that sleeping bags are used as lighter and convenient<br />
alternative to the conventional bulky beddings carried during travel especially by<br />
train. In metropolitan cities, sleeping bags are often used in houses as temporary<br />
arrangements for guests in lieu of beds and mattresses. The users in this category<br />
look for cheaper products and are not at all concerned with quality.<br />
12.41 The market for sleeping bags is still at its infancy and the production is in<br />
response to the demand and exports also of the same order and same quantity sold<br />
in the civil market, the current and anticipated market scenario is as follows :<br />
Market Potential<br />
Year Quantity (Nos.) Value (Rs. Cr.)<br />
2001 - 2002 25,000 6.25<br />
2003 - 2004 30,000 7.50<br />
2007 - 2008 50,000 12.50<br />
12.42 The military and para-military forces are the major consumers but the<br />
demand varies significantly from one year to another. Incidents such as impending<br />
war on the northern frontiers or exhaustion of sleeping bags stock induce<br />
demand.<br />
12.43 Furthermore, the army procures its requirement from its own production<br />
facility as well as the market. Consequently, it is extremely difficult to estimate the<br />
annual consumption by military alone. Some of the producers contacted have cited<br />
that average annual requirement of the Defence Department can be estimated to be<br />
approximately 8,000 units of sleeping bags.<br />
12.44 In order to be able to cater to the exports market, ready availability of<br />
raw material and quality assurance with respect to fabric type, color shades,<br />
are the prerequisites.<br />
311
Appendix-5B (Contd..)<br />
SECTI<strong>ON</strong> II : TAFFETA TECHNOLOGY AND EQUIPMENTS SUPPLIERS<br />
12.45 Taffeta fabrics are manufactures on conventional shuttle looms as well as<br />
unconventional shuttleless looms. Shuttleless looms specially waterjet lloms are<br />
preferable because of :<br />
• Higher productivity<br />
• Lower value loss<br />
• Low power cost per unit fabric<br />
• Less noise level<br />
12.46 The raw material used are sized beams of nylon or polyester for warp and<br />
unsized yarns in the weft. No warping is required to process the warp.<br />
12.47 The nominal width for weaving is 157.5 cm ( 62 inches).<br />
International:<br />
1. Tsudakoma Corp.<br />
2. Nissan<br />
Indian Representative :<br />
Inditeck<br />
Mumbai - 400 002<br />
Tel.: 2200 0823<br />
Fax : 2206 4687<br />
Indian: (do not supply machinery for water jet looms)<br />
12.48 The basic process of weaving is outlined as follows:<br />
SIZED WARP<br />
WEAVING WEFT<br />
GREY FABRIC<br />
INSPECTI<strong>ON</strong>, PACKING<br />
AND DISPATCH.<br />
312
Process Systems and Equipments<br />
12.49 The machinery items required for the webbing project are:<br />
1. High Speed Water jet looms Looms.<br />
2. Inspection machine<br />
Appendix-5B (Contd..)<br />
3. Testing Lab Equipment (Breaking Strength, Tear resistance etc.)<br />
Minimum Recommended Economic Size:<br />
12.50 The Taffeta fabric weaving project proposed to be set up in India<br />
will have 20 high speed water jet machines.<br />
12.51 Under Indian operating conditions it is safer to assume machine<br />
efficiency factor of 90%, and therefore, the production would be 274 m per day<br />
per loom.<br />
12.52 The plant would operate in three shifts, 24 hours and 300 working<br />
days in a year.<br />
Investment in Process Plant and Machinery<br />
12.53 As per the indicative budgetary quotations, the investment in the<br />
plant and machinery will be Rs 2.4 crores (FOB). Finer details on the<br />
Equipment specifications and the formal quotations need to be discussed with the<br />
technology supplier before the project is taken up. Taking into account the CIF<br />
value , the custom duties (Custom duty of 5%), inland transportation, erection and<br />
commissioning (2%), the installed cost of process equipment would be Rs 2.57<br />
crores.<br />
SECTI<strong>ON</strong> III : PROJECT COST & PR<strong>OF</strong>ITABILITY PROJECTI<strong>ON</strong>S<br />
Land<br />
12.54 The total requirement of land for this project keeping in mind the possible<br />
future expansion is around 2000 Sq. Mtrs. ( 0.5 acres ).<br />
12.55 Based on the available information the cost of land is assumed at Rs 1200<br />
per square meter ( including the developmental cost ).Depending on the exact<br />
313
Appendix-5B (Contd..)<br />
location of the project to be determined by the promoter the land cost could be<br />
higher or lower. Hence the total cost of developed land will be Rs 0.24 crores.<br />
Buildings<br />
12.56 The building area comprising of main factory building, godowns, office ,<br />
labs / In-house Testing centre etc. would be 1200 sq. mtrs. The cost of<br />
construction would again vary depending on the structure and the materials to be<br />
used. It has been assumed that the average cost of construction would be Rs 4500<br />
per sq. mtr. Thus the total cost of building and other civil works would be around<br />
Rs 0.54 crores.<br />
Plant and Machinery<br />
12.57 Details of Plant and machinery as well as technology required for the<br />
project have been presented in earlier Section II . The installed cost of plant and<br />
machinery would be Rs 2.57 crores. Apart from the main process equipments the<br />
utilities required are:<br />
• Electricals,<br />
• Piping,<br />
• Power,<br />
• Water supply,<br />
• Compressors,<br />
• Softening plant<br />
• Deminaralised plant<br />
• Fire Fighting Equipments etc.<br />
12.58 The provision on this count is taken as 5 % of the cost of machinery which<br />
works out to Rs 0.13 crores.<br />
Miscellaneous Fixed Assets<br />
12.59 Under this head the items included are Furniture and fixtures, Office<br />
equipments,. and the provision made is around Rs 0.02 crores (Rs 2.0 lakhs).<br />
Testing Equipments<br />
12.60 The following testing equipments are required for the Taffeta plant:<br />
• Tensile Strength of yarn and fabric<br />
• Tear Testing<br />
• Mass per unit area<br />
314
• Thickness Gauze<br />
Appendix-5B (Contd..)<br />
12.61 The Testing and R&D facilities would call for an investment of around<br />
Rs.0.05 crores (Rs 5.0lakhs)<br />
Project Engineering and Consulting<br />
12.62 No project consultancy is required for this project.<br />
Preliminary & Preoperative Expenses<br />
12.63 The items included under this head are company formation expenses,<br />
interest during construction, pre-production expenses, during the implementation<br />
phase etc. 12% on the cost of plant and machinery inclusive of testing equipments<br />
has been considered .<br />
Contingency Expenses<br />
12.64 Depending on the gestation period and further detailing of the project cost<br />
by the promoter, the contingency provision has been made at the rate of 10%.<br />
Margin Money for Working capital<br />
12.65 The margin money for working capital forming part of the total project cost<br />
would be Rs 0.33 crores .[Exhibit 12.4]<br />
Total Project Cost (Total Investment)<br />
12.66 The total project cost as given in Exhibit 12.1 would be Rs 4.60 crores.<br />
Project Funding And Financing Pattern<br />
12.67 It has been assumed that the project would be financed through long term<br />
funds and Equity participation by the Promoter / Public. The technical textile<br />
sector being a high priority area, it is assumed that a Debt- Equity ratio of 1.5 : 1<br />
would be feasible. (However the sensitivity analysis has also been presented for 1 :<br />
1 and 2 : 1 Debt Equity ratios.)<br />
Sales , Profitability And Sensitivity Analysis<br />
Sales Realisation and Turnover<br />
12.68 As per the details available from the Technology and Equipment suppliers<br />
the economic size of a plant is 20 water jet looms.<br />
315
Appendix-5B (Contd..)<br />
12.69 Under the Indian conditions, it is assumed that the machine would operate<br />
at an efficiency level of 90 %. Hence the production from the plant would be 274<br />
m per loom per day.<br />
12.70 The plant would operate on Three -shift basis and 300 workings days in a<br />
year.<br />
12.71 The capacity utilisation for the 1st year is assumed at 80% and thereafter for<br />
the 2nd year onwards 90% respectively.<br />
12.72 The average selling price of the end product would be Rs 34/mt (net of<br />
excise duties, sales tax and other incidental expenses)<br />
12.73 Annual sales is projectd at Rs 5.48 crores.The details of sales turnover<br />
projected are given in Exhibit 12.2.<br />
Cost of Production<br />
Major Raw materials<br />
12.74 The main raw materials used and the corresponding prevailing indicative<br />
prices are as follows:<br />
Major Raw Materials Basic Price Remarks ( Excise duty)<br />
Nylon Tenacity Yarn<br />
Warp 70 denier Sized<br />
Weft 70 Denier<br />
Rs 160 per kg<br />
+ Rs 40 per kg<br />
sizing charges<br />
(without excise )<br />
Rs 160 per kg<br />
(without excise)<br />
16%<br />
16%<br />
12.75 Nylon Filament Yarn ( NFY ) and Polyester Filament Yarn )PFY)<br />
suppliers:<br />
International Suppliers:<br />
(a) Tejin Indonesia<br />
(b) Tory, Indonesia<br />
(c) Kohap, S Korea<br />
(d) Kolon, South Korea<br />
316
Conversion Cost<br />
Indian Supplier<br />
(a) Century Enka<br />
(b) Reliance<br />
(c) Indorama<br />
(d) JCT<br />
(e) GSFC<br />
Appendix-5B (Contd..)<br />
12.76 The conversion cost will include the cost of power, water , consumables,<br />
etc. which is estimated at Rs 0.87 crores. Break up is as follows:<br />
Sr.<br />
No.<br />
1. Power<br />
Particulars Basis Rate Amount per<br />
( 17.18 kWh for 20 loom<br />
+ 7.47 for lighting,<br />
pumps etc.<br />
24.65<br />
kWh<br />
2. Water charges 80000 litres<br />
3. Stores and spares<br />
per day for 20<br />
looms<br />
Estimated<br />
Rs 4.5 per kWh<br />
Rs 13/1000<br />
litres<br />
Rs 30000 per<br />
month.<br />
annum, Rs Cr.<br />
0.80<br />
0.03<br />
0.04<br />
Total 0.87<br />
Repair & Maintenance<br />
12.77 The repair and maintenance cost would be at 2.5% of the Plant &<br />
Machinery cost i.e. Rs. 0.06Cr<br />
Manpower ,Salaries and Wages<br />
12.78 The manpower requirements and the salary structure is given in Exhibit<br />
12.3.<br />
12.79 The total manpower requirement comprising of supervisors , machine<br />
operators, helpers and the managerial cadre would be 22 nos. Total wage bill<br />
inclusive of fringe benefits is estimated at Rs 0.13 crores.<br />
317
Factory and Overhead Expenses<br />
Appendix-5B (Contd..)<br />
12.80 The items covered under this head are repairs and maintenance,<br />
establishment expenses, travel expenses, packaging expenses, etc.<br />
Marketing and Promotional Expenses<br />
12.81 For marketing and promotion, a provision of 3% of sales has been made<br />
uniformly over the years.<br />
Interest and Depreciation<br />
12.82 The prevailing interest rate for long term and short term borrowed funds is<br />
assumed at 8 % per annum (Technology Upgradation Fund).<br />
12.83 The repayment of loans has been assumed for 8 years with two years<br />
moratorium.<br />
12.84 The depreciation rates as per the Company Law and Income-Tax Ready<br />
Reckoner have been worked out for Straight Line and WDV Method basis.<br />
12.85 The current corporate tax rate is assumed at 35 % and the surcharge is<br />
assumed at 2.5% per annum.<br />
Profitability, Break-even, IRR and Payback .<br />
12.86 The Sales turnover increases from Rs 4.39 Cr. in the first year to Rs 5.48<br />
Cr. from the 2nd year onwards.<br />
12.87 The PBT increases from Rs 0.13 Cr. in the first year to Rs. 0.48 Cr. in the<br />
10th year. (See Exhibit 12.5)<br />
12.88 The Break Even of the project is at 56.8%.<br />
12.89 The Internal Rate of Return ( IRR ) has been worked out at 9%.<br />
12.90 The Payback period for the project is about 4.5 years .<br />
Sensitivity Analysis.<br />
12.91 The sensitivity analysis has been presented in the Exhibit 12.6<br />
12.92 At a selling price of Rs 34 per meter and the existing custom duty structure<br />
of 20% or Rs 115 per Kg ( Whichever is higher)Taffeta cloth, the project is not<br />
very attractive unless one goes for high volume as the margin is very low.<br />
318
Appendix-5B (Contd..)<br />
12.96 A a selling price of Rs 35 and Rs 33 per mtr the IRR comes to 16% and<br />
5% as against an IRR of 9^ at selling price of Rs 34 per mt. He profitability is<br />
price sensitive.<br />
12.97 A reduction in raw material price by 10% increases the IRR value to 16%.<br />
319
Appendix-5B (Contd..)<br />
320
EXHIBIT 12.1<br />
Appendix-5B (Contd..)<br />
PROJECT COST<br />
(LAND, BUILDINGS, PROCESS PLANT & MACHINERY, UTILITIES &<br />
O<strong>THE</strong>R ASSETS)<br />
1 Land<br />
(Area: 2000 Sq. Mtrs.)<br />
Rate: (Rs.1200 /Sq. Mtr)<br />
2 Buildings<br />
(Plant Area, Office, Godown, Lab, Service Area etc.)<br />
Built-up Area : 1200 Sq. Mtrs<br />
Avg Rate : Rs.4500 /Sq. Mtrs<br />
3 Process Plant & Equipment<br />
4 Utility & Other equipments<br />
(Compressor, DM Plant, Softening Plant, etc.)<br />
5 Testing Equipments<br />
6 Misc. Fixed Assets<br />
(Furniture & Fixtures, Office Equipment, etc.)<br />
7 Project Engineering & Consultancy charges<br />
8 Preliminary & Pre-operative Expenses (12%)<br />
(Company Formation, Interest during construction,<br />
pre-production expenses, etc.)<br />
9 Contingency (10 %)<br />
10 Total<br />
11 Margin Money for Working Capital<br />
12 Total Project Cost<br />
Project Cost<br />
(Rs. Cr.)<br />
0.24<br />
0.54<br />
2.57<br />
0.13<br />
0.05<br />
0.02<br />
0.00<br />
0.33<br />
0.39<br />
4.27<br />
0.33<br />
4.60<br />
321
ITEM<br />
Average Production per day per<br />
loom (mt.)<br />
EXHIBIT 12.2<br />
Appendix-5B (Contd..)<br />
ESTIMATI<strong>ON</strong> <strong>OF</strong> SALES REVENUE<br />
(Rs. Cr.)<br />
YEAR <strong>OF</strong> OPERATI<strong>ON</strong><br />
I II III IV V VI VII VIII IX X<br />
305 305 305 305 305 305 305 305 305 305<br />
90% efficiency 275 275 275 275 275 275 275 275 275 275<br />
Capacity Utilisation % 80% 100% 100% 100% 100% 100% 100% 100% 100% 100%<br />
Actual Production per hr (mt.) 220 274 274 274 274 274 274 274 274 274<br />
Production per day for 20 looms<br />
(mt.)<br />
Production for 300 working days<br />
(mt.)<br />
4392 5480 5480 5480 5480 5480 5480 5480 5480 5480<br />
1317600 1644000 1644000 1644000 1644000 1644000 1644000 1644000 1644000 1644000<br />
Selling Price (Rs/mt.) 34.00 34.00 34.00 34.00 34.00 34.00 34.00 34.00 34.00 34.00<br />
Sales Revenue (Rs. Cr) 4.48 5.59 5.59 5.59 5.59 5.59 5.59 5.59 5.59 5.59<br />
Value Loss ( 2% ) 0.09 0.11 0.11 0.11 0.11 0.11 0.11 0.11 0.11 0.11<br />
Net Sales Revenue (Rs. Cr) 4.39 5.48 5.48 5.48 5.48 5.48 5.48 5.48 5.48 5.48<br />
322
EXHIBIT 12.3<br />
MANPOWER REQUIREMENTS<br />
Nos Monthly<br />
Total Monthly<br />
Salary<br />
Annual<br />
Technical Manager 1 20000 20000 240000<br />
Technical Assistant 2 10000 20000 240000<br />
Weaver 3 4000 12000 144000<br />
Reliever 3 4000 12000 144000<br />
Grey Checking 1 4000 4000 48000<br />
Jobber/Fitter 2 4000 8000 96000<br />
Helper 2 2500 5000 60000<br />
DM PlantOperator 1 2500 2500 30000<br />
Drawer & Reacher 1 pair 6000 6000 72000<br />
Testing 1 4000 4000 48000<br />
Clerical Staff 1 3000 3000 36000<br />
Security 3 2500 7500 90000<br />
TOTAL 22 1248000<br />
Fringe Benefits (40 % of the above) 499200<br />
Total Wage Bill (Annual) Rs. lakhs: Salary + Other 17477200.00<br />
Total Wage Bill (Annual) Rs. Cr.:<br />
Benefits = 0.17<br />
Appendix-5B (Contd..)<br />
323
ITEM<br />
Factory Related<br />
Raw materials & other<br />
commodities<br />
NO. <strong>OF</strong><br />
M<strong>ON</strong>THS<br />
MARGIN<br />
(%)<br />
W.CAP<br />
REQMT<br />
EXHIBIT 12.4<br />
REQUIREMENT <strong>OF</strong> WORKING CAPITAL<br />
Appendix-5B (Contd..)<br />
YEAR I YEAR II YEAR III YEAR IV YEAR V<br />
MARGIN<br />
M<strong>ON</strong>EY<br />
BANK<br />
FINANCE<br />
W.CAP<br />
REQMT<br />
MARGIN<br />
M<strong>ON</strong>EY<br />
BANK<br />
FINANCE<br />
W.CAP<br />
REQMT<br />
MARGIN<br />
M<strong>ON</strong>EY<br />
BANK<br />
FINANCE<br />
W.CAP<br />
REQMT<br />
MARGIN<br />
M<strong>ON</strong>EY<br />
BANK<br />
FINANCE<br />
W.CAP<br />
REQMT<br />
MARGIN<br />
M<strong>ON</strong>EY<br />
1.00 25.00 0.21 0.05 0.16 0.46 0.12 0.34 0.46 0.12 0.34 0.46 0.12 0.34 0.46 0.12 0.34<br />
Finished Goods 1.00 25.00 0.30 0.08 0.22 0.37 0.09 0.28 0.37 0.09 0.28 0.37 0.09 0.28 0.37 0.09 0.28<br />
A/c Receivable 1.00 25.00 0.37 0.09 0.28 0.46 0.12 0.34 0.46 0.12 0.34 0.46 0.12 0.34 0.46 0.12 0.34<br />
Cash in hand<br />
Salaries & wages 1.00 0.00 0.01 0.00 0.01 0.01 0.00 0.01 0.01 0.00 0.01 0.01 0.00 0.01 0.01 0.00 0.01<br />
Utilities 1.00 0.00 0.06 0.00 0.06 0.07 0.00 0.07 0.07 0.00 0.07 0.07 0.00 0.07 0.07 0.00 0.07<br />
Repairs & Maintenance 1.00 0.00 0.00 0.00 0.00 0.00 0.00 0.00 0.00 0.00 0.00 0.00 0.00 0.00 0.00 0.00 0.00<br />
Marketing & Promotional<br />
Expenses<br />
1.00 0.00 0.01 0.00 0.01 0.01 0.00 0.01 0.01 0.00 0.01 0.01 0.00 0.01 0.01 0.00 0.01<br />
Admin. Overheads 1.00 0.00 0.01 0.00 0.01 0.01 0.00 0.01 0.01 0.00 0.01 0.01 0.00 0.01 0.01 0.00 0.01<br />
Total Requirement 0.97 0.22 0.74 1.39 0.33 1.07 1.39 0.33 1.07 1.39 0.33 1.07 1.39 0.33 1.07<br />
(Rs.Cr)<br />
BANK<br />
FINANCE<br />
324
ITEM<br />
Factory Related<br />
Raw materials & other<br />
commodities<br />
NO. <strong>OF</strong><br />
M<strong>ON</strong>THS<br />
MARGIN<br />
(%)<br />
W.CAP<br />
REQMT<br />
EXHIBIT 12.4 (Contd..)<br />
REQUIREMENT <strong>OF</strong> WORKING CAPITAL<br />
Appendix-5B (Contd..)<br />
YEAR VI YEAR VII YEAR VIII YEAR XI YEAR X<br />
MARGIN<br />
M<strong>ON</strong>EY<br />
BANK<br />
FINANCE<br />
W.CAP<br />
REQMT<br />
MARGIN<br />
M<strong>ON</strong>EY<br />
BANK<br />
FINANCE<br />
W.CAP<br />
REQMT<br />
MARGIN<br />
M<strong>ON</strong>EY<br />
BANK<br />
FINANCE<br />
W.CAP<br />
REQMT<br />
MARGIN<br />
M<strong>ON</strong>EY<br />
BANK<br />
FINANCE<br />
W.CAP<br />
REQMT<br />
MARGIN<br />
M<strong>ON</strong>EY<br />
1.00 25.00 0.46 0.12 0.34 0.46 0.12 0.34 0.46 0.12 0.34 0.46 0.12 0.34 0.46 0.12 0.34<br />
Finished Goods 1.00 25.00 0.37 0.09 0.28 0.37 0.09 0.28 0.37 0.09 0.28 0.37 0.09 0.28 0.37 0.09 0.28<br />
A/c Receivable 1.00 25.00 0.46 0.12 0.34 0.46 0.12 0.34 0.46 0.12 0.34 0.46 0.12 0.34 0.46 0.12 0.34<br />
Cash in hand<br />
Salaries & wages 1.00 0.00 0.01 0.00 0.01 0.01 0.00 0.01 0.01 0.00 0.01 0.01 0.00 0.01 0.01 0.00 0.01<br />
Utilities 1.00 0.00 0.07 0.00 0.07 0.07 0.00 0.07 0.07 0.00 0.07 0.07 0.00 0.07 0.07 0.00 0.07<br />
Repairs & Maintenance 1.00 0.00 0.00 0.00 0.00 0.00 0.00 0.00 0.00 0.00 0.00 0.00 0.00 0.00 0.00 0.00 0.00<br />
Marketing & Promotional<br />
Expenses<br />
1.00 0.00 0.01 0.00 0.01 0.01 0.00 0.01 0.01 0.00 0.01 0.01 0.00 0.01 0.01 0.00 0.01<br />
Admin. Overheads 1.00 0.00 0.01 0.00 0.01 0.01 0.00 0.01 0.01 0.00 0.01 0.01 0.00 0.01 0.01 0.00 0.01<br />
Total Requirement 1.39 0.33 1.07 1.39 0.33 1.07 1.39 0.33 1.07 1.39 0.33 1.07 1.39 0.33 1.07<br />
(Rs.Cr)<br />
BANK<br />
FINANCE<br />
325
EXHIBIT 12.5<br />
Appendix-5B (Contd..)<br />
PR<strong>OF</strong>ITABILITY STATEMENT AND COMPUTATI<strong>ON</strong> <strong>OF</strong> TAX<br />
ACCOUNT HEAD<br />
I II III<br />
FINANCIAL YEAR <strong>OF</strong> OPERATI<strong>ON</strong><br />
IV V VI VII VIII IX<br />
(Rs.Cr)<br />
X<br />
Revenue<br />
Net Sales Turnover 4.39 5.48 5.48 5.48 5.48 5.48 5.48 5.48 5.48 5.48<br />
Total Revenue<br />
Expenses<br />
4.39 5.48 5.48 5.48 5.48 5.48 5.48 5.48 5.48 5.48<br />
Raw Materials 2.49 3.11 3.11 3.11 3.11 3.11 3.11 3.11 3.11 3.11<br />
Salaries & wages 0.14 0.17 0.18 0.19 0.20 0.21 0.22 0.23 0.24 0.25<br />
Conversion Cost 0.70 0.87 0.87 0.87 0.87 0.87 0.87 0.87 0.87 0.87<br />
Repairs & Maintenance 0.05 0.06 0.06 0.06 0.06 0.06 0.06 0.06 0.06 0.06<br />
Marketing & Promotional Expenses 0.08 0.10 0.10 0.10 0.10 0.10 0.10 0.10 0.10 0.10<br />
Factory & Office Overheads 0.13 0.16 0.16 0.16 0.16 0.16 0.16 0.16 0.16 0.16<br />
Other Expenses 0.00 0.00 0.00 0.00 0.00 0.00 0.00 0.00 0.00 0.00<br />
Interest on S.T. Loans 0.06 0.11 0.11 0.11 0.11 0.11 0.11 0.11 0.11 0.11<br />
Cost of Sales 3.64 4.58 4.59 4.60 4.61 4.62 4.63 4.64 4.65 4.66<br />
Operating profit 0.75 0.90 0.89 0.88 0.87 0.86 0.85 0.84 0.83 0.82<br />
Depreciation (St.Line) 0.33 0.33 0.33 0.33 0.33 0.33 0.33 0.33 0.33 0.33<br />
Interest on L.T Loan 0.29 0.29 0.26 0.22 0.18 0.15 0.11 0.07 0.04 0.01<br />
Profit Before Tax 0.13 0.28 0.30 0.33 0.36 0.38 0.41 0.44 0.46 0.48<br />
Tax 0.01 0.02 0.06 0.11 0.15 0.18 0.21 0.24 0.25 0.26<br />
Profit After Tax 0.12 0.26 0.24 0.22 0.21 0.20 0.21 0.21 0.21 0.22<br />
Dividend 0.00 0.00 0.06 0.06 0.06 0.12 0.12 0.12 0.12 0.12<br />
Profits For Appropriation 0.12 0.26 0.24 0.22 0.21 0.20 0.21 0.21 0.21 0.22<br />
326
EXHIBIT 12.5 (Contd..)<br />
PR<strong>OF</strong>ITABILITY STATEMENT AND COMPUTATI<strong>ON</strong> <strong>OF</strong> TAX<br />
Appendix-5B (Contd..)<br />
ACCOUNT HEAD<br />
COMPUTATI<strong>ON</strong> <strong>OF</strong> TAX<br />
I II III<br />
FINANCIAL YEAR <strong>OF</strong> OPERATI<strong>ON</strong><br />
IV V VI VII VIII IX<br />
(Rs.Cr)<br />
X<br />
Profit after interest before depreciation 0.46 0.61 0.63 0.66 0.69 0.71 0.74 0.77 0.79 0.81<br />
Depr.(WDV) to be claimed 0.82 0.62 0.47 0.35 0.26 0.20 0.15 0.10 0.08 0.06<br />
Depreciation claimed 0.33 0.33 0.33 0.33 0.33 0.33 0.33 0.33 0.33 0.33<br />
Depr. carried forward 0.49 0.29 0.14 0.02 0.00 0.00 0.00 0.00 0.00 0.06<br />
Export Income exempt from tax 0.00 0.00 0.00 0.00 0.00 0.00 0.00 0.00 0.00 0.00<br />
Taxable Profit -0.36 -0.01 0.16 0.31 0.43 0.51 0.59 0.67 0.71 0.74<br />
Profit Before Tax (Book) 0.13 0.28 0.30 0.33 0.36 0.38 0.41 0.44 0.46 0.48<br />
Minimum Alternate Tax 0.01 0.02 0.00 0.00 0.00 0.00 0.00 0.00 0.00 0.00<br />
Tax (Actual) 0.00 0.00 0.06 0.11 0.15 0.18 0.21 0.24 0.25 0.26<br />
Tax Provision 0.01 0.02 0.06 0.11 0.15 0.18 0.21 0.24 0.25 0.26<br />
327
EXHIBIT No.12.6<br />
SENSITIVITY ANALYSIS<br />
Items Profit after Tax<br />
(PAT)<br />
( assumed at 90<br />
% capacity )<br />
Break<br />
Even<br />
(%)<br />
Internal<br />
Rate of<br />
Return<br />
(IRR)<br />
(%)<br />
Payback<br />
Period<br />
(Years)<br />
NORMAL VALUES Rs 0.26 Cr. 56.81 9% 4.4<br />
Change in Selling Price to<br />
(a) Rs 35 per mtr<br />
(b) Rs 33 per mtr<br />
Decrease in Raw Material<br />
Price by10%<br />
0.56<br />
0.13<br />
0.47<br />
50.51<br />
62.75<br />
5.23%<br />
16%<br />
5%<br />
16%<br />
2.5<br />
7.5<br />
3.6<br />
Appendix-5B (Contd..)<br />
328
AGRO SHADE NET PROJECT<br />
Appendix-5C<br />
SECTI<strong>ON</strong> I: PRODUCT BRIEF, APPLICATI<strong>ON</strong> AREAS & MARKET<br />
POTENTIAL<br />
1.1 PRODUCT BRIEF<br />
In the field of Technical Textiles , agriculture is one of the end use sector of<br />
national interest. In the agricultural arena various textile base products are used,<br />
some are general-purpose industrial application products and some are specialised<br />
structures exclusively designed for agricultural applications (Agro textiles). Agro<br />
shade net is one of the most popular product in India. Agro shade nets are used in<br />
horticulture, floriculture, green house/poly house, forestry and farming arena to<br />
protect plantation from the sun in order to ensure healthy plant growth and good<br />
harvest.<br />
The main agro shade net is a knitted fabric structure manufactured from<br />
polyethylene, Polypropylene polymer that is either tape or monofilament forms<br />
etc. Appropriate UV stabilizers are incorporated in base polymer so as to impart<br />
Ultra Violet stability property to the shade net structure.<br />
1.2 MAJOR APPLICATI<strong>ON</strong>S AND END USAGE:<br />
• Horticulture.<br />
• Floriculture.<br />
• Green/Poly/Shade house.<br />
• Nurseries<br />
• Forestry<br />
1.3 EMERGING MARKET POTENTIAL - Global And Indian<br />
1.3.1 Global Market Potential* (agro textiles):<br />
Global market potential for agro textile is given below.<br />
Worldwide consumption of agro-tech<br />
products in '000 tonnes<br />
555<br />
1985<br />
2005<br />
1021<br />
741<br />
1995<br />
* Ref – DRA report (Technical Textiles report)
Worldwide Consumption of Agro-tech products<br />
Appendix-5C (Contd…)<br />
Year 1985 1995 2005<br />
Consumption in 000 tonnes 555 741 1021<br />
Value in US $ million 2517 3636 5088<br />
Projected overall global demand for agro textiles (inclusive of agro<br />
shade net) is around 1021000 tonnes ( year 2005) valued at $ 5088 million .<br />
1.3.2 Indian Market Potential* :<br />
Indian market potential for agro shade net fabric is presented below<br />
in tabular form:<br />
Indian Market Potential for Agro shade net<br />
Year<br />
2003-2004 2007-2008<br />
Quantity, tonnes 1650 8250<br />
Value, Rs. Cr. 20 99<br />
* Ref – TECS Phase-II report<br />
The present Indian market size for agro shade net is 1,650 tonnes, worth<br />
value of 20 Cr. Rs. It is estimated that consumption for the year 2007 would be<br />
8250 tonnes, costing 99 Cr. Rs.<br />
1.4 MAJOR PRODUCERS<br />
Some of the major producers of agro shade nets in India.<br />
• Netlon India Limited<br />
• Malmo Exim Limited<br />
• Krishi Net Limited<br />
Agro shade nets are produce with 35%, 50%, 75% and 95% shade percentages<br />
values with a standard width of 3-8 mts. and roll length of 50/100 mts.<br />
Cost of agro shade net varies from manufacture to manufacture and is<br />
dependent on shade percentage and colour. Generally cost per square meter ranges<br />
between 15-21. Indicative cost for shade net is given overleaf:<br />
330
Agro shade nets & its prices<br />
Appendix-5C (Contd…)<br />
Shade (%) Colour Rates/Mtrs. 2 (Rs.)<br />
25-30 Green/White 16<br />
50-55 Green/White 18<br />
65-70 Green/White 19<br />
75-80 Green/White 20<br />
90 Green/White 21<br />
25-30 Black 15<br />
50-55 Black 17<br />
65-70 Black 18<br />
75-80 Black 19<br />
90 Black 20<br />
SECTI<strong>ON</strong> II: AGRO SHADE NET MANUFACTURING MACHINERY,<br />
TECHNOLOGY AND EQUIPMENTS SUPPLIERS<br />
The technology and the equipment for the Shade net manufacturing is Warp<br />
Knitting Machine for structure production and warping machine for preparation of<br />
suitable yarn beams. These machines are supplied by globally recognised player, namely<br />
Karl Mayer, Germany, Liba, Germany, etc.<br />
The approximate cost for two knitting machine and one warping machine is<br />
Rs.2.02 Cr.<br />
SECTI<strong>ON</strong> III: PROJECT COST AND PR<strong>OF</strong>ITABILITY PROJECTI<strong>ON</strong>S<br />
3.1 LAND<br />
The total requirement of land for this project is around 1000 Sq. Mtrs.<br />
Based on the available information the cost of land is assumed at Rs 1200 per<br />
square meter (including the developmental cost). Depending on the exact location<br />
of the project to be determined by the promoter, the land cost could be higher or<br />
lower. Hence the total cost of developed land will be Rs 0.14 crore (Rs 12 lakhs).<br />
3.2 BUILDINGS<br />
The building area comprising of main factory building, godowns, office, R<br />
& D labs/In-house Testing centre etc would be 500 sq. mtrs.The cost of<br />
construction would again vary depending on the structure and the materials to be<br />
used. It has been assumed that the average cost of construction would be Rs 4500<br />
per sq mtr. Thus the total cost of building and other civil works would be around<br />
Rs 0.22 crores (Rs 22 lakhs).<br />
331
3.3 PLANT AND MACHINERY<br />
Appendix-5C (Contd…)<br />
Details of Plant and machinery as well as technology required for the<br />
project have been given in previous section. The installed cost of plant and<br />
machinery would be Rs 2.02 crores. Apart from the main process equipments, the<br />
utilities required are Electricals, Piping, Water supply, compressors, fire fighting<br />
equipments etc. The provision on this count is taken as 5% of the cost of<br />
machinery which works out to Rs 0.10 crores.<br />
3.4 MISCELLANEOUS FIXED ASSETS<br />
Under this head the items included are Furniture and fixtures, Office<br />
equipments, Air Conditioners etc. and the provision made is around Rs 0.15 crore<br />
(Rs 15 lakhs) inclusive of the Testing and R & D facilities.<br />
3.5 PROJECT ENGINEERING AND C<strong>ON</strong>SULTING<br />
Under this head the items included are the fees and expenses on account of<br />
Architect fees, project engineering and management (both local and overseas), detailed<br />
project reports etc.<br />
3.6 PRELIMINARY & PREOPERATIVE EXPENSES<br />
The items included under this head are company formation expenses, public<br />
issue expenses (if any), interest during construction, and pre production expenses<br />
during the implementation phase etc.<br />
3.7 C<strong>ON</strong>TINGENCY EXPENSES<br />
Depending on the gestation period and further detailing of the project cost by the<br />
promoter, the contingency provision has been made at the rate of 10%.<br />
3.8 MARGIN M<strong>ON</strong>EY FOR WORKING CAPITAL<br />
The margin money for working capital forming part of the total project cost<br />
would be Rs 0.10 crores.<br />
3.9 TOTAL PROJECT COST<br />
The total project cost as given in Exhibit 1 would be Rs 3.34 crores.<br />
3.10 SALES REALISATI<strong>ON</strong> AND TURNOVER<br />
As per the targeted capacity the no. of knitting and warping machine<br />
required are two and one respectively.<br />
332
Appendix-5C (Contd…)<br />
Under the Indian conditions, it is assumed that the machine would operate<br />
at an efficiency level of 75%. Hence the production from the plant would be 1350<br />
Square meters per hour.<br />
year.<br />
The plant would operate on Three-shift basis and 300 workings days in a<br />
The capacity utilisation for the 1st year is assumed at 50% and thereafter for<br />
the 2nd, 3rd and 4th year onwards 60%, 75% and 90% respectively.<br />
The average selling price of the end product would be Rs 18 per Square<br />
meters (net of excise duties, sales tax and other incidental expenses).<br />
The details of projected sales turnover as projected are given in Exhibit 2.<br />
3.11 MAJOR RAW MATERIALS<br />
Polyethylene, Polypropylene tape and monofilament yarn are the main raw<br />
materials used in these products.<br />
3.12 MANPOWER, SALARIES AND WAGES<br />
The manpower requirements and the salary structure is given in<br />
Exhibit 3.<br />
The total manpower requirement comprising the managerial cadre of<br />
supervisors, machine operators and helpers would be 21 persons.<br />
333
Appendix-5C (Contd…)<br />
334
EXHIBIT 1<br />
Appendix-5C (Contd…)<br />
PROJECT COST<br />
(LAND, BUILDINGS, PROCESS PLANT & MACHINERY, UTILITIES &<br />
O<strong>THE</strong>R ASSETS)<br />
Project Cost<br />
1<br />
2<br />
Land<br />
Area: 1000 Sq Mtrs<br />
Rate: (Rs.1200 /Sq. Mtr)<br />
Buildings<br />
Plant Area, Office, Godown, Lab, Service Area etc.)<br />
Built-up Area : 500 Sq. Mtrs<br />
Avg Rate : Rs. 4500 /Sq. Mtrs<br />
3 Process Plant & Equipment<br />
4 Utility & Other equipments (5%)<br />
(Power, Water, Compressor, Humidity Control,<br />
Fire Fighting, Material Handling etc.)<br />
5 Misc. Fixed Assets<br />
(Furniture & Fixtures, Office Equipment, Testing Lab etc.)<br />
6 Project Engineering & Consultancy charges (2.5%)<br />
7<br />
Preliminary & Pre-operative Expenses (12%)<br />
(Company Formation, Interest during construction,<br />
pre-production expenses, etc.)<br />
8 Contingency (10 %)<br />
9 Total<br />
10 Margin Money for Working Capital<br />
11 Total Project Cost<br />
(Rs. Cr.)<br />
0.12<br />
0.22<br />
2.02<br />
0.10<br />
0.15<br />
0.0505<br />
0.24<br />
2.90<br />
0.10<br />
3.34<br />
335
ITEM<br />
Average Production per<br />
hour (Sq.Mts.)<br />
EXHIBIT 2<br />
Appendix-5C (Contd….)<br />
ESTIMATI<strong>ON</strong> <strong>OF</strong> SALES REVENUE (RS. CRORE)<br />
YEAR <strong>OF</strong> OPERATI<strong>ON</strong><br />
I II III IV V VI VII VIII IX X<br />
1800 1800 1800 1800 1800 1800 1800 1800 1800 1800<br />
75% efficiency 1350 1350 1350 1350 1350 1350 1350 1350 1350 1350<br />
Capacity Utilisation 50% 60% 75% 90% 90% 90% 90% 90% 90% 90%<br />
Actual Production per<br />
hour(Sq. Mts.)<br />
Production per day<br />
(Sq.Mts.)<br />
Production for 300<br />
working days (Sq. Mts.)<br />
900 1080 1350 1620 1620 1620 1620 1620 1620 1620<br />
21600 25920 32400 38880 38880 38880 38880 38880 38880 38880<br />
6480000 7776000 9720000 11664000 11664000 11664000 11664000 11664000 11664000 11664000<br />
Selling Price (Rs/Sq.Mts.) 18.00 18.00 18.00 18.00 18.00 18.00 18.00 18.00 18.00 18.00<br />
Sales Revenue (Rs. Cr) 11.66 14.00 17.50 21.00 21.00 21.00 21.00 21.00 21.00 21.00<br />
Value Loss ( 2% ) 0.23 0.28 0.35 0.42 0.42 0.42 0.42 0.42 0.42 0.42<br />
Net Sales Revenue<br />
(Rs. Cr)<br />
11.43 13.72 17.15 20.58 20.58 20.58 20.58 20.58 20.58 20.58
EXHIBIT 3<br />
MANPOWER REQUIREMENTS<br />
Appendix-5C (Contd…)<br />
Nos Monthly Total Mon. Annual<br />
Production Manager 1 15000 15000 180000<br />
Machine Operator 6 4000 24000 288000<br />
Machine Helper (Semi<br />
Skilled)<br />
3 3000 9000 108000<br />
R&D, Testing 1 10000 10000 120000<br />
Marketing & Sales 3 12000 36000 432000<br />
Clerical Staff 3 4000 12000 144000<br />
Other Staff 2 2500 5000 60000<br />
Maintenance (Mech. & Elec.) 2 4000 8000 96000<br />
TOTAL 21 119000 1428000<br />
Fringe Benefits (40 % of the above) 571200<br />
Total Wage Bill (Annual) Rs. lakhs: 1999200.00<br />
Salary + Other Benefits =<br />
Total Wage Bill (Annual) Rs. Cr.:<br />
0.19992<br />
337
Appendix-5C (Contd…)<br />
338
FIBER FILL PROJECT<br />
1. PRODUCTS AND TECHNOLOGY<br />
Appendix-5C (Contd…)<br />
1. A synthetic fiber stuffing for pillows, cushions, quilts, mattresses, baby<br />
beds, sleeping bags, soft toys, furniture comforters, bedspreads, industrial<br />
insulation, life jackets etc. Polyester fibers are most commonly used.<br />
2. A very wide range of fiber types and qualities are used in the manufacture<br />
of these items.<br />
3. Natural materials such as coir, sisal, wool, cotton, kapok, glass and<br />
horsehair have been traditionally used as filling materials for upholstered<br />
furniture and other applications.<br />
4. Synthetics have advantage over natural fibers in terms of launderability and<br />
low propensity to harbour dust or fluff and hence became popular. Making<br />
synthetic fibre fire retardant (treated or inherent) is added advantage.<br />
5. The new products are based on hollow fibers incorporating a number of<br />
channels or bi-component fibers (in some cases).<br />
6. Fiberfill is crimped polyester staple fiber (PSF) hollow in cross-section so<br />
that it has higher bulk, loft, air circulation and resilience, making it soft,<br />
light and durable material for filling in comfort products. These fibres are<br />
manufactured on standard melt spinning system.<br />
7. These fibers also have advantages like improved shape retention, higher<br />
insulation (increased warmth per unit weight) and increased breathability.<br />
2. MAJOR APPLICATI<strong>ON</strong>S<br />
The majority of the fibers are consumed in home textile sector. The application<br />
areas may be classified as follows:<br />
• Interior Textiles<br />
o Bed Textiles<br />
o Sleeping bags<br />
o Furniture components<br />
o Bath room textiles<br />
o Accessories<br />
o Baby mattress<br />
o Box & folding mattress<br />
o Quilts<br />
o Quilted winter garments<br />
o Ski-suits<br />
• Automotive Textiles<br />
o Car Interiors<br />
o Seat covers<br />
• Stuffed toys<br />
• Industrial<br />
o Insulation<br />
339
3. GLOBAL & INDIAN MARKET POTENTIAL:<br />
Appendix-5C (Contd…)<br />
• As compared to other textile sectors, global trades for fibre fill is still relatively<br />
low.<br />
• Unlike clothing industry which has become global in terms of its supply chain<br />
and its served market, the fiber fill industry remains relatively regionalised.<br />
• End product preferences vary considerably according to culture, history,<br />
climate etc. In addition many fill products are difficult and expensive to<br />
transport as a result of their bulkiness.<br />
• The domestic market is not adequately developed and the buyers are not aware<br />
of different qualities available for soft toys.<br />
• Soft toys from Chinese and other sources, which are available in many varieties<br />
and at relatively lower cost, the preference for imported toys will continue.<br />
• India until recently had a fairly unsophisticated and limited industry in this area<br />
as compared to developed countries.<br />
• The per capita domestic consumption of fiberfill today is only 20 gms as<br />
against 1007 gms in USA implying majority of Indians still have to utilize fiber<br />
fill products (Table 1 & 2).<br />
Table-1<br />
Consumption of fibre type<br />
Filament Staple Fiberfill<br />
US & EU (%) 41 49 10<br />
India (%) 54 45 1<br />
Source: Recron Perfection A Reliance publication – January – March 2003<br />
Table 2<br />
Fibre fill consumption level<br />
USA India<br />
Population (crore) 27 100<br />
Fiberfill<br />
(tpa)<br />
consumption 2,90,000 20,000<br />
Per capita consumption 1007 gms 20 gms<br />
Source: Recron Perfection A Reliance publication – January – March 2003<br />
340
Appendix-5C (Contd…)<br />
• Market size (domestic) for fiberfill was 48,000 tonnes valued at Rs. 288 Cores<br />
(2001-02)<br />
4. MAJOR MANUFACTURERS<br />
• Reliance Industries Ltd.<br />
• Arora fiber Ltd.<br />
• Harish Fiber Ltd.<br />
• Nirmal Fiber Ltd.<br />
• Ganesh Polytex Ltd.<br />
5. PLANT DETAILS<br />
Equipment supplier 1. Zimmer GmbH, Germany<br />
2. Enka tecnica, Germany<br />
3. Viba Siat, Italy<br />
4. Comoli Fermo S.r.l., Italy<br />
5. Barmag, Germany<br />
6. Erema, Austria<br />
7. Huitong Polyester Corporation, China<br />
Capacity 2500 tpa 1.5 – 4 D @ 800 – 1000<br />
mpm spinning speed @<br />
95% efficiency<br />
Essential machineries Main spinning system Dryer – hopper – blender<br />
– extruder – spinneret –<br />
spinning chute – tow<br />
formation<br />
Downstream processing<br />
machineries<br />
Stacking – Drawing –<br />
heatsetting – finish<br />
applicator – crimping –<br />
relaxation and<br />
thermosetting – cutting<br />
baling<br />
Project cost 2.5 Crores Turnkey project<br />
execution – 12 months<br />
Note: M/s Huitong Corp., China has been considered for estimation purposes<br />
since they supply the most economy size plant and machineries<br />
341
6. REGULATORY FRAMEWORK & POLICY ISSUES<br />
Appendix-5C (Contd…)<br />
o Institutional buyers like defense, tourism industry, disaster management<br />
programme authorities; relief service bodies (especially in colder region)<br />
etc. may be insisted to consume these products<br />
o Inter ministerial support is essential to promote these goods<br />
o Impose hefty import duty for finished goods to discourage entry<br />
o Propose more promotional programmes to increase awareness<br />
7. TESTING REQUIREMENT & FACILITIES<br />
Sr. No. Property Facility available<br />
1 Thermal insulation In standard textile testing laboratories across<br />
the country are equipped with all relevant<br />
testing facilities for the fibre fill products.<br />
This includes both fibre and finished goods.<br />
2 Flame retardancy -- do --<br />
3 Resiliency -- do --<br />
4 Tensile properties -- do --<br />
SECTI<strong>ON</strong> II: FIBER FILL TECHNOLOGY AND EQUIPMENTS<br />
SUPPLIERS<br />
Process Description:<br />
The fiber fill process is a melt spinning system involving the direct<br />
conversion of a polymer into staple fibers.<br />
The typical melt spinning process consists of several integrated steps in the<br />
conversion of polymer into staple fibers. The major elements of the process are :<br />
Material preparation system<br />
The system includes bottle breaker, mixer, and washing facility; it will<br />
process the raw material like wasteful bottles, wasteful yarn, fiber and polyester<br />
blocks to be uniform material for drying and spinning.<br />
Drying system<br />
During regenerated polyester fiber spinning process, in order to avoid<br />
material degradation in high temperature, which may result of high percentage<br />
342
Appendix-5C (Contd…)<br />
breakage, adherence, bad finishing property and low tenacity, moisture of PET<br />
material should be decreased prior to spinning<br />
Material is charged into vacuum driers through hopper. The vacuum driers<br />
are jacketed and heated by steam; it’s tilted to expedite the material rolling in<br />
vacuum drier. To expedite drying process, one vacuum system containing vacuum<br />
pump and dust separator will be equipped for vacuum setup. One batch drying<br />
time will be about 10 hours. After drying, the moisture will be not more than<br />
0.001%.<br />
Spinning system<br />
Polyester material is extruded to be polymer melt in extruder by heating and<br />
extrusion, The polymer melt melted by screw extruders is uniformly distributed to<br />
spinning beam through manifold for spinning. Polymer melt in extruders shall be<br />
heated by electricity through jacket. In addition two polymer filters shall be equipped<br />
in conjunction with each extruder for polymer filtration.<br />
One spinning machine shall be equipped which contains two spinning<br />
beams, Spinning beams are heated by downtherm vapor; one electric downtherm<br />
heaters are equipped for the spinning machine. The downtherm heating system is<br />
of close circulation. Downtherm shall be of mixed composition of 75% biphenyl<br />
aether and 25% biphenyl. Each spinning beam contains four positions, therefore<br />
there will equip total eight spinning positions. 8pcs inverter controlled metering<br />
pumps shall be equipped for polymer pumping and metering.<br />
Polymer melt is extruded to be undrawn filament by spinneret, 8pcs<br />
spinnerets shall be equipped, undrawn filament bundles are cooled and solidified<br />
by quench air, then the bundles are inducted to the draw-off machine through<br />
quench duct. Quench ducts shall be cooled by quench air system. In order to assure<br />
running stability and filament quality excellence, quench air flow, quench air<br />
speed and quench air temperature, moisture shall be strictly controlled during melt<br />
cooling and solidifying.<br />
The undrawn filaments from each position are firstly drawn to be one<br />
bundle and applied by spin finish for moisture by double face application roller,<br />
finally eight bundles are gathered to be one single tow from draw-off machine,<br />
tows shall be deposited into cans uniformly via feed roller.<br />
343
Fiber downstream processing system<br />
Illustration of fiber downstream processing system<br />
Appendix-5C (Contd…)<br />
The tows produced from spinning system will be not valuable due to their<br />
low molecule orientation and tenacity. Tows’ drawing shall be required to improve<br />
molecule orientation to gain sufficient tenacity and proper elongation property. In<br />
addition, tows shall be largely shrunk caused by heating, therefore thermosetting<br />
shall be required to improve tows’ thermal stability. In consideration of blending<br />
spinning with other natural or chemical synthetic fibers, crimping shall be required<br />
to increase fibers’ yarn forming capability. In order to avoid electrostatic occurring<br />
and improve fibers’ spinning property, spin finish application shall be proceeded<br />
with. Eventually, finishing products shall be produced after cutting and baling. In<br />
consequence, fiber downstream processing system will be absolutely needed for<br />
fiber production.<br />
Fiber downstream processing system contains gathering, tows’ guiding,<br />
drawing, stacking, crimping, tows conveying, thermosetting, towing, cutting and baling<br />
procedures etc. In case of normal fiber production, relaxation thermosetting machine<br />
will only act the purpose of tows conveyor without adding steam for heating. The<br />
downstream processing system is illustrated as follows;<br />
Creel Guide stand Guide roller<br />
Draw roller I<br />
Steam heating box<br />
Crimper<br />
Relaxation<br />
thermosetting machine<br />
Cutter<br />
Dipping bath Draw roller II<br />
Draw roller III<br />
Tow conveyor<br />
Towing machine<br />
Fiber conveyor<br />
Tow stacker<br />
J box<br />
Tension bracket<br />
Baling press<br />
344
Gathering<br />
Appendix-5C (Contd…)<br />
In order to increase fiber downstream processing system capability,<br />
gathering procedure is particularly proceeded with. The quantity of spinning-cans<br />
can be adjusted in accordance with the type of product. Un-drawn yarn pulled from<br />
cans passed through creel, up guide stand, down guide stand for adjusting its<br />
tension.<br />
Drawing<br />
The tensed tow from creel is divided into three plies tow ribbon and drawn<br />
into the fiber line area passing the guide roller, dipping bath where three plies tow<br />
layer is homogenized. The complete orientation, crystallization of the molecular<br />
structure of the filaments is obtained after passing the draw zone. Tows’ drawing<br />
shall be proceeded with in hot medium.<br />
Inside the first draw zone, between seven roller draw roller I and seven<br />
roller draw roller II, the main drawing is achieved at about 72 which is heated by<br />
the dipping draw bath. Tows shall be drawn for 4.0-5.0 times.<br />
Inside the second draw zone, between draw roller II and seven roller draw<br />
roller III, the main drawing is achieved at about 90 . The thermal energy for<br />
drawing is supplied by steam box which is located in front of the draw roller III,<br />
Tows shall be drawn for 1.1-1.2 times.<br />
Rollers of the draw roller III are heated by steam. Normally roller surface<br />
speed of the draw roller III is named as drawing speed. It’s very important factor<br />
of fiber downstream system capability. In the proposed plant, 180m/min will be<br />
the maximum drawing speed; 150m/min shall be recommended for normal<br />
running.<br />
Polyester fibers’ molecule orientation and crystallization shall be largely<br />
improved after drawing.<br />
Stacking<br />
The thermosetting tow is sent to the tow stacker in which it is applied by the<br />
spin finish. Three bundles of oiled tow are combined to one by passing through the<br />
tow stacker. Stacking is achieved by roller, whose bevel angle can be adjusted. The<br />
width of tow is important for crimping and combining as well.<br />
345
Crimping<br />
Appendix-5C (Contd…)<br />
One crimper is equipped for tows’ crimping. Crimping is achieved by the<br />
stuffing box in the crimper and in front of it the steam pre-heater supplies the<br />
necessary thermal energy, which gives fiber product good properties of yarn<br />
forming and nice handing for next manufacture.<br />
Relaxation thermosetting<br />
In case of hollow fiber production, because of hollow fibers’ property of<br />
relatively lower tenacity and higher elongation, relaxation thermal setting machine<br />
shall be applied for hollow fiber production, it’s of continuous shade type, in the<br />
procedure of relaxation thermosetting, temperature should be controlled at about<br />
140% to control the shrinkage rate to be less than 1%. After relaxation<br />
thermosetting, property of relatively lower tenacity and higher elongation of tows<br />
shall be obtained.<br />
When producing normal fiber, relaxation thermosetting machine will only<br />
act the purpose of tows conveyor without adding steam for heating.<br />
Towing & tension unit<br />
To stabilize the tension of tows before feeding cutter, towing machine and<br />
tension unit is equipped for the purpose.<br />
Cutting<br />
One cutter is equipped for fiber cutting. The tow is twined on the blade tray<br />
of the cutter, then the roller presses tow to the blade and staple fiber downfalls from<br />
inside of the blade tray. The staple fiber length is depended on the distance between<br />
two blades on the tray. The wool type is obtained by mixing different length fiber,<br />
which is got through different distance among blades.<br />
Baling<br />
One baling press is equipped for fiber baling. The staple fiber is sent to the<br />
baling press by the gravity. In the baling press, staple fiber is measured and<br />
pressed into bales.<br />
Quenching / Attenuation Zone : As the filaments emerge through the<br />
spinnerette holes, they are directed downward into quench chambers or chimneys.<br />
As the filaments travel through these chambers, cool air is directed across the<br />
346
Appendix-5C (Contd…)<br />
filament bundle to cool the molten filaments sufficiently to cause solidification.<br />
The filaments are then led further downward into a tapered conduit by an<br />
airstream. A second stream of high velocity air is directed parallel to the direction<br />
of the filaments, causing an acceleration and accompanying attenuation or<br />
stretching of the individual filaments. This mechanical stretching results in<br />
increased orientation of the polymer chains making up the continuous filament.<br />
Such orientation leads to increased filament strength, along with modification of<br />
other filament properties, including the filament denier or thickness.<br />
Web Forming : The filaments are deposited in a random manner on a<br />
moving, porous forming belt. A vacuum under the belt assists in forming the<br />
filament web on the forming belt and in removing the air used in the extrusion /<br />
orientation operation. In some processes, an electrostatic charge is placed on the<br />
filament bundle to ensure spreading and separation of individual filaments. In<br />
other processes, deflector plates are used to lay down the filament sheet in a<br />
random manner on the forming belt.<br />
Bonding : The continuous filament web is delivered to a bonding section,<br />
where one of several bonding methods can be used to bond the loose filaments into<br />
a strong, integrated fabric.<br />
Slitting / Winding : The bonded fabric encounters a slitting section where<br />
the two edges are trimmed to eliminate the nonuniform, rough edge created during<br />
the manufacturing step. In some operations, the fabric may also be further slit into<br />
precise, smaller widths to provide finished rolls of precise dimension. Following<br />
slitting, the fabric is wound onto a larger roll, either a full width roll or a series of<br />
narrow slit rolls. From this point, the fabric rolls are ready for wrapping and<br />
shipping.<br />
Recommended Economic Size:<br />
The fiber fill project proposed to be set up in India will have a designed<br />
capacity of 2500 TPA (1.5 – 4 D @ 800 – 1000 mpm spinning speed)<br />
Under Indian operating conditions it is safer to assume machine efficiency<br />
factor of 75%, and therefore the production would be 1875 TPA.<br />
year.<br />
The plant would operate in three shifts, 24 hours and 300 working days in a<br />
347
Investment in Process Plant and Machinery.<br />
Appendix-5C (Contd…)<br />
The list of major equipments for the spunbond project is as given above and<br />
as per the indicative budgetary quotations , the investment in the process plant<br />
and machinery will be Rs 2.5 crores (FOB). Finer details on the Equipment<br />
listing, specification and the quotations need to be discussed with the technology<br />
supplier before the project is taken up. Taking into account the CIF value, the<br />
custom duties (Custom duty of 5%), inland transportation, erection and<br />
commissioning , the installed cost of process equipment would be Rs 2.625<br />
crores.<br />
348
Appendix-5C (Contd…)<br />
PROJECT COST AND PR<strong>OF</strong>ITABILITY PROJECTI<strong>ON</strong>S (IRR,<br />
PAYBACK PERIOD, BREAK-EVEN ETC.)<br />
Land<br />
The total requirement of land for this project keeping in mind the possible<br />
future expansion is around 2000 Sq. Mtrs.<br />
Based on the available information the cost of land is assumed at Rs 1200<br />
per square meter (including the developmental cost). Depending on the exact<br />
location of the project to be determined by the promoter, the land cost could be<br />
higher or lower. Hence the total cost of developed land will be Rs 0.24 crore (Rs<br />
24 lakhs).<br />
Buildings<br />
The building area comprising of main factory building, godowns, office, R<br />
& D labs/In-house Testing centre etc would be 1000 sq. mtrs. The cost of<br />
construction would again vary depending on the structure and the materials to be<br />
used. It has been assumed that the average cost of construction would be Rs 4500<br />
per sq mtr. Thus the total cost of building and other civil works would be around<br />
Rs 0.45 crores.<br />
Plant and Machinery<br />
Details of Plant and machinery as well as technology required for the<br />
project have been presented in earlier Section 5. The installed cost of plant and<br />
machinery would be Rs 2.65 crores. Apart from the main process equipments,<br />
the utilities required are Electricals, Piping, Water supply, compressors, fire<br />
fighting equipments etc. The provision on this count is taken as 5% of the cost of<br />
machinery which works out to Rs 0.13 crores.<br />
Miscellaneous Fixed Assets<br />
Under this head the items included are Furniture and fixtures, Office<br />
equipments, Air Conditioners etc and the provision made is around Rs 0.35 crore<br />
(Rs 35 lakhs) inclusive of the Testing and R & D facilities.<br />
349
Project Engineering and Consulting<br />
Appendix-5C (Contd…)<br />
Under this head the items included are the fees and expenses on account of<br />
Architect fees, project engineering and management (both local and overseas ),<br />
detailed project reports etc.<br />
Preliminary & Preoperative Expenses<br />
The items included under this head are company formation expenses, public<br />
issue expenses (if any), interest during construction, and pre production expenses<br />
during the implementation phase etc.<br />
Contingency Expenses<br />
Depending on the gestation period and further detailing of the project cost<br />
by the promoter, the contingency provision has been made at the rate of 10%.<br />
Margin Money for Working capital<br />
The margin money for working capital forming part of the total project cost<br />
would be Rs 35 lakhs.<br />
Total Project Cost<br />
The total project cost as given in Exhibit 1 would be Rs 4.79 crores.<br />
SALES, PR<strong>OF</strong>ITABILITY AND SENSITIVITY ANALYSIS<br />
Sales Realisation and Turnover<br />
As per the details available from the Technology and Equipment suppliers<br />
the economic size of a plant is 2500 TPA.<br />
Under the Indian conditions, it is assumed that the machine would operate<br />
at an efficiency level of 75%. Hence the production from the plant would be 1875<br />
TPA.<br />
year.<br />
The plant would operate on Three-shift basis and 300 workings days in a<br />
The capacity utilisation for the 1 st year is assumed at 50% and thereafter for<br />
the 2 nd , 3 rd and 4 th year onwards 60%, 75% and 90% respectively.<br />
350
Appendix-5C (Contd…)<br />
The average selling price of the end product would be Rs 65 per kg . (net of<br />
excise duties, sales tax and other incidental expenses)<br />
The details of projected sales turnover as projected are given in Exhibit 2.<br />
Cost of Production:<br />
Major Raw materials<br />
• The main raw materials used and the corresponding prevailing prices as<br />
an indicator are as follows:<br />
Raw Material Prices<br />
(inclusive of all duties)<br />
Polyester Chips<br />
(PET chips)<br />
Rs 30.00/kg<br />
• The requirement of PET chips would be 2310 tonnes per annum,<br />
accounting for a process waste of 5%.<br />
Conversion Cost<br />
• The conversion cost will include the cost of power, water, chemicals and<br />
additives, consumables etc., which is assumed at 15% of the cost of raw<br />
material.<br />
Manpower, Salaries and Wages<br />
• The manpower requirements and the salary structure is given in Exhibit 3.<br />
• The total manpower requirement comprising the managerial cadre of<br />
supervisors, machine operators and helpers would be 46 persons.<br />
Factory and Overhead Expenses<br />
• The items covered under this head are establishment expenses, repairs and<br />
maintenance, stationery, travel expenses, packaging expenses etc.<br />
Marketing and Promotional Expenses<br />
• The promotion of technical textiles will call for expenditure on this count<br />
and a provision of 2.5% of the annual sales has been made uniformly over<br />
the years.<br />
351
Interest and Depreciation<br />
Appendix-5C (Contd…)<br />
• The prevailing interest rate for long term and short term borrowed funds is<br />
assumed at 13 % per annum .<br />
• The repayment of loans has been assumed for 5 years with a moratorium<br />
period of one year.<br />
• The depreciation rates have been worked out as per Company’s act (SLM)<br />
and Income-Tax Ready Reckoner (WDV).<br />
• The current corporate tax rate is assumed at 35 % and the surcharge is<br />
assumed at 2.5% per annum.<br />
• Profitability statement is given in Exhibit 4.<br />
352
EXHIBIT 1<br />
Appendix-5C (Contd…)<br />
PROJECT COST<br />
(LAND, BUILDINGS, PROCESS PLANT & MACHINERY, UTILITIES &<br />
O<strong>THE</strong>R ASSETS)<br />
1<br />
2<br />
Land<br />
Area: 2000 Sq Mtrs<br />
Rate: (Rs.1200 /Sq. Mtr)<br />
Buildings<br />
Plant Area, Office, Godown, Lab, Service Area etc.)<br />
Built-up Area : 1000 Sq. Mtrs<br />
Avg Rate : Rs. 4500 /Sq. Mtrs<br />
Project Cost<br />
(Rs. Crore)<br />
0.24<br />
0.45<br />
3 Process Plant & Equipment 2.65<br />
4 Utility & Other equipments (5%)<br />
(Power, Water, Compressor, Humidity Control,<br />
Fire Fighting, Material Handling etc.)<br />
0.13<br />
5<br />
Misc. Fixed Assets<br />
(Furniture & Fixtures, Office Equipment, Testing Lab etc.)<br />
6 Project Engineering & Consultancy charges (2.5%)<br />
7<br />
Preliminary & Pre-operative Expenses (12%)<br />
(Company Formation, Interest during construction,<br />
pre-production expenses, etc.)<br />
8 Contingency (10 %)<br />
9 Total<br />
10 Margin Money for Working Capital<br />
11 Total Project Cost<br />
0.35<br />
0.07<br />
0.30<br />
0.25<br />
4.44<br />
0.35<br />
4.79<br />
353
ITEM<br />
EXHIBIT 2<br />
ESTIMATI<strong>ON</strong> <strong>OF</strong> SALES REVENUE<br />
YEAR <strong>OF</strong> OPERATI<strong>ON</strong><br />
Appendix-5C (Contd…)<br />
I II III IV V VI VII VIII IX X<br />
Average Production per hour (kg) 350 350 350 350 350 350 350 350 350 350<br />
75% efficiency 263 263 263 263 263 263 263 263 263 263<br />
Capacity Utilisation 50% 60% 75% 90% 90% 90% 90% 90% 90% 90%<br />
Actual Production per hour 175 210 263 315 315 315 315 315 315 315<br />
Production per day (kg) 4200 5040 6300 7560 7560 7560 7560 7560 7560 7560<br />
Production for 300 working days (kg) 1260000 1512000 1890000 2268000 2268000 2268000 2268000 2268000 2268000 2268000<br />
Selling Price (Rs/Kg) 65.00 65.00 65.00 65.00 65.00 65.00 65.00 65.00 65.00 65.00<br />
Sales Revenue (Rs. Cr) 8.19 9.83 12.29 14.74 14.74 14.74 14.74 14.74 14.74 14.74<br />
Value Loss ( 2% ) 0.16 0.20 0.25 0.29 0.29 0.29 0.29 0.29 0.29 0.29<br />
Net Sales Revenue (Rs. Cr) 8.03 9.63 12.04 14.45 14.45 14.45 14.45 14.45 14.45 14.45<br />
354
EXHIBIT 3<br />
MANPOWER REQUIREMENTS<br />
Nos Monthly<br />
Appendix-5C (Contd…)<br />
Total<br />
Mon. Annual<br />
General Manager 1 30000 30000 360000<br />
Production Manager 1 15000 15000 180000<br />
Machine Operator 9 4000 36000 432000<br />
Machine Helper (Semi Skilled) 12 3000 36000 432000<br />
R&D, Testing 5 10000 50000 600000<br />
Marketing & Sales 6 12000 72000 864000<br />
Clerical Staff 5 4000 20000 240000<br />
Other Staff 5 2500 12500 150000<br />
Maintenance (Mech. & Elec.) 2 4000 8000 96000<br />
TOTAL 46 279500 3354000<br />
Fringe Benefits (40 % of the above) 1341600<br />
Total Wage Bill (Annual) Rs. lakhs: 4695600.00<br />
Salary + Other Benefits =<br />
Total Wage Bill (Annual) Rs. Cr.:<br />
0.47<br />
355
Revenue<br />
EXHIBIT 4<br />
Appendix-5C (Contd…)<br />
PR<strong>OF</strong>ITABILITY STATEMENT AND COMPUTATI<strong>ON</strong> <strong>OF</strong> TAX<br />
ACCOUNT HEAD I II III IV V VI VII VIII IX<br />
(Rs. Crore)<br />
X<br />
Net Sales Turnover 8.03 9.63 12.04 14.45 14.45 14.45 14.45 14.45 14.45 14.45<br />
Total Revenue 8.03 9.63 12.04 14.45 14.45 14.45 14.45 14.45 14.45 14.45<br />
Expenses<br />
Raw Materials 3.97 4.76 5.95 7.14 7.14 7.14 7.14 7.14 7.14 7.14<br />
Salaries & wages 0.47 0.49 0.52 0.54 0.57 0.60 0.63 0.66 0.69 0.73<br />
Power, Fuel, Stores & Other Expenses<br />
(including packing materials) 0.60 0.71 0.89 1.07 1.07 1.07 1.07 1.07 1.07 1.07<br />
Marketing & Promotional Expenses 0.20 0.24 0.30 0.36 0.36 0.36 0.36 0.36 0.36 0.36<br />
Factory & Office Overheads 0.80 0.80 0.80 0.80 0.80 0.80 0.80 0.80 0.80 0.80<br />
Interest on S.T. Loans 0.16 0.19 0.24 0.29 0.29 0.29 0.29 0.29 0.29 0.29<br />
Cost of Sales 6.20 7.20 8.71 10.21 10.24 10.27 10.30 10.33 10.36 10.39<br />
Depreciation (St.Line) 0.22 0.22 0.22 0.22 0.22 0.22 0.22 0.22 0.22 0.22<br />
Amort. of Expenses 0.19 0.19 0.19 0.19 0.19 0.19 0.00 0.00 0.00 0.00<br />
Interest on L.T Loan 2.38 2.14 1.66 1.18 0.70 0.23 0.00 0.00 0.00 0.00<br />
Profit Before Tax -0.96 -0.12 1.26 2.65 3.10 3.54 3.93 3.90 3.87 3.83<br />
Tax 0.08 0.59 1.40 2.22 2.18 8.31 9.39 9.83 10.16 10.40<br />
Profit After Tax 0.68 5.01 11.97 18.92 20.90 16.19 16.44 15.95 15.57 15.27<br />
356
EXHIBIT 4 (Contd..)<br />
Appendix-5C (Contd…)<br />
PR<strong>OF</strong>ITABILITY STATEMENT AND COMPUTATI<strong>ON</strong> <strong>OF</strong> TAX<br />
ACCOUNT HEAD I II III IV V VI VII VIII IX<br />
(Rs. Crore)<br />
X<br />
Dividend 0.00 0.00 2.52 2.52 2.52 5.04 5.04 5.04 5.04 5.04<br />
Profits For Appropriation 0.68 5.01 9.45 16.40 18.38 11.15 11.41 10.92 10.53 10.24<br />
COMPUTATI<strong>ON</strong> <strong>OF</strong> TAX<br />
Profit after interest before depreciation 7.19 12.03 19.80 27.57 29.51 30.94 32.26 32.21 32.16 32.10<br />
Depr.(WDV) to be claimed 29.20 44.04 48.62 41.37 23.29 7.18 5.44 4.13 3.14 2.39<br />
Depreciation claimed 7.19 12.03 19.80 27.57 23.29 7.18 5.44 4.13 3.14 2.39<br />
Depr. carried forward 22.02 32.01 28.82 13.80 0.00 0.00 0.00 0.00 0.00 0.00<br />
Taxable Profit 0.00 0.00 0.00 0.00 6.22 23.75 26.82 28.08 29.02 29.71<br />
Profit Before Tax (Book) 0.75 5.60 13.37 21.14 23.08 24.50 25.83 25.78 25.73 25.67<br />
Minimum Alternate Tax 0.08 0.59 1.40 2.22 0.00 0.00 0.00 0.00 0.00 0.00<br />
Tax (Actual) 0.00 0.00 0.00 0.00 2.18 8.31 9.39 9.83 10.16 10.40<br />
Tax Provision 0.08 0.59 1.40 2.22 2.18 8.31 9.39 9.83 10.16 10.40<br />
357
EXHIBIT 5<br />
SENSITIVITY ANALYSIS<br />
Items Profit after Tax (PAT)<br />
Rs. Cr.<br />
(assumed at 90 %<br />
capacity)<br />
Break<br />
Even<br />
(%)<br />
Appendix-5C (Contd…)<br />
Internal Rate of<br />
Return (IRR)<br />
(%)<br />
Payback<br />
Period<br />
(Years)<br />
NORMAL VALUES 18.92 43.29 15.99 5.17<br />
Debt Equity Ratios<br />
(a) 2:1 18.43 44.75 16.14 5.11<br />
(b) 1:1 19.65 41.09 15.74 5.28<br />
Increase in Project Cost<br />
by 10 %<br />
Decrease in Selling Price By<br />
10%<br />
Increase in Selling Price<br />
by 10%<br />
Decrease in Raw<br />
Material Prices by 10%<br />
17.88 46.41 14.4 5.61<br />
10.85 56.73 11.13 6.7<br />
25.35 35.19 20.45 4.35<br />
25.58 37.69 18.91 4.58<br />
358
INDUSTRIAL FILTER FABRICS<br />
Appendix-5C (Contd…)<br />
SECTI<strong>ON</strong> I: PRODUCT BRIEF, APPLICATI<strong>ON</strong> AREAS & MARKET<br />
POTENTIAL<br />
1.1 PRODUCT BRIEF<br />
1. Fabric filters are used for various filtration purposes in both dry & wet<br />
applications.<br />
2. Textile materials especially woven & non-woven fabrics are particularly<br />
suitable for filtration because of their complicated structures and considerable<br />
thickness.<br />
3. Textile fabrics are a 3-D network of fibers enclosing small pockets of void<br />
volume. Dust particles have to follow a "tortuous" path around textile fibers.<br />
4. Due to their structures, textile fabrics have high filtration efficiencies. Textile<br />
materials do not restrict the flow of the fluid too much, yet they efficiently stop<br />
the particles.<br />
5. The filter fabric should possess greatest possible collection efficiency, low<br />
pressure drop, small filtering area, low penetration of the dust in the fabric and<br />
low cost.<br />
6. Also it must have good abrasion resistance, chemical resistance, tensile<br />
strength and permeability.<br />
7. The conventional filter cloth is made up of cotton, wool, viscose and polyamide<br />
etc. but these fibers have some deficiencies to match the end use requirement.<br />
8. To overcome the disadvantages polypropylene fibers can be used due to their<br />
resistance to chemical breakdown and higher bulk with lightweight.<br />
9. Higher performance requirements for filtration systems are being driven by<br />
industry needs for improved productivity and by stricter environmental<br />
requirements.<br />
359
1.2 MAJOR APPLICATI<strong>ON</strong>S<br />
Appendix-5C (Contd…)<br />
1. Chemical industry is the largest consumer of the filter fabrics, involving main<br />
application of solid-liquid separation.<br />
2. The Fabric filters are used for various filtration purposes, which include dust<br />
filtration, the purification of gases, the removal of suspended materials from<br />
liquids and also for gas and liquid chromatography.<br />
3. Major filtration segments<br />
Aerospace Chemical Process Industry<br />
• HVAC • Chemicals<br />
• Fuel • Paints<br />
• Hydraulic • Pneumatic Air<br />
• Water & Wastewater<br />
Cigarettes Coal<br />
• Tips • Washing<br />
Coalescing Dust Collection<br />
• Aerospace • Baghouse Filters<br />
• Automotive • Pleated Cartridges<br />
Coolant Fluid Power (Hydraulics)<br />
• Aerospace • Mobile<br />
• Automotive • Stationary<br />
• Aluminum Cans • Vents<br />
Food & Beverage<br />
• Beer, Wine and Liquor<br />
• Cheese Whey<br />
• Coffee & Tea<br />
• Cooking Oils<br />
• Flour & Sugar Sifting<br />
• Make-up Water<br />
1.3 GLOBAL & INDIAN MARKET POTENTIAL:<br />
1. Industrial survey reports a 20% growth rate in the consumption of the filter<br />
fabrics worldwide.<br />
2. The market for filters in the US will grow 4.7 percent annually through 2007.<br />
Gains will be driven by environmental laws, manufacturers’ interest in water<br />
360
Appendix-5C (Contd…)<br />
recycling, and the proliferation of newer products such as motor vehicle cabin<br />
air filters. Engine filters will remain dominant while fluid filters grow the<br />
fastest. The consumer market will post the strongest gains.<br />
3. The world market for filtration media will rise from $17 million in 1998, to<br />
over $75 billion in 2020, according to McIlvaine's report, World Filter Media<br />
Market in 2020.<br />
4. The world market for equipment and bags will exceed $4.5 billion by 2003.<br />
5. China will be the largest purchaser in the cement and metals segment while the<br />
U.S. will be the leader in power plant fabric filter purchases.<br />
6. Around 70% of the market volume is accounted by unspun fiber tow, used to<br />
form the main filter of a cigarette<br />
7. Radical changes in filtration media shape and performance are changing the<br />
approach to traditional applications and expanding the market at the expense of<br />
precipitators (cement and power).<br />
8. Health concerns over submicron particle inhalation will add momentum to the<br />
market and require the use of higher efficiency media.<br />
9. The modular small collector market (less than 2,000 cfm) is a sizable and<br />
profitable market segment.<br />
10. The largest growth will come in the high temperature segment (greater than<br />
350° F).<br />
11. The market for integrated systems which remove both particles and gases (such<br />
as S02 and HCl) will grow at a double digit rate.<br />
1.4 MAJOR MANUFACTURERS IN INDIA<br />
1 Arunodaya Textiles, Mumbai<br />
2 Garuda Nonwovens, Mumbai<br />
3 Giri Textiles Pvt Ltd, Bangalore<br />
4 Khosla Profil Pvt. Ltd., Mumbai<br />
5 Krishna Corporates, Mumbai<br />
6 N K Filter Fabrics Pvt Ltd, Mumbai<br />
7 Pure Filter Systems, Pune<br />
8 Siddhi Filter Media, Mumbai<br />
9 Sri Ram Filteration & Engg. Co., Mumbai<br />
361
10 Sky Industrial Traders, Pune<br />
11 Skytouch Tapes Pvt Ltd, Mumbai<br />
12 Stella Enterprises, Pune<br />
13 Tirupati Polymers, Secunderabad<br />
14 Ucco-Mech Filters Pvt. Ltd., Pune<br />
15 Varun Impex , Mumbai<br />
1.5 PLANT DETAILS<br />
Woven & Nonwoven fabrics are used, depending on the end product.<br />
Economic Capacity:<br />
(Considering woven<br />
fabrics only)<br />
Plant and machinery<br />
Cost<br />
Appendix-5C (Contd…)<br />
Winding Machine: 2<br />
Warping Machine: 1<br />
Shuttleless looms : 12<br />
Stenter: 1<br />
Calendering Machine: 1<br />
Working width : 2 mts.<br />
Rpm: 400 rpm<br />
Others: Sectional warping/ yarn preparatory machines,<br />
Calendering & Heat setting<br />
Rs. 4.0 Cr.<br />
1.6 Global Technology and Equipment Suppliers<br />
Major Machinery<br />
suppliers<br />
Weaving Machinery<br />
1. Sultex, Switzerland<br />
2. Lindauer Dornier, Germany<br />
3. Promatech, Italy<br />
4. Texo, Sweden<br />
5. Jaeger, Germany<br />
6. Picanol, Belgium<br />
7. Benninger, Switzerland<br />
Processing Machinery<br />
1. Gayatri, India<br />
2. Kusters-Calico, Germany-India<br />
3. Ramisch Guarneri, Italy<br />
4. TEPA, Spain<br />
5. Harish-Textmac, India<br />
6. Krantz, Germany<br />
7. Devrekha, India<br />
8. Dhall, India<br />
362
1.7 REGULATORY FRAMEWORK & POLICY ISSUES<br />
Appendix-5C (Contd…)<br />
Because of the growing awareness in ecology all the countries are set<br />
setting up laws to minimise the pollution due to chemicals. Thus chemical industry<br />
is the largest consumer of the filter fabrics. It involves various levels of filtration<br />
and their requirements vary as per the nature of the chemicals and filtrates. The<br />
overall market for filters is growing and will be accelerated by the strict Ecoregulations<br />
act. The new Environmental Protection Agency (EPA) ambient<br />
standards have been released.<br />
Particulate is a much bigger problem than EPA or the polluting utilities<br />
realize. The reason is that no one knows for sure how much particulate matter is<br />
being emitted because no utility has installed continuous mass monitors. The EPA<br />
strategy is to reduce fine particulate matter by reducing NOx and sulfur. Without<br />
new standards, SO2 emissions from utilities would be 9.7 million tons a year and<br />
with a new cap for sulfur, that would be reduced to 5.2 million tons. The new<br />
ambient standards for ozone and fine particulate would also result in NOx being<br />
lowered by an additional 500,000 tons per year.<br />
1.8 TESTING REQUIREMENT & FACILITIES<br />
Sr. No. Property Facility available<br />
1. Effective aperture width In standard textile testing laboratories<br />
across the country are equipped with all<br />
relevant testing facilities for the filtration<br />
products.<br />
2. Mass Per Unit Area -do-<br />
3. Thickness -do-<br />
4. Breaking<br />
strength/elongation<br />
-do-<br />
5. Index Puncture Resistance -do-<br />
6. Air Permeability -do-<br />
7. Particulate air filtration<br />
efficiency<br />
-do-<br />
8. Thermal resistance -do-<br />
9. Test for particle filtration Specialized test not available in India<br />
10. Filter media test -do-<br />
11. Bubble point and mean flow<br />
pore test<br />
-do-<br />
12. Arrestance test for filters -do-<br />
363
Appendix-5C (Contd…)<br />
SECTI<strong>ON</strong> II: FILTER FABRIC MANUFACTURING MACHINERY,<br />
TECHNOLOGY AND EQUIPMENTS SUPPLIERS<br />
The technology and the equipment for the filter fabric manufacturing is<br />
warping equipment, weaving equipment, calendering & heat setting. These<br />
machines are supplied by globally recognised player, namely Sultex, Dornier,<br />
Picanol, Harish-Textmac, Krantz etc. The approximate cost for the set up is 4.0 Cr.<br />
SECTI<strong>ON</strong> III: PROJECT COST AND PR<strong>OF</strong>ITABILITY PROJECTI<strong>ON</strong>S<br />
3.1 LAND<br />
The total requirement of land for this project is around 2000 Sq. Mtrs. Based<br />
on the available information the cost of land is assumed at Rs 1200 per square<br />
meter (including the developmental cost). Depending on the exact location of the<br />
project to be determined by the promoter, the land cost could be higher or lower.<br />
Hence the total cost of developed land will be Rs 0.24 crore (Rs 24 lakhs).<br />
3.2 BUILDINGS<br />
The building area comprising of main factory building, godowns, office, R<br />
& D labs/In-house Testing centre etc would be 1000 sq. mtrs. The cost of<br />
construction would again vary depending on the structure and the materials to be<br />
used. It has been assumed that the average cost of construction would be Rs 4500<br />
per sq mtr. Thus the total cost of building and other civil works would be around<br />
Rs 0.45 crores (Rs 45 lakhs).<br />
3.3 PLANT AND MACHINERY<br />
Details of Plant and machinery as well as technology required for the<br />
project have been given in previous section. The installed cost of plant and<br />
machinery would be Rs 4.0 crores. Apart from the main process equipment, the<br />
utilities required are Electricals, Piping, Water supply, compressors, fire fighting<br />
equipments etc. The provision on this count is taken as 5% of the cost of<br />
machinery which works out to Rs 0.44 crores.<br />
3.4 MISCELLANEOUS FIXED ASSETS<br />
Under this head the items included are Furniture and fixtures, Office<br />
equipments, Air Conditioners etc. and the provision made is around Rs 0.30 crore<br />
(Rs 30 lakhs) inclusive of the Testing and R & D facilities.<br />
364
3.5 PROJECT ENGINEERING AND C<strong>ON</strong>SULTING<br />
Appendix-5C (Contd…)<br />
Under this head the items included are the fees and expenses on account of<br />
Architect fees, project engineering and management (both local and overseas),<br />
detailed project reports etc.<br />
3.6 PRELIMINARY & PREOPERATIVE EXPENSES<br />
The items included under this head are company formation expenses, public<br />
issue expenses (if any), interest during construction, and pre production expenses<br />
during the implementation phase etc.<br />
3.7 C<strong>ON</strong>TINGENCY EXPENSES<br />
Depending on the gestation period and further detailing of the project cost<br />
by the promoter, the contingency provision has been made at the rate of 10%.<br />
3.8 MARGIN M<strong>ON</strong>EY FOR WORKING CAPITAL<br />
The margin money for working capital forming part of the total project cost<br />
would be Rs 0.35 crores.<br />
3.9 TOTAL PROJECT COST<br />
The total project cost as given in Exhibit 1 would be Rs 6.21 crores. The<br />
manpower details including cost of wages are shown in Exhibit 3. Exhibit 2 and 4<br />
shows the estimation of sales revenue and profitability statement respectively.<br />
365
Appendix-5C (Contd…)<br />
366
EXHIBIT 1<br />
Appendix-5C (Contd…)<br />
PROJECT COST<br />
(LAND, BUILDINGS, PROCESS PLANT & MACHINERY, UTILITIES &<br />
O<strong>THE</strong>R ASSETS)<br />
1<br />
2<br />
Land<br />
Area: 2000 Sq Mtrs<br />
Rate: (Rs.1200 /Sq. Mtr)<br />
Buildings<br />
Plant Area, Office, Godown, Lab, Service Area etc.)<br />
Built-up Area : 1000 Sq. Mtrs<br />
Avg Rate : Rs. 4500 /Sq. Mtrs<br />
3 Process Plant & Equipment<br />
4<br />
5<br />
Utility & Other equipments (5%)<br />
(Power, Water, Compressor, Humidity Control,<br />
Fire Fighting, Material Handling etc.)<br />
Misc. Fixed Assets<br />
(Furniture & Fixtures, Office Equipment, Testing Lab etc.)<br />
6 Project Engineering & Consultancy charges (2.5%)<br />
7<br />
Preliminary & Pre-operative Expenses (12%)<br />
(Company Formation, Interest during construction,<br />
pre-production expenses, etc.)<br />
8 Contingency (10 %)<br />
9 Total<br />
10 Margin Money for Working Capital<br />
11 Total Project Cost<br />
Project Cost<br />
(Rs. Crore)<br />
0.24<br />
0.45<br />
4.00<br />
0.20<br />
0.35<br />
0.07<br />
0.30<br />
0.25<br />
5.86<br />
0.35<br />
6.21<br />
367
ITEM<br />
EXHIBIT 2<br />
ESTIMATI<strong>ON</strong> <strong>OF</strong> SALES REVENUE<br />
YEAR <strong>OF</strong> OPERATI<strong>ON</strong><br />
Appendix-5C (Contd…)<br />
I II III IV V VI VII VIII IX X<br />
Average Production per hour (sq. mtr) 900 900 900 900 900 900 900 900 900 900<br />
75% efficiency 675 675 675 675 675 675 675 675 675 675<br />
Capacity Utilisation 50% 60% 75% 90% 90% 90% 90% 90% 90% 90%<br />
Actual Production per hour 450 540 675 810 810 810 810 810 810 810<br />
Production per day (sq. mtr) 10800 12960 16200 19440 19440 19440 19440 19440 19440 19440<br />
(Rs. Crore)<br />
Production for 300 working days (sq.<br />
mtr) 3240000 3888000 4860000 5832000 5832000 5832000 5832000 5832000 5832000 5832000<br />
Selling Price (Rs/sq. mtr) 18.00 18.00 18.00 18.00 18.00 18.00 18.00 18.00 18.00 18.00<br />
Sales Revenue (Rs. Cr) 5.83 7.00 8.75 10.50 10.50 10.50 10.50 10.50 10.50 10.50<br />
Value Loss ( 2% ) 0.12 0.14 0.17 0.21 0.21 0.21 0.21 0.21 0.21 0.21<br />
Net Sales Revenue (Rs. Cr) 5.72 6.86 8.57 10.29 10.29 10.29 10.29 10.29 10.29 10.29<br />
368
EXHIBIT 3<br />
MANPOWER REQUIREMENTS<br />
Nos Monthly<br />
Appendix-5C (Contd…)<br />
Total<br />
Mon. Annual<br />
General Manager 1 30000 30000 360000<br />
Production Manager 1 15000 15000 180000<br />
Machine Operator 4 4000 16000 192000<br />
Machine Helper (Semi Skilled) 8 3000 24000 288000<br />
R&D, Testing 3 10000 30000 360000<br />
Marketing & Sales 3 12000 36000 432000<br />
Clerical Staff 3 4000 12000 144000<br />
Other Staff 2 2500 5000 60000<br />
Maintenance (Mech. & Elec.) 2 4000 8000 96000<br />
TOTAL 27 176000 2112000<br />
Fringe Benefits (40 % of the above) 844800<br />
Total Wage Bill (Annual) Rs. lakhs: 2956800.00<br />
Salary + Other Benefits =<br />
Total Wage Bill (Annual) Rs. Cr.:<br />
0.30<br />
369
Revenue<br />
EXHIBIT 4<br />
Appendix-5C (Contd…)<br />
PR<strong>OF</strong>ITABILITY STATEMENT AND COMPUTATI<strong>ON</strong> <strong>OF</strong> TAX<br />
ACCOUNT HEAD I II III IV V VI VII VIII IX<br />
(Rs. Crore)<br />
X<br />
Net Sales Turnover 5.72 6.86 8.57 10.29 10.29 10.29 10.29 10.29 10.29 10.29<br />
Total Revenue 5.72 6.86 8.57 10.29 10.29 10.29 10.29 10.29 10.29 10.29<br />
Expenses<br />
Raw Materials 2.92 3.50 4.37 5.25 5.25 5.25 5.25 5.25 5.25 5.25<br />
Salaries & wages 0.30 0.31 0.33 0.34 0.36 0.38 0.40 0.42 0.44 0.46<br />
Power, Fuel, Stores & Other Expenses<br />
(including packing materials)<br />
0.44 0.52 0.66 0.79 0.79 0.79 0.79 0.79 0.79 0.79<br />
Marketing & Promotional Expenses 0.14 0.17 0.21 0.26 0.26 0.26 0.26 0.26 0.26 0.26<br />
Factory & Office Overheads 0.80 0.80 0.80 0.80 0.80 0.80 0.80 0.80 0.80 0.80<br />
Interest on S.T. Loans 0.11 0.14 0.17 0.21 0.21 0.21 0.21 0.21 0.21 0.21<br />
Cost of Sales 4.71 5.44 6.54 7.64 7.66 7.68 7.70 7.72 7.74 7.76<br />
Depreciation (St.Line) 0.22 0.22 0.22 0.22 0.22 0.22 0.22 0.22 0.22 0.22<br />
Amort. of Expenses 0.19 0.19 0.19 0.19 0.19 0.19 0.00 0.00 0.00 0.00<br />
Interest on L.T Loan 2.38 2.14 1.66 1.18 0.70 0.23 0.00 0.00 0.00 0.00<br />
Profit Before Tax -1.78 -1.13 -0.04 1.06 1.52 1.97 2.37 2.35 2.33 2.31<br />
370
WOVEN GEOTEXTILES PROJECT<br />
1. PRODUCTS AND TECHNOLOGY<br />
Appendix-5C (Contd…)<br />
Woven Geotextiles form the major component of all geotextile products.<br />
• The manufacturing process involves weaving of high tensile strength and<br />
low elongation yarns into fabrics<br />
• Yarns of Polyester, Polypropylene, and nylon in multifilaments<br />
/monofilament/tape forms are widely used in weaving.<br />
• Filament yarns of linear density 1100 dtex and 2200 dtex are predominantly<br />
used in plain weave constructions for geotextiles<br />
• Wide width looms are specifically used for producing geotextiles.<br />
• Triaxial and leno constructions are also used for specific applications<br />
2. MAJOR APPLICATI<strong>ON</strong>S<br />
Woven geotextiles are mainly used for<br />
• Reinforcement of Unpaved Roadways, Paved Roadways, etc<br />
• Separation applications in, Unpaved Roadways, Paved Roadways, Sediment<br />
Control, etc.<br />
• As components in geo-composites<br />
3. MARKET POTENTIAL<br />
A. GLOBAL MARKET POTENTIAL FOR GEOSYN<strong>THE</strong>TICS*:<br />
Quantity<br />
(‘000 MT)<br />
Value<br />
($ MN.)<br />
2001 264 766<br />
2002 272 789<br />
2003 286 832<br />
2004 302 878<br />
* Ref – DRA report (Technical textiles and Industrial Nonwovens: world market short term forecasts to<br />
2004)<br />
Note : According to estimates by DRA, In the year 2004, 131, 000 MT of Goetextiles would be woven<br />
products, which is approximately 43.3 % of total geotextile consumption.<br />
371
B. INDIAN MARKET POTENTIAL FOR GEOTEXTILES* :<br />
ROAD, RAILWAYS AND PAVEMENT OVERLAY PROJECTS<br />
Projects<br />
Infrastructure<br />
Investments<br />
Planned<br />
Rs. Cr.<br />
( upto 2007-08)<br />
Appendix-5C (Contd…)<br />
Market Potential<br />
(2003-04 to 2007-08)<br />
Quantity<br />
(tonnes)<br />
Roads 144404 216650<br />
(1083 mn sq<br />
mt)<br />
Railways 39457 29600<br />
(74 mn sq mt)<br />
Paved Road Network 17500 26250<br />
(131 mn sq mt)<br />
Grand Total<br />
(Road+Railway+Pave<br />
ment Overlay)<br />
(2003-04 to 2007-08)<br />
* Ref – TECS Phase –II report<br />
201361 272500<br />
(2.73 lac<br />
tonnes)<br />
(1288 mn sq<br />
mt)<br />
Value ( @ 3%)<br />
(Rs. Cr.)<br />
4333<br />
1184<br />
525<br />
6042<br />
Following international trends it may be estimated that approximately 40 % of<br />
market potential would be for woven geotextiles, which would be Rs.2416.8<br />
crores.<br />
4. MAJOR MANUFACTURERS<br />
• Garware wall ropes Ltd.<br />
• Kusumgar corporates Ltd.<br />
• Shakti polyweave ltd.<br />
• H.L.Textiles, Ltd.<br />
• Urja products pvt. Ltd.<br />
372
5. DETAILS <strong>OF</strong> PLANT/MACHINARY<br />
Major Machinery<br />
suppliers<br />
1. Sultex, Switzerland<br />
2. Lindauer Dornier, Germany<br />
3. Promatech, Italy<br />
4. Texo, Sweden<br />
5. Jaeger, Germany<br />
6. Picanol, Belgium<br />
7. Benninger, Switzerland<br />
Economic Capacity: Projectile looms : 8<br />
Fabric output : 73,000 mts p.a.<br />
Working width : 6 mts.,<br />
Rpm: 130 rpm,<br />
Weft insertion rate : 1200 m /min<br />
Others: Sectional warping/ yarn<br />
preparatory machines<br />
Plant and machinery<br />
Cost<br />
Rs. 20 Cr.<br />
Appendix-5C (Contd…)<br />
6. PROJECT COSTS AND PR<strong>OF</strong>ITABILITY PROJECTI<strong>ON</strong>S :<br />
Land<br />
The total requirement of land for this project is around 2000 Sq. Mtrs.<br />
Assuming a land cost of Rs 1200 per square meter approximate lad cost would be<br />
Rs. 0.24 crores.<br />
Buildings<br />
The building area comprising of main factory building, godowns, office, R<br />
& D labs / Inhouse Testing centre etc would be 1200 sq. mtrs. Assuming a<br />
construction cost of Rs. 4500 per sq.mts. total cost of building and other civil<br />
works would be around Rs 0.54 crores.<br />
Plant and Machinery<br />
Installed cost of Plant and machinery as specified in earlier Section would<br />
be Rs 20 crores. Apart from the main process equipments the utilities required are<br />
Electricals, Piping, Power, Water supply, compressors, fire fighting equipments,<br />
etc. The provision on this count is taken as 5 % of the cost of machinery which<br />
works out to Rs 1.0 crores.<br />
373
Miscellaneous Fixed Assets<br />
Appendix-5C (Contd…)<br />
Investment towards Furnitures, Office equipments, Air Conditioners,<br />
minimum Testing facilities would be around Rs 0.35 crores.<br />
Project Engineering and Consulting<br />
Under this head the items included are the fees and expenses on account of<br />
Architect fees, project engineering and management, detailed project reports etc.<br />
As per standard practice provision of 2.5% of plant cost is made.<br />
Preliminary & Preoperative Expenses<br />
The items included under this head are company formation expenses, public<br />
issue expenses (if any ), interest during construction, pre production expenses<br />
during the implementation phase etc. As per standard practice provision of 12% of<br />
plant cost is made.<br />
Contingency Expenses<br />
Depending on the gestation period and further detailing of the project cost<br />
by the promoter, the contingency provision has been made at the rate of 10%.<br />
Margin Money for Working capital<br />
The margin money for working capital forming part of the total project cost would<br />
be Rs 0.30 crores .<br />
The Total Project Cost is estimated to be 27.83 crores<br />
7. REGULATORY MEASURES & POLICY ISSUES :<br />
In many of the developed countries Regulatory Framework have been laid<br />
out for many of the technical textile products. It has been one of the factors, which<br />
has spurred the growth of technical textiles/geotextiles worldwide. For example, in<br />
Germany regulations on geosynthetics has been formulated since 1970s<br />
(GEOSYN<strong>THE</strong>TICS IN ROAD C<strong>ON</strong>STRUCTI<strong>ON</strong> - GERMAN<br />
REGULATI<strong>ON</strong>S). In the Indian context a similar regulatory frame work needs to<br />
be evolved<br />
1. Ministry of Road Transport and Highways (MORTH) has to promote/create<br />
awareness about geosynthetics vis a vis traditional civil engineering techniques.<br />
374
Appendix-5C (Contd…)<br />
2. Indian Road Congress publication has following publications on geosynthetics<br />
• “SPECIFICATI<strong>ON</strong>S FOR ROAD AND BRIDGE WORKS” (Fourth<br />
Revision) under section 700 under Clause nos. 701, 702, 703 & 704.<br />
• Publication 59 (IRC: SP: 59 - 2002) “GUIDELINES FOR USE <strong>OF</strong><br />
GEOTEXTILES IN ROAD PAVEMENTS AND ASSOCIATED WORKS”<br />
.<br />
The specifications can be upgraded in consultation with concerned ministries,<br />
CRRI, Geotechnical/Civil/Textile engineers, industries and testing experts<br />
3. Funding of new ventures in Geotextiles may be provided by Government on<br />
the lines of TUFS<br />
4. Import of geotextiles should be restricted with additional duty to protect the<br />
Indian players for a fixed time frame.<br />
5. International collaborations with global players may be encouraged in the<br />
sector.<br />
6. Import duties on machinery required for geotextiles may lowered to<br />
competitive levels<br />
7. Import duties on raw materials like high strength yarns, not available in the<br />
country may be relaxed.<br />
8. Exemptions may be given on locally made raw material in terms of excise duty,<br />
octrio, sales tax, etc.<br />
9. The Inter-Ministerial Co-ordination Committee should continue its efforts to<br />
promote geosynthetics.<br />
10. Encourage export of the geotextile fabric by domestic players by suitable fiscal<br />
concessions.<br />
8. TESTING FACILITIES :<br />
Proper testing and evaluation of products are absolutely essential for<br />
geotextiles, for conformation to specifications (details in annexure 1). Especially<br />
in India at the nascent stage of development of Geotextiles, effective testing should<br />
support product development efforts by entrepreneurs. Some of the essential<br />
parameters for which the geotextiles has to be tested include:<br />
375
• Mass and thickness<br />
• Wide width tensile strength<br />
• Grab tensile strength<br />
• Trapezoid tear strength<br />
• Index puncture resistance<br />
• Apparent opening size<br />
• Water permeability<br />
• Resistance to UV exposure<br />
Currently geotextile testing facilities are available at<br />
• Central Road Research Institute (CRRI), New Delhi<br />
• SASMIRA, Mumbai<br />
• IIT, Mumbai,<br />
• IIT, NewDelhi,<br />
• BTRA, Mumbai<br />
• VJTI, Mumbai<br />
Appendix-5C (Contd…)<br />
However not all the facilities are available with all these bodies. In addition<br />
not all the laboratories are recognized by NHAI (National Highways Authority of<br />
India) for testing of Geotextiles.<br />
In view of above, It is recommended<br />
• To set up few laboratories with complete state of the art facilities for testing<br />
of Geotextiles<br />
• To recognize some of the laboratories as testing/certification centers for<br />
geotextiles.<br />
• Some of the laboratories may be encouraged to form collaborations with<br />
reputed overseas Geosynthetic testing houses and get accreditation of<br />
bodies like GAI (Geosynthetics Accreditation Institute)<br />
376
Serial<br />
No.<br />
Test Parameters<br />
ANNEXURE 1<br />
Test parameters/standards for Woven Geotextiles<br />
Specification<br />
Standard<br />
1. Geotextile Sampling Method EN963<br />
ASTM:D4354<br />
IS 14706 :1999<br />
2. Geotextile Identification EN30320<br />
3. Standard atmosphere<br />
Conditioning cabinet for<br />
Geotextiles<br />
4. Thickness ASTM: D5199-91<br />
BSEN: 964 -1<br />
ISO: 9863<br />
Appendix-5C (Contd…)<br />
Equipments Major Suppliers<br />
Approximate<br />
Cost<br />
RS.(lakhs)<br />
- - -<br />
- - -<br />
ISO 554 Conditioning cabinet BT technology, USA<br />
SDL, UK<br />
IS:13162 (Part 3)<br />
5. Mass Per Unit Area ASIM: D5261-92<br />
BSEN:965<br />
ISO:9864<br />
IS: 14716: 1999<br />
6. Wide-Width TENSILE TEST ASTM:D4595-86<br />
(1994)<br />
BSEN: 6906 (part 1)<br />
ISO: 10319<br />
IS:13162 (Part 5)<br />
Thickness gauge with<br />
variable load<br />
Weighing Balance<br />
Weight Box & Scissor<br />
Tensile Tester with<br />
Load Cells AND<br />
specialised GRIPS,<br />
BT technology, USA<br />
SDL, UK<br />
AIMIL, INDIA<br />
BT technology, USA<br />
SDL, UK<br />
AIMIL, INDIA<br />
BT technology, USA<br />
SDL, UK<br />
AIMIL, INDIA,<br />
INSTR<strong>ON</strong>,UK<br />
ZWICK,INDIA<br />
8.0<br />
1.5<br />
1.5<br />
20<br />
377
Serial<br />
No.<br />
Test Parameters<br />
Specification<br />
Standard<br />
7. Multi-axial Tension Test ASTM:D5671-94 Tensile Tester AND<br />
specialised<br />
attachments,<br />
8. Trapezoid Tear Strength ASTM: D4533-91<br />
IS: 14293 : 1995<br />
9. Tensile Test for Joints/Seams<br />
(by Wide Width Method)<br />
ISO10321:1992 (E)<br />
IS 15060 : 2001<br />
Equipments Major Suppliers<br />
Tensile Testing<br />
Machine & Trapezoidal<br />
Template<br />
Tensile Tester AND<br />
specialised GRIPS,<br />
10. Grab Tensile Test ASTM:D4632-91 Tensile Tester AND<br />
specialised GRIPS,<br />
11. Index puncture resistance ASTM D 4833 TENSILE TESTER<br />
AND<br />
ATTACHMENTS<br />
12. CBR puncture resistance ISO 12236 TENSILE TESTER<br />
AND<br />
ATTACHMENTS<br />
BT technology, USA<br />
SDL, UK<br />
AIMIL, INDIA,<br />
INSTR<strong>ON</strong>,UK<br />
ZWICK,INDIA<br />
BT technology, USA<br />
SDL, UK<br />
AIMIL, INDIA,<br />
INSTR<strong>ON</strong>,UK<br />
ZWICK,INDIA<br />
BT technology, USA<br />
SDL, UK<br />
AIMIL, INDIA,<br />
INSTR<strong>ON</strong>,UK<br />
ZWICK,INDIA<br />
BT technology, USA<br />
SDL, UK<br />
AIMIL, INDIA,<br />
INSTR<strong>ON</strong>,UK<br />
ZWICK,INDIA<br />
BT technology, USA<br />
SDL, UK<br />
AIMIL, INDIA,<br />
SHIMDZU, JAPAN<br />
BT technology, USA<br />
SDL, UK<br />
AIMIL, INDIA,<br />
SHIMDZU, JAPAN<br />
Appendix-5C (Contd…)<br />
Approximate<br />
Cost<br />
RS.(lakhs)<br />
15.0<br />
1.0 (attachment<br />
to tensile tester)<br />
4.0 (attachment<br />
to tensile tester)<br />
1.0 (attachment<br />
to tensile tester)<br />
1.0 (attachment<br />
to tensile tester)<br />
4.0 (attachment<br />
to tensile tester)<br />
378
Serial<br />
No.<br />
Test Parameters<br />
Specification<br />
Standard<br />
13. BURSTING STRENGTH ASTM D 3786 DIAPHRGM/MULLENT<br />
TYPE BURSTING<br />
14. Pullout Resistance in Soil<br />
TESTERS<br />
EN 13738 Pull-out Resistance<br />
Tester<br />
Equipments Major Suppliers<br />
BT technology, USA<br />
SDL, UK<br />
BT technology, USA<br />
15. Coefficient of Soil & Geosynthetic ASTM: D5321-92 Direct Shear Test BT technology, USA<br />
Friction<br />
Equipment<br />
AIMIL, INDIA,<br />
16. WATER PERMEABILITY ASTM: D5493-93 CROSS PLANE Water BT technology, USA<br />
IS 14324 : 1995 permeability tester AIMIL, INDIA,<br />
17. TRASMITTIVITY <strong>OF</strong><br />
ASTM: D4716-93 IN PLANE Water BT technology, USA<br />
GEOTEXTILES<br />
permeability tester AIMIL, INDIA,<br />
18. L<strong>ON</strong>G TERM FLOW AND ASTM D 5101 long term flow/ gradient BT technology, USA<br />
GRADIENT RATIO TESTS<br />
ratio APPARATUS AIMIL, INDIA,<br />
19. Tensile Creep EN ISO 13431 Tensile Strength Tester BT technology, USA<br />
ASTM: D5262-92<br />
IS 14739:1999<br />
with extensometer AIMIL, INDIA<br />
20. Apparent opening size (AOS) ASTM D 4751 95 Dry sieve apparatus W.S.Tylor, Germany<br />
BT technology, USA<br />
AIMIL, INDIA,<br />
21. Wet sieve test ASTM D 4751 95 Wet sieve apparatus BT technology, USA<br />
AIMIL, INDIA,<br />
22. Resistance to Weathering<br />
ASTM:D 4355-92 Xenon-Arc<br />
ATLAS<br />
/Ultraviolet Degradation<br />
IS:13162 (Part 2) Apparatus/Quick UV SDL, UK<br />
Tester<br />
ATI CORP. USA<br />
23. TEMPERATURE STABILITY ASTM D 4594 Environmental chamber for SDL, UK<br />
thermal<br />
INSTR<strong>ON</strong>,UK<br />
resistance(attachment) ZWICK,INDIA<br />
Appendix-5C (Contd…)<br />
Approximate<br />
Cost<br />
RS.(lakhs)<br />
6.0<br />
15.0<br />
22.0<br />
6.0<br />
6.0<br />
3.0<br />
22.0<br />
1.5<br />
3.0<br />
40.0<br />
17.0 (attachment to<br />
tensile tester)<br />
379
EXHIBIT 1<br />
Appendix-5C (Contd…)<br />
PROJECT COST<br />
(LAND, BUILDINGS, PROCESS PLANT & MACHINERY, UTILITIES &<br />
O<strong>THE</strong>R ASSETS)<br />
1<br />
2<br />
Land<br />
Area: 2000 Sq Mtrs<br />
Rate: (Rs.1200 /Sq. Mtr)<br />
Buildings<br />
Plant Area, Office, Godown, Lab, Service Area etc.)<br />
Built-up Area : 500 Sq. Mtrs<br />
Avg Rate : Rs. 4500 /Sq. Mtrs<br />
3 Process Plant & Equipment<br />
4<br />
5<br />
Utility & Other equipments (5%)<br />
(Power, Water, Compressor, Humidity Control,<br />
Fire Fighting, Material Handling etc.)<br />
Misc. Fixed Assets<br />
(Furniture & Fixtures, Office Equipment, Testing Lab<br />
etc.)<br />
6 Project Engineering & Consultancy charges (2.5%)<br />
7<br />
Preliminary & Pre-operative Expenses (12%)<br />
(Company Formation, Interest during construction,<br />
pre-production expenses, etc.)<br />
8 Contingency (10 %)<br />
9 Total<br />
10 Margin Money for Working Capital<br />
11 Total Project Cost<br />
Project Cost<br />
(Rs. Cr.)<br />
0.24<br />
0.54<br />
20.00<br />
1.00<br />
0.35<br />
0.5<br />
2.40<br />
2.50<br />
27.53<br />
0.30<br />
27.83<br />
380
SAFETY AND PROTECTIVE TEXTILES<br />
1. PRODUCTS AND TECHNOLOGY<br />
Appendix-5C (Contd…)<br />
1. Protective textiles refer to garments and other fabric related items designed to<br />
protect the wearer from harsh environmental effects that may result in injury or<br />
death.<br />
2. According to end use the classification of the protective textiles can be done as<br />
High temperature textiles, Flame Resistant protective clothing, Chemical<br />
protective clothing, Mechanical protection, Electrical protective clothing, Clean<br />
room textiles, Radiation protection, Thermal insulation, High visibility textiles,<br />
Metallised fabrics, Space suits, Covers for Automotives.<br />
3. Wide ranges of fiber type, qualities depending on desired technical and<br />
functional parameters are used in designing safety and protective textiles. High<br />
tech synthetic fibres like aramid, glass, melamine FR polyester, olefins,<br />
polybenzimidazole (PBI), phenolic, PTFE (flurocarbon), carbon, ceramic,<br />
silica, polyacrylates etc with their brand product name are mainly used in this<br />
segment.<br />
4. Generally for safety and protective textiles base fabric is woven or non-woven<br />
which is either specially finished, coated, laminated or metallised.<br />
5. Final garment may consist of single or double layer. Stitching of garment also<br />
demands need of specialized sewing yarn and technique of sewing.<br />
PROTECTIVE TEXTILE<br />
Protection from extreme environment has always been a critical<br />
requirement of textile industry. Clothing that protect from water, extreme winter,<br />
intensive heat, open fire, high voltage, propelled bullets, toxic chemicals, nuclear<br />
radiations, and biological toxins etc. are some of the examples. These clothing find<br />
applications as sportswear, defence wears, firefighting wears (fire entry suits),<br />
bulletproof jackets, and other professional wears.<br />
Apart from clothing, even structures that can protect from above exposures<br />
are required to be created using protective textiles. Shelters- temporary or<br />
permanent such as army tents, stadium roofs, and exhibition arena are some of the<br />
381
Appendix-5C (Contd…)<br />
examples. Textile materials used in composites for various structural uses are also<br />
required to have certain protective properties.<br />
Challenges<br />
The protective textile try to combine both the fabric characteristics such as<br />
flexibility, softness, drape, handle and breathability with critical protective<br />
characteristics mentioned above. This is a challenge because, applying any coating<br />
or modifying fibres for obtaining protective function tend to sacrifice that very<br />
fabric qualities which are dear to a textile technologist and a customer.<br />
Therefore, a balance where desirable textile attributes are preserved while<br />
achieving adequate protection is always a topic of intense research worldwide.<br />
Inherently fire retardant polyester filaments<br />
Such materials are very important in creating protective clothing for use in<br />
chemical-nuclear-biological warfare, firefighting, and other heat intensive jobs.<br />
Many approaches have been used around the world in producing such fibres<br />
through modification during polymerization or melt spinning route. However, melt<br />
additive during spinning route is normally not commercially used as it tends to<br />
lower the mechanical properties of the resultant fibre. Ther is a unique approach of<br />
adding phosphorous-based compounds to PET up to 10% by weight loading in the<br />
fibres. These fibres can be easily drawn at high draw ratios to give high strength<br />
nearly equivalent to PET fibres without additive. The Limiting Oxygen Index<br />
(LOI) values for these fibres were as high as 27.5 in knitted filament form (i.e.<br />
open structure).<br />
Breathable Coatings<br />
Textiles that allow water vapours to pass but protect from rain or water find<br />
varied applications in many areas. Many commercial products are today available,<br />
however, creating breathable coating which can provide very high rates of water<br />
vapor transmission (WVTR) to allow comfortable feeling to the wearer is still a<br />
challenge. Microporous films or coatings with hydrophobic-hydrophilic segmented<br />
polymer are known methods of creating such structures. However, due to<br />
hydrophobic nature of the polymers used, WVTR values are normally restricted.<br />
Hydrophilic films are a better choice but they suffer from the limitation that they<br />
are soluble in water, and therefore, are not durable. Our group is working on<br />
integrating certain hydrophillic polymer systems based on substituted<br />
382
Appendix-5C (Contd…)<br />
polyacrylamides with known textile surfaces that can provide durable protective<br />
coating while giving very high values of WVTR.<br />
Heat Managing Outer-layer Structures<br />
Textile structures for extreme winter clothing is normally composed of<br />
several layers. these layers provide insulation and at times manage the flow of<br />
winds so that they do not penetrate the textile structures. Use of fur inside and bird<br />
feathers in between are often used or providing insulation from low outside<br />
temperatures. However, very little attention has been given for optimizing the<br />
structure of outermost layer of such garments. Our group has investigated certain<br />
structures for outer most layer which allow better capturing of heat from the Sun<br />
while minimizing loss of captured heat from the surface under windy conditions.<br />
Use of these layers was found to raise the fabric temperature by several degrees<br />
compared to standard structures.<br />
2. GLOBAL MARKET POTENTIAL:<br />
The estimated market size of this sector is unclear due to the unclear<br />
distinction between protective clothing and everyday workwear, and between<br />
protective sportswear and leisurewear.<br />
From the following table it is seen that the total consumption of safety and<br />
protective textile for the year 2000 is 238 (000t) worth value of 5193 ($m). It is<br />
estimated that the estimated total consumption for the year 2010 would be around<br />
340 (000t) worth value of 6857 ($m). Consumption for Asian region is 56 and 93<br />
(000t) for the year 2000 and 2010 respectively, where India is one of the major<br />
consumer.<br />
Worldwide Market by (Region wise)<br />
Worldwide Consumption of protective textiles<br />
Consumption (000t) Value ($m)<br />
Year 2000 2010 2000 2010<br />
W. Europe 71 90 1584 1852<br />
E. Europe 7 13 167 272<br />
N. America 80 107 1717 2165<br />
S. America 11 17 253 355<br />
Asia 56 93 1184 1811<br />
Australia 2 3 38 57<br />
Rest of World 11 17 250 344<br />
Totals 238 340 5193 6857<br />
Ref – DRA report (Technical Textiles report)<br />
383
Appendix-5C (Contd…)<br />
3. RECOMMENDED PLANT MACHINERY (Depending on the end<br />
product:<br />
Machinery Required:<br />
• Shuttle less weaving machine<br />
• Nonwoven lines<br />
• Needle punch/Spun bonding<br />
• Finishing/Coating/Lamination machinery<br />
4. GLOBAL TECHNOLOGY AND EQUIPMENT SUPPLIERS<br />
• Weaving Machine<br />
Sulzer, Somet, Picanol (Belgium), Donier,<br />
• Nonwoven Plant<br />
Dilo Maschine system GmbH (Germany), Fehrer AG (Austria)<br />
Asselin (France), American Textile Machinery (USA)<br />
Shoou Shyng (Taiwan), Rieter Perfojet (France)<br />
Reifenhauser GmbH& Co. (Germany)<br />
• Finishing/Coating/Lamination<br />
Stork Prints, Netherlands, Brueckner Trockentechnik Gmbh, Germany<br />
Coatema Machinery Gmbh, Germany, Monti Antonio SPA, Italy<br />
Zimmer Maschinenbau Gmbh, Austria<br />
5. TOTAL PROJECT COST (for Coating / lamination machinery) –<br />
Rs.24.62 Crores<br />
Depends on end product, technique of manufacturing and after treatment of<br />
product like finishing, coating, etc.<br />
Considered here are two models for developing<br />
384
Appendix-5C (Contd…)<br />
1. Class of protective fabrics for chemical, electrical protection, clean room<br />
textiles and high visibility textiles – Generally a woven fabric that is coated/<br />
laminated<br />
2. Protective fabrics for thermal insulation, flame resistance, high temperature<br />
resistance – Generally a multilayer fabric, comprising of woven and<br />
nonwoven layers that would be coated or laminated.<br />
Thus, it may be noted that fabrics may be sourced from appropriate industry<br />
and subjected to the necessary making – up , coating/laminating process for<br />
these garments.<br />
6. RECOMMENDED EC<strong>ON</strong>OMIC SIZE PLANT :<br />
Make: CFT Coating and Finishing System including – Unwinder, Infeed<br />
device, Coating system, Dryer, Cooling cylinders<br />
Manufactures: Stork Prints, Netherlands<br />
Designed Capacity : 1200 mtrs per hour<br />
Plant installed cost: Rs. 17.21 Cr. including installation charges<br />
7. PROJECT COST AND PR<strong>OF</strong>ITABILITY PROJECTI<strong>ON</strong>S<br />
I. PROJECT COST:<br />
Land<br />
(SeeTable 1)<br />
The total requirement of land for this project would be approximately 2000 sq.m.<br />
the land cost is assumed to be Rs.1200 per sq. m.(including development cost).<br />
The total cost of developed land would be Rs. 0.24 Cr.<br />
Building<br />
The building area comprising of main factory building, office, godown, testing<br />
laboratory would require about 1000 sq.m. at a projected cost of Rs. 4,500 per<br />
sq.m, costing Rs. 0.50 Cr.<br />
385
Plant and machinery<br />
Appendix-5C (Contd…)<br />
The machinery required for the manufacture has been described in the earlier<br />
section. The cost of set –up would require about Rs.17.21 Crores.<br />
Utility and other equipments<br />
The finishing machinery and accessories for the set-up including environment<br />
conditioning, compressor and other such infrastructure would require about 5 % of<br />
the Plant cost, Rs. 0.86 Cr.<br />
Miscellaneous Fixed Assets<br />
The provision for office furniture and fixtures, laboratory instruments, etc is made<br />
under this head to a tune of Rs. 0.35 crores.<br />
Project Engineering and Consulting<br />
Under this head the items included are fees and expense on account of architect<br />
fees, project engineering and management and detailed project reports.<br />
Preliminary and Pre-operative Expenses<br />
The items included under this head are company formation expense, public issues<br />
(if any), interest during construction, pre – production expenses during<br />
implementation phase.<br />
Contingency<br />
Depending upon the gestation period and further detailing of the project cost by<br />
the promoter, the contingency provision has been made at the rate of 10 %.<br />
Margin Money for Working Capital<br />
The margin money for working capital of the total project cost would be about Rs.<br />
1.33 Crores.<br />
The TOTAL PROJECT COST is estimated to be Rs. 24.62 Crores.<br />
II. SALES AND PR<strong>OF</strong>ITABILITY ANALYSIS:<br />
(See Table 2)<br />
386
Sales Revenue and Turnover<br />
Appendix-5C (Contd…)<br />
The average selling price of a protective fabric depending upon the end – use,<br />
ranging from Rs. 75 to Rs. 250 per metre. Assuming an average price of Rs. 150<br />
per m.<br />
The machine is assumed to operate at 75 % efficiency to give a production of 900<br />
m per hour.<br />
The plant would operate on three – shift basis 300 day per year.<br />
The capacity utilization for the first year is assumed at 50 % and thereafter it is<br />
assumed to be 60 %, 75%, 90% and so on.<br />
Cost of Production<br />
Raw Material cost<br />
The raw materials for these protective fabrics would include<br />
Major Raw Material Average Prices<br />
Textile substrate – woven, non-woven Rs. 50 per sq mt.<br />
Coating materials & auxiliaries Rs. 200 per Kg<br />
Conversion cost<br />
The conversion cost including the cost of power, water, chemical,<br />
consumables, etc is assumed to be 25% of the cost of raw material i.e., Rs.<br />
16 per sq mt.<br />
Manpower, salaries and wages<br />
The manpower requirements and the salary structure is exhibited in Table 3.<br />
The total manpower requirement is 26 people at various levels with an<br />
expense of Rs. 0.20 crore annually.<br />
Factory and Overhead Expenses<br />
The items covered under this head are establishment expense, repairs and<br />
maintenance, stationery, travel, packaging, etc. at a flat rate of Rs. 0.10<br />
Crores annually.<br />
387
Marketing and Promotional Expenses<br />
Appendix-5C (Contd…)<br />
The promotion of technical textile products based on spacer fabrics will call<br />
for expenditure of about 5% of annual sales.<br />
Interest and depreciation<br />
The prevailing interest rates for short term and long term borrowed funds is<br />
assumed to be 13 % per annum.<br />
The repayment of loans has been assumed for 5 years with a moratorium<br />
period of 1 year.<br />
The depreciation rates have been worked out as per Company’s Act (SLM)<br />
in a straight line method.<br />
III. PR<strong>OF</strong>ITABILITY, BREAK-EVEN & PAYBACK PERIOD<br />
As shown in the Profitability Statement, vide Table 2, the sales turnover increases<br />
from Rs. 45.6 Crore in the first year to Rs. 91.1 Crore in the fifth year. The Profit<br />
Before Tax increases from Rs. 11.6 crore in first year to Rs. 29.80 Crore in the<br />
fifth year.<br />
The BREAKEVEN SALES is projected to be Rs. 16.71 crore, i.e., 36.6%<br />
The PAY BACK PERIOD for the project is 23 months.<br />
8. REGULATORY FRAMEWORK & POLICY ISSUES<br />
o Institutional buyers like defense, industries, disaster management<br />
programme authorities; fire fighters, relief service bodies (especially in<br />
colder region) etc. may be insisted to consume these products.<br />
o Civil workers, fire bridge people, out door working persons, sports<br />
participants like racing driver, paratroopers, mountaineers etc. require<br />
sufficient safety and protection. This will be strictly followed by<br />
imposing government regulations.<br />
o Personnel working in chemical industry, dye & auxiliary manufacturing<br />
industry, steel plant, heavy metal industry ect. should require suitable<br />
chemical protective clothings.<br />
o Inter ministerial support is essential to promote these safety regulations<br />
to the users to protect their life etc.<br />
388
Appendix-5C (Contd…)<br />
o Impose hefty import duty for finished goods to discourage entry.<br />
o Propose more promotional programmes to increase awareness.<br />
9. Essential testing parameters, Test Methods, Equipments, Suppliers and<br />
Cost (Approximate) are given in following table:<br />
Test Parameters<br />
Specification<br />
Standard<br />
Thickness ASTM: D5199-<br />
91<br />
BSEN: 964 -1<br />
ISO: 9863<br />
BIS: IS:13162<br />
Mass Per Unit<br />
Area<br />
(Part 3)<br />
ASIM: D5261-92<br />
BSEN:965<br />
ISO:9864<br />
BIS: IS: 1964<br />
Equipments<br />
Thickness gauge<br />
with variable load<br />
Weighing<br />
Balance<br />
Tensile Properties ASTM:D5035-90 Tensile Tester<br />
with Load Cells<br />
Air Permeability ASTM:D737-75 HP Air<br />
Ultraviolet<br />
Degradation<br />
ASTM:D4355-92<br />
BIS: IS:13162<br />
(Part 2)<br />
BS 3424, ASTM<br />
D 4005-81<br />
Permeability<br />
Tester<br />
Xenon-Arc<br />
Apparatus/Quick<br />
UV Tester<br />
Major<br />
Suppliers<br />
SDL 1.5<br />
Mettler/Precisa 1.0<br />
Approx.<br />
Cost Rs.<br />
lakhs<br />
Shimadzu- 13.50<br />
AGS, Instron,<br />
Zurick<br />
Textocraft 1.26<br />
Quick UV<br />
tester (Atlas<br />
UV2000)<br />
Degree of fusion<br />
Oven Therelek, 0.5<br />
/Curing of coating<br />
Heraeus etc.<br />
Blocking BS 3424, IS 7016 Oven Therelek, 0.5<br />
Part 9<br />
Heraeus etc.<br />
Coating Adhesion BS 3424, IS 7016 UTM Shimadzu/ 15.0<br />
Part<br />
D751<br />
5, ASTM<br />
Instron<br />
Accelerated BS 3424, IS 7016 Oven Therelek, 0.5<br />
Ageing<br />
Part 8<br />
Heraeus etc.<br />
Based on<br />
Flexibility- Flat<br />
ISO/R1419-1970<br />
IS 7016 Part 11 - To be<br />
Loop Method Based on<br />
fabricated<br />
Damage due to<br />
ISO/R5979-1982<br />
BS 3424, IS 7016 Flex abrasion M/c SDL 5.0<br />
Flexing<br />
Part 4, ASTM<br />
D2097<br />
Abrasion<br />
Resistance<br />
BS 3424, ASTM<br />
D 3389<br />
Flat abrasion<br />
tester<br />
40.0<br />
SDL 5.0<br />
389
Test Parameters<br />
Test for<br />
Colourfastness to<br />
dry and wet<br />
rubbing<br />
Water vapour<br />
Permeability<br />
Resistance to<br />
Permeation by<br />
Hazardous Liquid<br />
Chemicals<br />
Electrical<br />
resistively of the<br />
fabric<br />
Tensile strength/<br />
Tear strength<br />
Bursting strength<br />
UV resistance<br />
Light fastness<br />
Specification<br />
Standard<br />
Equipments<br />
Appendix-5C (Contd…)<br />
Major<br />
Suppliers<br />
BS 3424, IS1259 Crockmeter SASMIRA,<br />
AATCC<br />
ASTM E 96-80 WVP tester SDL 5.0<br />
ASTM F 739-96 UV IR<br />
spectrophotometer,<br />
chromatograph<br />
AATCC 76-1995 Resistivity meter/<br />
Honestmeter<br />
Varian,<br />
Shimadzu<br />
Shishido<br />
Electrostatic,<br />
Ltd.<br />
IS 7016 UTM Shimadzu,<br />
instron, Zurick<br />
Approx.<br />
Cost Rs.<br />
lakhs<br />
0.1 to<br />
5.0<br />
12.0 to<br />
15.0<br />
20.0<br />
15.0<br />
IS 1966 Bursting<br />
tester<br />
strength SDL/ Ubique 6.0<br />
ASTM G 151 Q-UV, Atlas 2000 Atlas/ Q-sun 25.0<br />
AATCC-16-93,<br />
IS- 2454<br />
Xenotest/ Light<br />
fastness tester<br />
SASMIRA/<br />
Atlas<br />
Note: SASMIRA, Worli, Mumbai and other TRA’S have most of the above testing facility.<br />
25.0<br />
390
1<br />
2<br />
3<br />
4<br />
5<br />
TABLE 1<br />
Appendix-5C (Contd…)<br />
PROJECT COST<br />
(LAND, BUILDING, PROCESS PLANT & MACHINERY, UTILITIES &<br />
O<strong>THE</strong>R ASSETS)<br />
LAND<br />
Area: 2000 sq. m<br />
Rate: Rs.1,200/ sq.m<br />
BUILDING<br />
(Plant area,Office, Godown, Lab, Service area)<br />
Area: 1000 sq.m<br />
Rate: Rs.4,500/sq.m<br />
PROCESS PLANT & EQUIPMENT<br />
Zimmer (Austria), Designed Capacity : 1200 mtrs per hour<br />
UTILITY & O<strong>THE</strong>R EQUIPMENT<br />
machinery and accessories for the set-up<br />
MISC. FIXED ASSETS<br />
(Furniture &fixtures, testing lab, office equipment)<br />
6 PROJECT ENGINEERING & C<strong>ON</strong>SULTANCY<br />
CHARGES (2.5%)<br />
7<br />
PRELIMINARY & PRE-OPERATIVE EXPENSES<br />
(12%)<br />
(Company formation, Interest during construction, preproduction<br />
expense)<br />
8 C<strong>ON</strong>TINGENCY(10%)<br />
9 TOTAL<br />
10 MARGIN M<strong>ON</strong>EY FOR WORKING CAPITAL<br />
TOTAL PROJECT COST<br />
(Rs. Crores)<br />
0.24<br />
0.45<br />
17.21<br />
0.86<br />
0.35<br />
0.42<br />
2.06<br />
1.70<br />
23.29<br />
1.33<br />
24.62<br />
391
REVENUE<br />
TABLE 2<br />
PR<strong>OF</strong>ITABILITY STATEMENT (in Crore Rs.)<br />
ACCOUNT HEAD<br />
NET SALES TURNOVER<br />
(@ Rs.150 per meter fabric)<br />
Appendix-5C (Contd…)<br />
FINANCIAL YEAR <strong>OF</strong> OPERATI<strong>ON</strong><br />
I II III IV V<br />
45.60 54.70 68.30 82.00 91.10<br />
Total Revenue 45.60 54.70 68.30 82.00 91.10<br />
EXPENSES<br />
Raw Material 24.30 29.20 36.50 43.70 48.60<br />
Salaries & Wages 0.20 0.21 0.22 0.24 0.25<br />
Power, Fuel & other expenses<br />
(25% of raw material cost)<br />
3.80 4.60 5.70 6.80 7.60<br />
Marketing & Promotional exp. 0.25 0.28 0.34 0.41 0.45<br />
Factory & office overheads 1.90 1.90 1.90 1.90 1.90<br />
Interest on short term loans 0.39 0.47 0.58 0.68 0.68<br />
Cost of Sales 30.84 36.66 45.24 53.73 59.48<br />
Depreciation 1.24 1.24 1.24 1.24 1.24<br />
Interest on Long Term Loans 1.92 1.73 1.35 0.96 0.58<br />
Profit Before Tax 11.60 15.07 20.47 26.07 29.80<br />
392
TABLE 3<br />
MANPOWER REQUIREMENT<br />
ANNUAL BUDGET FOR SALARIES & WAGES (Rs.)<br />
MANPOWER NOS. M<strong>ON</strong>THLY<br />
SALARY<br />
TOTAL<br />
M<strong>ON</strong>THLY<br />
SALARY<br />
Appendix-5C (Contd…)<br />
TOTAL<br />
ANNUAL<br />
SALARY<br />
General Manager 1 30000 30000 360000<br />
Production manager 1 15000 15000 180000<br />
Machine Operator<br />
(1 per shift) 3 4000 12000 144000<br />
Machine Helper<br />
(2 per shift) 9 3000 27000 324000<br />
R & D, Testing 1 10000 10000 120000<br />
Marketing & Sales Staff 4 12000 48000 576000<br />
Clerical staff 4 4000 16000 192000<br />
Other staff 2 2500 5000 60000<br />
Maintenance 1 4000 4000 48000<br />
Total Wage Bill 26 2004000<br />
393
Appendix-5C (Contd…)<br />
394
SHOE UPPERS<br />
1. PRODUCT AND TECHNOLOGY<br />
Appendix-5C (Contd…)<br />
1. Leather was so far used for shoe upper manufacturing as it has properties to<br />
absorb and transmit perspiration with good resistance to flexing in walking.<br />
2. Today the textile component forms 15 to 20% of the shoe and remaining<br />
non-textile components. The shoe uppers and the lining used are inner parts<br />
of the shoe.<br />
3. The advantage of textiles over leather in footwear upper is consistency of<br />
quality and specification, lightness especially when wet, their easy-care<br />
properties i.e. they can be washed and dried. A fashion feature is that they<br />
can be produced in bright non-fading colours.<br />
4. Usually nylon, polypropylene, acrylic, cotton or blends of polyester cotton<br />
woven, knitted or non-woven with polyurethane coating are good imitation<br />
of softer leathers in appearance and feel and are soft, light in weight and<br />
comfortable to wear with moisture transfer from inside to outside.<br />
5. coated fabrics form one of the most important segments. Coating operation<br />
(also lamination and Impregnation) is carried out to impart certain<br />
characteristics and desirable properties for the end-use application of the<br />
product. Polyurethane (PU) coated fabrics are the main synthetic upper<br />
material. They normally have a thin coating of PU on a raised fabric base,<br />
normally woven cotton or polyester/cotton. In the newer coagulated<br />
materials the fabric is impregnated prior to the coating being applied.<br />
6. Other upper material include PVC-coated fabrics, which have a degree of<br />
permeability to perspiration and used in sports / training shoes and slippers.<br />
7. Footwear is among the product, which can be labeled, as eco-friendly i.e.<br />
the product has been manufactured under environmentally friendly<br />
conditions and that will not pose any threat to human health or to the<br />
environment during its use and after disposal.<br />
395
2. MAJOR APPLICATI<strong>ON</strong>S<br />
Appendix-5C (Contd…)<br />
The major components of shoes, which are textile based, are following:<br />
• Shoe upper<br />
• Shoe linings<br />
• Laces<br />
• labels<br />
3. GLOBAL MARKET POTENTIAL:<br />
• About 110 million pairs per year of footwear of all types are<br />
manufactured in U.K. retail sales are around 290 pairs or five pairs per<br />
head of population.<br />
• The large part of demand is met by imports from sources with lower<br />
labour cost.<br />
• Globally this condition appears to be same for other developed countries<br />
with the vast potential for exports.<br />
• China, Malaysia, Singapore and Hong Kong are the major exporter due<br />
to the advantage of low labour cost, high productivity, large project size<br />
and better quality components.<br />
4. INDIAN MARKET POTENTIAL:<br />
• The majority of the production of foot wear is mainly accumulated in<br />
decentralised sector with cluster growth of small medium and cottage<br />
units. The quality of foot wear produced by this units vary according to<br />
the manufacturer.<br />
• Indian footwear industry is expected to maintain a growth rate of 8% per<br />
annum under normal circumstances and the projected market potential<br />
would be as follows:<br />
Year<br />
2003-04<br />
Mn Pairs Value (Rs.Cr.)<br />
2003-04 595 5950 (1200)<br />
2007-08 804 8040 (1600)<br />
Figures in the brackets reflect approximate vaule of technical textile<br />
shoe components<br />
396
Appendix-5C (Contd…)<br />
• Apart from domestic market the focus should be given for exports as<br />
India has the benefit of low labour cost, and resources provided the<br />
quality of the components should be maintained as per international<br />
standards.<br />
5. MAJOR MANUFACTURERS:<br />
The major shoe manufacturers in India are as follows:<br />
• Bata • Liberty<br />
• Action • Reebok<br />
• Lakhani • Adidas<br />
• Nike<br />
6. REGULATORY FRAMEWORK & POLICY ISSUES<br />
• The components of the shoes are not standardized, government should<br />
implement standards on these components and finished products as per<br />
international norms.<br />
• The different duty structure should be streamlined for units in the<br />
centralised and decentralised sector.<br />
7. TESTING REQUIREMENT & FACILITIES<br />
S.<br />
No<br />
Test Required Instrument<br />
Approx. Cost in Rs.<br />
(Lakhs)<br />
1. Adhesion ( Peel bond)<br />
(ASTM D 751-98)<br />
Universal tester 15.00<br />
2 Flexing test ( BS-3424) Flex tester 3.00<br />
3. Abrasion resistance Martindale abrasion<br />
tester<br />
5.00<br />
4. Water penetration resistance Hydrostatic head 3.00<br />
(BS3424 part26; 1986) apparatus<br />
5. Fabric stiffness (ASTM Bending-length<br />
2.00<br />
D1338-96)<br />
tester cantilever<br />
6. Fabric strength (ASTM Tensile tester 15.00<br />
D5035-90)<br />
7. Colour fastness to rubbing<br />
(ISO105-A02)<br />
crockmeter 0.002<br />
8. Soiling and cleanaility Fabricated<br />
9. Breathability (BS7209) Shirley water-vapour<br />
permeability tester<br />
4.00<br />
10. Odour test Electronic<br />
(Fabricated)<br />
nose<br />
397
8. ESSENTIAL MACHINERY<br />
Appendix-5C (Contd…)<br />
The various manufacturing processes are available for making shoe uppers.<br />
They are mainly weaving, knitting as well as non-woven. Mostly the decentralised<br />
sector of India is engaged in production of woven and knitted fabrics. This sector<br />
has potential to produce the required fabric for the above applications.<br />
The coating are applied on the fabrics by coating machines. Either<br />
polyurethane (PU)coating or polyvinyl coating(PVC) are applied. As PVC coating<br />
are cost effective they are mostly used for shoe uppers, but for the expensive shoes<br />
PU coatings are used as they are more durable and water based causing less harm<br />
to the enviroment.<br />
Coating Equipment Suppliers:<br />
1. Stork Prints (Netherlands)<br />
2. Coatema Machinery (Germany)<br />
3. Zimmer (Austria)<br />
4. Monti Antonio Spa (Italy).<br />
5. Brueckner Trockentechnik (Germany)<br />
There are 4 main departments connected with manufacturing within a<br />
footwear company and the components follow a progressive route through each of<br />
these departments to produce the finished shoes. The departments are, Clicking,<br />
Closing, Lasting/ Making, Finishing/ Shoe Room.<br />
PROJECT COST & PR<strong>OF</strong>ITABILITY PROJECTI<strong>ON</strong>S<br />
1. Land<br />
The total requirement of land for this project keeping in mind the possible<br />
future expansion is around 2000 Sq. Mtrs. ( 0.5 acres ).<br />
Based on the avaliable information the cost of land is assumed at Rs 1200<br />
per square meter ( including the developmental cost ).Depending on the exact<br />
location of the project to be determined by the promoter the land cost could be<br />
higher or lower. Hence the total cost of developed land will be Rs 0.24 crores.<br />
398
2. Buildings<br />
Appendix-5C (Contd…)<br />
The building area comprising of main factory building, godowns, office , R<br />
& D labs / Inhouse Testing centre etc would be 1000 Sq. Mtrs. The cost of<br />
construction would again vary depending on the structure and the materials to be<br />
used. It has been assumed that the average cost of construction would be Rs 4500<br />
per sq mtr.Thus the total cost of building and other civil works would be around<br />
Rs 0.45crores.<br />
3. Plant and Machinery<br />
Details of Plant and machinery as well as technology required for the<br />
project have been presented in earlier Section 7. The installed cost of plant and<br />
machinery would be Rs 17.00crores. Apart from the main process equipments the<br />
utilities required are Ancillary equipments, Electricals, Piping, Power , Water<br />
supply, compressors ,fire fighting equipments etc. The provision on this count is<br />
taken as 5 % of the cost of machinery which works out to Rs 0.85.<br />
4. Miscellaneous Fixed Assets<br />
Under this head the items included are Furniture and fixtures, Office<br />
equipments, Air Conditioners etc and the provision made is around Rs 0.05<br />
crores. Additionally the Testing and R& D facilities would also call for an<br />
investment of around Rs 0.20crores.Thus the total investment under this head<br />
would be Rs 0.2 5 crores.<br />
5. Project Engineering and Consulting<br />
Under this head the items included are the fees and expenses on account of<br />
Architect fees, project engineering and management (both local and overseas ),<br />
detailed project reports etc .<br />
6. Preliminary & Preoperative Expenses<br />
The items included under this head are company formation expenses ,<br />
public issue expenses (if any), interest during construction, pre production<br />
expenses during the implementation phase etc .<br />
7. Contingency Expenses<br />
Depending on the gestation period and further detailing of the project cost<br />
by the promoter, the contigency provision has been made at the rate of 10%.<br />
399
8. Margin Money for Working capital<br />
Appendix-5C (Contd…)<br />
The margin money for working capital forming part of the total project cost<br />
would be Rs 0.89 crores.<br />
9. Total Project Cost<br />
The total project cost as given in Exhibit 1 would be Rs 23.66 crores.<br />
10. Sales Realisation and Turnover<br />
As per the details available from the Technology and Equipment suppliers<br />
the economic size of a plant is 1200 mtrs/hour.<br />
Under the Indian conditions, it is assumed that the machine would operate<br />
at an efficiency level of 75 %.Hence the production from the plant would be 900<br />
mtrs/hour.<br />
year.<br />
The plant would operate on Three -shift basis and 300 workings days in a<br />
The capacity utilisation for the 1st year is assumed at 50% and thereafter for<br />
the 2nd ,3rd and 4th year onwards 60%, 75% and 90% respectively.<br />
The average selling price of the end product would be Rs 60 /sq mtrs. ( net<br />
of excise duties ,sales tax and other incidental expenses). Estimation of sales<br />
revenue is given in Exhibit 2.<br />
11. Major Raw materials<br />
The main raw materials used and the corresponding prevailing prices as an<br />
indicator are as follows:<br />
Major Raw Materials Prices<br />
Polyester Fabric Rs 22/sq mt<br />
PVC Rs 50/Kg<br />
• The major suppliers of raw materials are :<br />
Polyvinyl Chloride (PVC)<br />
(a) Reliance Industries<br />
Polyester<br />
(a) Reliance Industries.<br />
(b) Indo-Rama Synthetics Limited.<br />
400
12. Manpower , Salaries and Wages<br />
Appendix-5C (Contd…)<br />
The manpower requirements and the salary structure is given in Exhibit 3.<br />
The total manpower requirement comprising of supervisors, machine<br />
operators, helpers and the managerial cadre would be 29 nos.<br />
13. Factory and Overhead Expenses<br />
The items covered under this head are repairs and maintenance,<br />
Establishment expenses, stationeries, travel expenses, packaging expenses etc.<br />
14. Marketing and Promotional Expenses<br />
The promotion of coated fabrics will call for expenditure on this account<br />
and a provision of 10 % of sales has been made uniformly over the years.<br />
The profitability statement is given in Exhibit 4.<br />
401
Appendix-5C (Contd…)<br />
402
EXHIBIT 1<br />
Appendix-5C (Contd…)<br />
PROJECT COST<br />
(LAND, BUILDINGS, PROCESS PLANT & MACHINERY, UTILITIES &<br />
O<strong>THE</strong>R ASSETS)<br />
1<br />
2<br />
Land<br />
Area: 2000 Sq Mtrs<br />
Rate: (Rs.1200 /Sq. Mtr)<br />
Buildings<br />
Plant Area, Office, Godown, Lab, Service Area etc.)<br />
Built-up Area : 1000 Sq. Mtrs<br />
Avg Rate : Rs. 4500 /Sq. Mtrs<br />
3 Process Plant & Equipment<br />
4<br />
5<br />
Utility & Other equipments (5%)<br />
(Power, Water, Compressor, Humidity Control,<br />
Fire Fighting, Material Handling etc.)<br />
Misc. Fixed Assets<br />
(Furniture & Fixtures, Office Equipment, Testing Lab<br />
etc.)<br />
6 Project Engineering & Consultancy charges (2.5%)<br />
7<br />
Preliminary & Pre-operative Expenses (12%)<br />
(Company Formation, Interest during construction,<br />
pre-production expenses, etc.)<br />
8 Contingency (10 %)<br />
9 Total<br />
10 Margin Money for Working Capital<br />
11 Total Project Cost<br />
Project Cost<br />
(Rs. Cr.)<br />
0.24<br />
0.45<br />
17.00<br />
0.85<br />
0.25<br />
0.45<br />
2.04<br />
1.70<br />
22.98<br />
0.89<br />
23.66<br />
403
ITEM<br />
EXHIBIT 2<br />
ESTIMATI<strong>ON</strong> <strong>OF</strong> SALES REVENUE<br />
YEAR <strong>OF</strong> OPERATI<strong>ON</strong><br />
Appendix-5C (Contd…)<br />
I II III IV V VI VII VIII IX X<br />
Average Production per hour (sq. mtr) 1200 1200 1200 1200 1200 1200 1200 1200 1200 1200<br />
75% efficiency 900 900 900 900 900 900 900 900 900 900<br />
Capacity Utilisation 50% 75% 90% 90% 90% 90% 90% 90% 90% 90%<br />
Actual Production per hour 600 900 1080 1080 1080 1080 1080 1080 1080 1080<br />
Production per day (sq. mtr) 14400 21600 25920 25920 25920 25920 25920 25920 25920 25920<br />
Production for 300 working days (sq.<br />
mtr)<br />
(Rs. Crore)<br />
4320000 6480000 7776000 7776000 7776000 7776000 7776000 7776000 7776000 7776000<br />
Selling Price (Rs/sq. mtr) 60.00 60.00 60.00 60.00 60.00 60.00 60.00 60.00 60.00 60.00<br />
Sales Revenue (Rs. Cr) 25.92 38.88 46.66 46.66 46.66 46.66 46.66 46.66 46.66 46.66<br />
Value Loss ( 2% ) 0.52 0.78 0.93 0.93 0.93 0.93 0.93 0.93 0.93 0.93<br />
Net Sales Revenue (Rs. Cr) 25.40 38.10 45.72 45.72 45.72 45.72 45.72 45.72 45.72 45.72<br />
404
EXHIBIT 3<br />
MANPOWER REQUIREMENTS<br />
Appendix-5C (Contd…)<br />
Nos Monthly Total Mon. Annual<br />
General Manager 1 30000 30000 360000<br />
Production Manager 1 15000 15000 180000<br />
Machine Operator 3 4000 12000 144000<br />
Machine Helper (Semi Skilled) 9 3000 27000 324000<br />
R&D, Testing 3 10000 30000 360000<br />
Marketing & Sales 3 12000 36000 432000<br />
Clerical Staff 5 4000 20000 240000<br />
Other Staff 3 2500 7500 90000<br />
Maintenance (Mech. & Elec.) 1 4000 4000 48000<br />
TOTAL 29 181500 2178000<br />
Fringe Benefits (40 % of the above) 871200<br />
Total Wage Bill (Annual) Rs. lakhs: 3049200.00<br />
Total Wage Bill (Annual) Rs. Cr.: Salary + Other Benefits = 0.30492<br />
405
EXHIBIT 4<br />
Appendix-5C (Contd…)<br />
PR<strong>OF</strong>ITABILITY STATEMENT<br />
ACCOUNT HEAD<br />
Revenue<br />
I II III<br />
FINANCIAL YEAR OPERATI<strong>ON</strong><br />
IV V VI VII VIII IX<br />
(Rs. Crore)<br />
X<br />
Net Sales Turnover 19.05 22.86 28.58 34.29 34.29 34.29 34.29 34.29 34.29 34.29<br />
Total Revenue 19.05 22.86 28.58 34.29 34.29 34.29 34.29 34.29 34.29 34.29<br />
Expenses<br />
Raw Materials 7.84 10.58 14.11 14.11 14.11 14.11 14.11 14.11 14.11 14.11<br />
Salaries & wages 0.30 0.32 0.34 0.35 0.37 0.39 0.41 0.43 0.45 0.47<br />
Power, Fuel, Stores & Other Expenses<br />
(including packing materials) 2.10 2.70 3.60 3.60 3.60 3.60 3.60 3.60 3.60 3.60<br />
Marketing & Promotional Expenses 1.76 2.29 2.86 2.68 2.68 2.68 1.34 1.34 1.34 1.34<br />
Factory & Office Overheads 1.24 1.24 1.24 1.24 1.24 1.24 1.24 1.24 1.24 1.24<br />
Interest on S.T. Loans 0.38 0.46 0.57 0.69 0.69 0.69 0.69 0.69 0.69 0.69<br />
Cost of Sales<br />
Depreciation (St.Line) 13.63 17.59 22.72 22.67 22.69 22.71 21.39 21.41 21.43 21.45<br />
Amort. of Expenses 1.28 1.28 1.28 1.28 1.28 1.28 1.28 1.28 1.28 1.28<br />
Interest on L.T Loan 0.19 0.19 0.19 0.19 0.19 0.19 0.00 0.00 0.00 0.00<br />
Profit Before Tax 1.05 1.66 2.73 8.97 9.43 9.88 11.62 11.60 11.58 11.56<br />
406
DOUBLE NEEDLE BAR SPACER MACHINES<br />
1. PRODUCT AND TECHNOLOGY SECTOR<br />
Appendix-5C (Contd…)<br />
• A spacer fabrics is a three –dimensional fabric consisting generally of two warp<br />
knitted fabrics produced independently of each other, and connected by<br />
monofilaments or other yarns. The two fabric surfaces can be produced from<br />
different components and also can have different structures.<br />
• These are produced using double needle bed knitting machines, of warp or weft<br />
type.<br />
• The space between the layers can be varied, thereby, resulting spacer fabrics<br />
have thickness ranging from 1 – 15 mm.<br />
• These fabrics are characterised by Light weight, Bulk, Softness, High air<br />
permeability, Fluid transmission, Thermal control, Tear resistance<br />
Major Application and End-usages:<br />
The potential space between the spacer fabric layers can be utilized for<br />
incorporating support strap, foam padding and shape and function components.<br />
Consequently these fabrics find varied uses in the following areas of technical<br />
textiles.<br />
1. Mobiltech Car seat covers<br />
Upholstery insert in car seats<br />
Linings for automobile doors, columns, backs, dashboard,<br />
hood, luggage screen area, etc<br />
Mud flaps for busses and lorries<br />
2. Medtech Bandages to replace plasters<br />
Bed pads for children and incontinence patients<br />
Mattress for long term patients<br />
3. Sportech Insoles for sports and other shoes<br />
Protective zones in sportswear and work wear fabrics<br />
High performance sportswear<br />
Diving suits and surfing suits<br />
4. Indutech Support for ceramic filters<br />
Fluid filters<br />
Mats to absorb oil<br />
Lining for loud speakers<br />
Inner lining for tool belts<br />
407
5. Hometech Mattress underlays<br />
6. Clothtech Shoulder pads<br />
Formed breast cups<br />
7. Geotech Reinforcement and filtration function<br />
2. GLOBAL MARKET POTENTIAL:<br />
Appendix-5C (Contd…)<br />
Spacer fabrics are said to have varied applications in different technical<br />
textile fields. As the market for technical textiles (as per David Rigby Report) is<br />
poised for growth, so is the market for spacer fabrics. It may be said to have a<br />
volume of 24 metric tonnes by 2005, having value of 194 m$.<br />
3. INDIAN MARKET POTENTIAL :<br />
Taking into consideration the wide and varied applications of spacer fabrics,<br />
the market for spacer fabrics in India should be excellent. However, the technology<br />
is not popular in the country as yet. Few of the products in the area of Clothtech<br />
and Sportech are manufactured in our country using the V-bed kntting machines.<br />
For the Warp knitted spacer fabrics to become popular, the high cost of imported<br />
machinery is an impediment.<br />
4. Global Technology and<br />
Equipment Suppliers<br />
5. Recommended Economic Size Plant (Imported*): -<br />
* Karl Mayer, Germany<br />
Karl Mayer Raschel Warp Knitting<br />
machines, Germany<br />
RD 2N, 75” wide, 400 rpm, 210 cpm<br />
RD 6/7N, with Piezo jacquard for patterning, 130”<br />
wide, 850 rpm, 450 cpm<br />
These machines are supplied by A.T.E.Marketing Pvt. Ltd. in India. There<br />
are several models available in Raschel warp Knitting machines, costing in the<br />
range of 1,20,000 to 2,00,000 Euro FOB. The model considered for the project<br />
costing purpose is RD 6N, 130” wide, E22 gauge, Made in China (cost about 40<br />
% less than that made at Principals, Germany). This model is commonly used for<br />
production of Auto Interior trims, Car underlay, mattress underlay and their likes.<br />
408
RD 6N Specification:<br />
• Working width : 130 inches, 330 cm<br />
• Gauges available : E22, 24, 28 (needles per inch)<br />
Appendix-5C (Contd…)<br />
• Knitting elements : 2 needle bars with individual latch needles, 6 ground<br />
guide bars, 2 knockover comb bars and 2 stitch comb<br />
bars<br />
• Warp beam support : Free-standing, 6 warp beam positions, 32” flange<br />
diameter<br />
• Yarn let-off device : 6 electronically controlled yarn let – off gears,<br />
• Machine speed : 850 rpm<br />
• Pattern devices : 6 pattern discs<br />
computer with display of production data on screen<br />
and interface for central data acquisition<br />
• Take – up roller : 3 roller take up driven by change gear<br />
6. Investment in Process Plant<br />
Equipment including Finishing<br />
& Coating Equipment<br />
(installed cost) :-<br />
Rs.1.8 Cr.<br />
7. PROJECT COST AND PR<strong>OF</strong>ITABILITY PROJECTI<strong>ON</strong>S<br />
(i) PROJECT COST: vide Table 1<br />
Land<br />
The total requirement of land for this project would be approximately 1000<br />
sq.m. the land cost is assumed to be Rs.1200 per sq. m.(including development<br />
cost).<br />
Building<br />
The building area comprising of main factory building, office, godown, testing<br />
laboratory would require about 500 sq.m. at a projected cost of Rs. 4,500 per<br />
sq.m.<br />
409
Plant and machinery<br />
Appendix-5C (Contd…)<br />
The machinery required for the manufacture has been described in the earlier<br />
section. The cost of set –up would require about Rs.1.8 Crores.<br />
Utility and other equipments<br />
The preparatory process machines for warping and winding, environment<br />
conditioning, compressor and other such infrastructure would require about 5<br />
% of the Plant cost, Rs. 0.09 Cr<br />
Miscellaneous Fixed Assets<br />
The provision for office furniture and fixtures, laboratory instruments, etc is<br />
made under this head to a tune of Rs.0.30 crores<br />
Project Engineering and Consulting<br />
Under this head the items included are fees and expense on account of architect<br />
fees, project engineering and management and detailed project reports.<br />
Preliminary and Pre-operative Expenses<br />
The items included under this head are company formation expense, public<br />
issues (if any), interest during construction, pre – production expenses during<br />
implementation phase.<br />
Contingency<br />
Depending upon the gestation period and further detailing of the project cost by<br />
the promoter, the contingency provision has been made at the rate of 10 %.<br />
Margin Money for Working Capital<br />
The margin money for working capital of the total project cost would be about<br />
Rs.0.20 Crores<br />
The TOTAL PROJECT COST is estimated to be Rs. 3.61 Crores.<br />
410
(ii) SALES AND PR<strong>OF</strong>ITABILITY ANALYSIS vide Table 2<br />
Sales Revenue and Turnover<br />
Appendix-5C (Contd…)<br />
The average selling price of the spacer fabric of about 350 g/sq.m. being used<br />
for Auto Interior trims, Car underlay, mattress underlay and their likes is<br />
projected to be Rs. 250 per kg.<br />
The machine is assumed to operate at 75 % efficiency to give a production of<br />
14 kg per hour.<br />
The plant would operate on three – shift basis 300 day per year.<br />
The capacity utilization for the first year is assumed at 50 % and thereafter it is<br />
assumed to be 60 %, 75%, 90% and so on.<br />
Cost of Production<br />
Raw Material cost<br />
Polyester, Polypropylene, cotton yarns are popularly used for these<br />
applications. The cost of raw material is calculated after accounting for 5%<br />
of process waste at average price of Rs.100 per kg.<br />
Conversion cost<br />
The conversion cost including the cost of power, water, chemical,<br />
consumables, etc is assumed to be 25% of the cost of raw material.<br />
Manpower, salaries and wages<br />
The manpower requirements and the salary structure is exhibited in Table 3.<br />
The total manpower requirement is 24 people at various levels with an<br />
expense of Rs.0.16 crore annually.<br />
Factory and Overhead Expenses<br />
The items covered under this head are establishment expense, repairs and<br />
maintenance, stationery, travel, packaging, etc. at aflat rate of Rs.0.10<br />
Crores annually.<br />
411
Marketing and Promotional Expenses<br />
Appendix-5C (Contd…)<br />
The promotion of technical textile products based on spacer fabrics will call<br />
for expenditure of about 5%of annual sales.<br />
Interest and depreciation<br />
The prevailing interest rates for short term and long term borrowed funds is<br />
assumed to be 13 % per annum.<br />
The repayment of loans has been assumed for 5 years with a moratorium<br />
period of 1 year.<br />
The depreciation rates have been worked out as per Company’s Act (SLM)<br />
in a straight line method.<br />
(iii) PR<strong>OF</strong>ITABILITY, BREAK-EVEN & PAYBACK PERIOD<br />
As shown in the Profitability Statement, vide Table 2, the sales turnover<br />
increases from Rs. 4.86 crore in first year to Rs. 9.72 crores in the fifth<br />
year. The Profit Before Tax increases from Rs. 1.21 Crore to Rs. 3.42 crore<br />
in the fifth year.<br />
The BREAKEVEN SALES is projected to be Rs. 2.31 crore, i.e., 47.6%<br />
The PAY BACK PERIOD for the project is 2.43 years.<br />
8. REGULATORY FRAMEWORK & POLICY ISSUES : (INCLUDING<br />
C<strong>ON</strong>CESSI<strong>ON</strong>S, EXEMPTI<strong>ON</strong>S AND TESTING FACILITIES)<br />
(i) The authorities should encourage the use of these specialised products with<br />
promotional campaigns for use of Spacer fabrics in mattress underlays, car<br />
seat underlays, beddings for patients and sports and innerwear fabrics<br />
considering the value addition improved functionality provided by them.<br />
(ii) The decentralised sector of northern India caters to the production of some<br />
of the multilayer fabrics used in clothtech and sportech, using the flat bed<br />
machines. These indigenously manufactured machines pose limitations to<br />
designing of the fabrics in terms of fineness of the gauge and thickness of<br />
the fabric. The high cost of the imported machinery is a major hindrance to<br />
the further development of spacer fabrics in our country.<br />
412
9. TESTING REQUIREMENT & FACILITIES<br />
Appendix-5C (Contd…)<br />
TABLE 4: COMM<strong>ON</strong> TEST PARAMETERS FOR SPACER FABRICS<br />
Sr<br />
No. Property<br />
Test<br />
Specification<br />
Instrument<br />
Instrument<br />
Supplier<br />
Cost of<br />
Instrument<br />
(Rs.)<br />
1 Weight D3376 Weighing<br />
balance<br />
Mettler, Presica 1,00,000<br />
2 Thickness ASTM Thickness SDL, Paramount, 1,00,000<br />
D1777 meter CSI<br />
3 Air ASTM D737 Air SDL, Testex, CSI 5,00,000<br />
permeabili<br />
Permeability<br />
ty<br />
Tester<br />
4 Moisture ASTM E 96- Moisture SDL, ATLAS, 5,00,000<br />
transfer 80 transfer<br />
meter<br />
CSI<br />
5 Thermal<br />
Thermal SDL, SASMIRA, 8,00,000<br />
insulation<br />
conductivity<br />
tester<br />
CSI<br />
6 Tear ASTM D Universal Instron,<br />
20,00,000<br />
Properties 2261-96 Testing Shimadzu,<br />
Machine Paramount,<br />
Zwicki<br />
7 Tensile ASTM D Universal Instron,<br />
20,00,000<br />
properties 4964 Testing Shimadzu,<br />
Machine Paramount,<br />
Zwicki<br />
Testing Facility are available in standard textile testing laboratories across the country.<br />
Other specific tests like chemical and UV resistance, flame retardancy, water repellency<br />
may be required to be performed depending upon the end use.<br />
413
Appendix-5C (Contd…)<br />
414
1<br />
2<br />
3<br />
4<br />
5<br />
TABLE 1<br />
Appendix-5C (Contd…)<br />
PROJECT COST<br />
(LAND, BUILDING, PROCESS PLANT & MACHINERY, UTILITIES &<br />
O<strong>THE</strong>R ASSETS)<br />
LAND<br />
Area: 1000 sq. m<br />
Rate: Rs.1,200/ sq.m<br />
BUILDING<br />
(Plant area,Office, Godown, Lab, Service area)<br />
Area: 500 sq.m<br />
Rate: Rs.4,500/sq.m<br />
PROCESS PLANT & EQUIPMENT<br />
4 Raschel knitting machines RD 6N<br />
UTILITY & O<strong>THE</strong>R EQUIPMENT<br />
(Yarn preparatory machines, Compressor, conditioner, etc)<br />
MISC. FIXED ASSETS<br />
(Furniture &fixtures, testing lab, office equipment)<br />
6 PROJECT ENGINEERING &C<strong>ON</strong>SULTANCY<br />
CHARGES(2.5%)<br />
7<br />
PRELIMINARY &PRE-OPERATIVE EXPENSES (12%)<br />
(Company formation, Interest during construction, pre-production<br />
expense)<br />
8 C<strong>ON</strong>TINGENCY(10%)<br />
9 TOTAL<br />
10 MARGIN M<strong>ON</strong>EY FOR WORKING CAPITAL<br />
TOTAL PROJECT COST<br />
(Rs. crore)<br />
0.12<br />
0.23<br />
1.8<br />
0.09<br />
0.5<br />
0.07<br />
0.33<br />
0.27<br />
3.41<br />
0.2<br />
3.61<br />
415
REVENUE<br />
TABLE 2<br />
Appendix-5C (Contd…)<br />
PR<strong>OF</strong>ITABILITY STATEMENT<br />
(Rs. crore)<br />
FINANCIAL YEAR <strong>OF</strong> OPERATI<strong>ON</strong><br />
ACCOUNT HEAD<br />
I II III IV V<br />
NET SALES TURNOVER<br />
(@Rs.250 per kg of fabric)<br />
4.86 5.83 7.29 8.74 9.72<br />
Total Revenue 4.86 5.83 7.29 8.74 9.72<br />
EXPENSES<br />
Raw Material 2.04 2.45 3.06 3.67 4.08<br />
Salaries & Wages 0.16 0.17 0.18 0.19 0.2<br />
Power, Fuel & other expenses<br />
(25% of raw material cost)<br />
0.51 0.61 0.76 1.00 1.00<br />
Marketing & Promotional exp. 0.29 0.35 0.44 0.47 0.47<br />
Factory & office overheads 0.10 0.10 0.10 0.10 0.10<br />
Interest on short term loans 0.09 0.12 0.16 0.19 0.19<br />
Cost of Sales 3.19 3.8 4.7 5.62 6.04<br />
Depreciation 0.18 0.18 0.18 0.18 0.18<br />
Interest on Long Term Loans 0.28 0.25 0.2 0.14 0.08<br />
Profit Before Tax 1.21 1.6 2.21 2.8 3.42<br />
416
TABLE 3<br />
MANPOWER REQUIREMENT<br />
ANNUAL BUDGET FOR SALARIES &WAGES (Rs.)<br />
MANPOWER NOS. M<strong>ON</strong>THLY<br />
SALARY<br />
Appendix-5C (Contd…)<br />
TOTAL<br />
M<strong>ON</strong>THLY<br />
SALARY<br />
TOTAL<br />
ANNUAL<br />
SALARY<br />
Production manager 1 15000 15000 180000<br />
Supervisor (1 per shift) 3 8000 24000 288000<br />
Machines operators<br />
(2 per shift)<br />
Machine Helper<br />
(2 per shift)<br />
6 4000 24000 288000<br />
6 3000 18000 216000<br />
R & D, Testing 1 10000 10000 120000<br />
Marketing & Sales Staff 2 12000 24000 288000<br />
Clerical staff 2 4000 8000 96000<br />
Other staff 2 2500 5000 60000<br />
Maintenance 1 4000 4000 48000<br />
Total Wage Bill 24 1584000<br />
417