SWEDEN%20policy%20profile%20-%20published%2005-02-2013
SWEDEN%20policy%20profile%20-%20published%2005-02-2013
SWEDEN%20policy%20profile%20-%20published%2005-02-2013

Create successful ePaper yourself
Turn your PDF publications into a flip-book with our unique Google optimized e-Paper software.
QUALITY MATTERS IN EARLY CHILDHOOD EDUCATION AND CARE: SWEDEN © OECD <strong>2013</strong><br />
CHAPTER 2. WHERE DOES SWEDEN STAND COMPARED TO OTHER COUNTRIES? - 37<br />
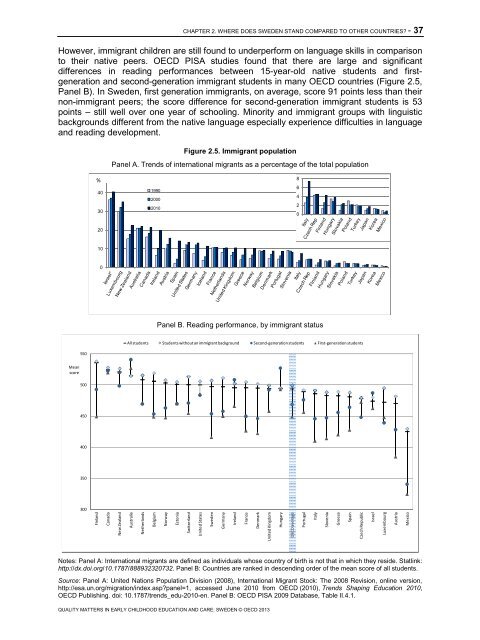
However, immigrant children are still found to underperform on language skills in comparison<br />
to their native peers. OECD PISA studies found that there are large and significant<br />
differences in reading performances between 15-year-old native students and firstgeneration<br />
and second-generation immigrant students in many OECD countries (Figure 2.5,<br />
Panel B). In Sweden, first generation immigrants, on average, score 91 points less than their<br />
non-immigrant peers; the score difference for second-generation immigrant students is 53<br />
points – still well over one year of schooling. Minority and immigrant groups with linguistic<br />
backgrounds different from the native language especially experience difficulties in language<br />
and reading development.<br />
Mean<br />
score<br />
550<br />
500<br />
450<br />
400<br />
350<br />
300<br />
%<br />
Finland<br />
40<br />
30<br />
20<br />
10<br />
0<br />
Canada<br />
Figure 2.5. Immigrant population<br />
Panel A. Trends of international migrants as a percentage of the total population<br />
New Zealand<br />
1990<br />
2000<br />
2010<br />
Panel B. Reading performance, by immigrant status<br />
All students Students without an immigrant background Second-generation students First-generation students<br />
Australia<br />
Netherlands<br />
Belgium<br />
Norway<br />
Estonia<br />
Switzerland<br />
United States<br />
Sweden<br />
Germany<br />
Ireland<br />
Notes: Panel A: International migrants are defined as individuals whose country of birth is not that in which they reside. Statlink:<br />
http://dx.doi.org/10.1787/888932320732. Panel B: Countries are ranked in descending order of the mean score of all students.<br />
Source: Panel A: United Nations Population Division (2008), International Migrant Stock: The 2008 Revision, online version,<br />
http://esa.un.org/migration/index.asp?panel=1, accessed June 2010 from OECD (2010), Trends Shaping Education 2010,<br />
OECD Publishing. doi: 10.1787/trends_edu-2010-en. Panel B: OECD PISA 2009 Database, Table II.4.1.<br />
France<br />
Denmark<br />
United Kingdom<br />
Hungary<br />
OECD average<br />
8<br />
6<br />
4<br />
2<br />
0<br />
Portugal<br />
Italy<br />
Slovenia<br />
Greece<br />
Spain<br />
Czech Republic<br />
Israel<br />
Luxembourg<br />
Austria<br />
Mexico