“Historia de la tributación en Ecuador: cambios sociales y ...
“Historia de la tributación en Ecuador: cambios sociales y ...
“Historia de la tributación en Ecuador: cambios sociales y ...

You also want an ePaper? Increase the reach of your titles
YUMPU automatically turns print PDFs into web optimized ePapers that Google loves.
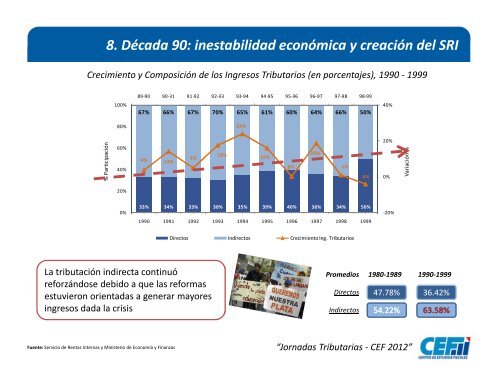
8. Década 90: inestabilidad económica y creación <strong>de</strong>l SRI<br />
Crecimi<strong>en</strong>to y Composición <strong>de</strong> los Ingresos Tributarios (<strong>en</strong> porc<strong>en</strong>tajes), 1990 - 1999<br />
% Participación<br />
100%<br />
80%<br />
60%<br />
40%<br />
20%<br />
67% 66% 67% 70% 65% 61% 60% 64% 66% 50%<br />
4% 14%<br />
La <strong>tributación</strong> indirecta continuó<br />
reforzándose <strong>de</strong>bido a que <strong>la</strong>s reformas<br />
estuvieron ori<strong>en</strong>tadas a g<strong>en</strong>erar mayores<br />
ingresos dada <strong>la</strong> crisis<br />
Fu<strong>en</strong>te: Servicio <strong>de</strong> R<strong>en</strong>tas Internas y Ministerio <strong>de</strong> Economía y Finanzas<br />
0%<br />
89-90 90-91 91-92 92-93 93-94 94-95 95-96 96-97 97-98 98-99<br />
5%<br />
18%<br />
24%<br />
33% 34% 33% 30% 35% 39% 40% 36% 34% 50%<br />
1990 1991 1992 1993 1994 1995 1996 1997 1998 1999<br />
16%<br />
0%<br />
19%<br />
Directos Indirectos Crecimi<strong>en</strong>to Ing. Tributarios<br />
1%<br />
Directos<br />
Indirectos<br />
-4%<br />
40%<br />
20%<br />
0%<br />
-20%<br />
47.78%<br />
54.22%<br />
Variación %<br />
Promedios 1980-1989 1990-1999<br />
“Jornadas Tributarias - CEF 2012”<br />
36.42%<br />
63.58%