

UNA DECADA DE HISTORIA Y ALGO MÁS… - Berabevú
UNA DECADA DE HISTORIA Y ALGO MÁS… - Berabevú
UNA DECADA DE HISTORIA Y ALGO MÁS… - Berabevú

Create successful ePaper yourself
Turn your PDF publications into a flip-book with our unique Google optimized e-Paper software.
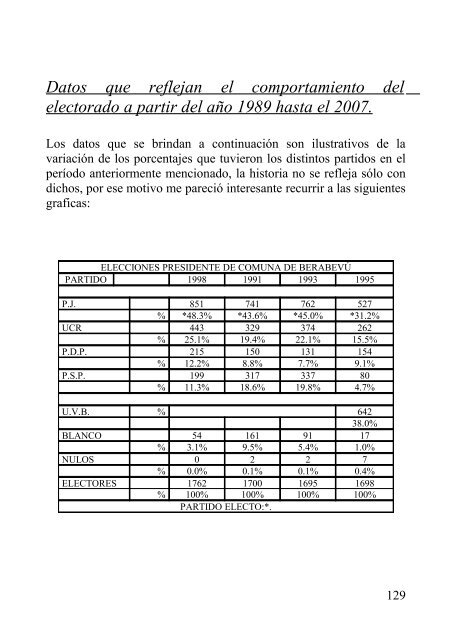
Datos que reflejan el comportamiento del<br />
electorado a partir del año 1989 hasta el 2007.<br />
Los datos que se brindan a continuación son ilustrativos de la<br />
variación de los porcentajes que tuvieron los distintos partidos en el<br />
período anteriormente mencionado, la historia no se refleja sólo con<br />
dichos, por ese motivo me pareció interesante recurrir a las siguientes<br />
graficas:<br />
ELECCIONES PRESI<strong>DE</strong>NTE <strong>DE</strong> COM<strong>UNA</strong> <strong>DE</strong> BERABEVÚ<br />
PARTIDO 1998 1991 1993 1995<br />
P.J. 851 741 762 527<br />
% *48.3% *43.6% *45.0% *31.2%<br />
UCR 443 329 374 262<br />
% 25.1% 19.4% 22.1% 15.5%<br />
P.D.P. 215 150 131 154<br />
% 12.2% 8.8% 7.7% 9.1%<br />
P.S.P. 199 317 337 80<br />
% 11.3% 18.6% 19.8% 4.7%<br />
U.V.B. % 642<br />
38.0%<br />
BLANCO 54 161 91 17<br />
% 3.1% 9.5% 5.4% 1.0%<br />
NULOS 0 2 2 7<br />
% 0.0% 0.1% 0.1% 0.4%<br />
ELECTORES 1762 1700 1695 1698<br />
% 100% 100% 100% 100%<br />
PARTIDO ELECTO:*.<br />
129