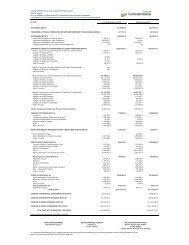
Con cifras comparativas al 31 de diciembre de 2010 - leasing ...
Con cifras comparativas al 31 de diciembre de 2010 - leasing ...
Con cifras comparativas al 31 de diciembre de 2010 - leasing ...

You also want an ePaper? Increase the reach of your titles
YUMPU automatically turns print PDFs into web optimized ePapers that Google loves.
<strong>Con</strong>sumo<br />
CIIU Capit<strong>al</strong> Garantía Provisión capit<strong>al</strong><br />
Activida<strong>de</strong>s auxiliares<br />
intermediación financiera $ 20.840 $ 41.700 $ 264<br />
Activida<strong>de</strong>s inmobiliarias,<br />
empresari<strong>al</strong>es y <strong>al</strong>quiler 28.880 66.900 606<br />
Agropecuaria silvicultura y<br />
pesca 19.530 54.500 247<br />
Alimentos 19.832 43.000 416<br />
Comercio <strong>al</strong> por mayor,<br />
comisión por contrata 330.098 528.350 4.174<br />
Comercio <strong>al</strong> por menor,<br />
excepto el comercio <strong>de</strong><br />
vehículos 83.862 167.020 1.060<br />
Fabricación <strong>de</strong> muebles -<br />
industrias manufactureras 1.821 53.200 23<br />
Financiación <strong>de</strong> planes <strong>de</strong><br />
seguros y pensiones 60.000 95.300 759<br />
Hoteles restaurantes 22.482 121.180 284<br />
Minero 78.728 93.820 7.574<br />
Otra clasificación 964.980 2.134.543 17.169<br />
Otras activida<strong>de</strong>s empresari<strong>al</strong>es 192.753 270.747 2.662<br />
Servicios soci<strong>al</strong>es y <strong>de</strong> s<strong>al</strong>ud 168.221 507.750 $4.995<br />
Textiles prendas <strong>de</strong> vestir y<br />
cuero 177.835 204.462 2.249<br />
Transporte, <strong>al</strong>macén y<br />
comunicaciones 64.741 145.100 1.097<br />
TOTAL $ 2.234.603 $ 4.527.572 $ 43.579<br />
TOTAL $ 542.989.437 $ 764.473.237 $ 21.585.267<br />
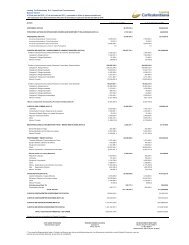
3. Por Zona Geográfica<br />
Comerci<strong>al</strong><br />
Zona Geográfica Capit<strong>al</strong> V<strong>al</strong>or Garantía Provisión Capit<strong>al</strong><br />
Centr<strong>al</strong> $ 329.340.904 $ 455.512.095 $ 13.705.593<br />
Nor Occi<strong>de</strong>nt<strong>al</strong> 125.649.079 178.213.514 4.341.948<br />
Sur Occi<strong>de</strong>nt<strong>al</strong> 85.764.851 126.220.056 3.494.147<br />
TOTAL $ 540.754.834 $ 759.945.665 $ 21.541.688<br />
<strong>Con</strong>sumo<br />
Zona Geográfica Capit<strong>al</strong> V<strong>al</strong>or Garantía Provisión Capit<strong>al</strong><br />
Centr<strong>al</strong> $ 64.418 $ 222.200 $ 2.393<br />
Nor Occi<strong>de</strong>nt<strong>al</strong> 78.728 93.820 7.574<br />
Sur Occi<strong>de</strong>nt<strong>al</strong> 2.091.457 4.211.552 33.612<br />
Notas a los Estados Financieros <strong>al</strong> 30 <strong>de</strong> junio <strong>de</strong> 2011 (con <strong>cifras</strong> <strong>comparativas</strong> <strong>al</strong> <strong>31</strong> <strong>de</strong> <strong>diciembre</strong> <strong>de</strong> <strong>2010</strong>)