Producto Interno Bruto por entidad federativa 2006-2010 - Inegi
Producto Interno Bruto por entidad federativa 2006-2010 - Inegi
Producto Interno Bruto por entidad federativa 2006-2010 - Inegi

Create successful ePaper yourself
Turn your PDF publications into a flip-book with our unique Google optimized e-Paper software.
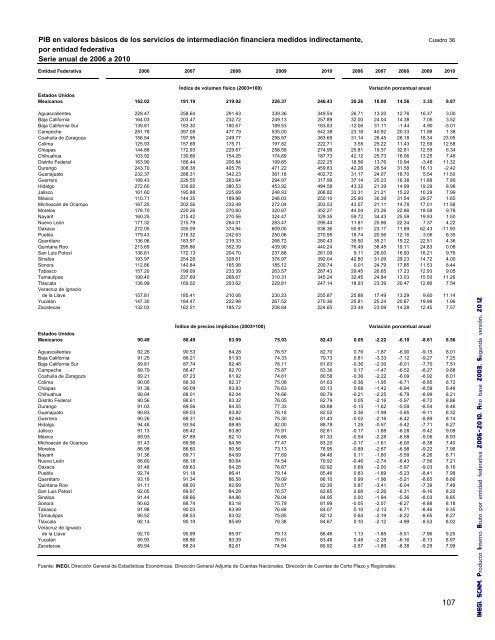
PIB en valores básicos de los servicios de intermediación financiera medidos indirectamente, Cuadro 36<br />
<strong>por</strong> <strong>entidad</strong> <strong>federativa</strong><br />
Serie anual de <strong>2006</strong> a <strong>2010</strong><br />
Entidad Federativa <strong>2006</strong> 2007 2008 2009 <strong>2010</strong> <strong>2006</strong> 2007 2008 2009 <strong>2010</strong><br />
Índice de volumen físico (2003=100)<br />
Variación <strong>por</strong>centual anual<br />
Estados Unidos<br />
Mexicanos 162.02 191.19 219.02 226.37 246.43 20.26 18.00 14.56 3.35 8.87<br />
Aguascalientes 228.47 258.64 291.63 339.36 349.54 26.71 13.20 12.76 16.37 3.00<br />
Baja California 164.03 203.47 232.72 249.13 257.89 32.00 24.04 14.38 7.05 3.52<br />
Baja California Sur 139.81 183.30 180.67 189.53 183.83 -12.06 31.11 -1.44 4.90 -3.01<br />
Campeche 281.78 397.08 477.79 535.00 542.38 23.16 40.92 20.33 11.98 1.38<br />
Coahuila de Zaragoza 156.54 197.95 249.77 295.57 363.69 31.14 26.45 26.18 18.34 23.05<br />
Colima 125.93 157.69 175.71 197.82 222.71 3.55 25.22 11.43 12.59 12.58<br />
Chiapas 144.88 172.93 229.67 258.58 274.99 25.81 19.37 32.81 12.59 6.34<br />
Chihuahua 103.92 130.66 154.25 174.69 187.73 42.12 25.73 18.06 13.25 7.46<br />
Distrito Federal 163.90 186.44 206.84 199.65 222.25 18.56 13.76 10.94 -3.48 11.32<br />
Durango 243.70 308.38 405.76 471.22 459.83 42.26 26.54 31.58 16.13 -2.42<br />
Guanajuato 232.37 288.31 342.23 361.18 402.72 31.17 24.07 18.70 5.54 11.50<br />
Guerrero 188.43 226.55 263.64 294.97 317.99 37.14 20.23 16.38 11.88 7.80<br />
Hidalgo 272.60 330.92 380.53 453.92 494.58 43.32 21.39 14.99 19.29 8.96<br />
Jalisco 161.60 195.88 225.69 248.93 268.82 33.31 21.21 15.22 10.29 7.99<br />
México 110.71 144.35 189.88 246.03 250.10 25.90 30.39 31.54 29.57 1.65<br />
Michoacán de Ocampo 167.25 202.56 232.49 272.04 303.53 43.07 21.11 14.78 17.01 11.58<br />
Morelos 178.70 220.26 270.60 320.87 352.27 44.04 23.26 22.86 18.58 9.78<br />
Nayarit 160.25 215.42 270.56 324.47 329.35 59.72 34.43 25.59 19.93 1.50<br />
Nuevo León 171.32 215.79 264.01 283.47 295.44 11.81 25.96 22.34 7.37 4.22<br />
Oaxaca 272.05 335.09 374.94 609.00 536.36 50.91 23.17 11.89 62.43 -11.93<br />
Puebla 179.43 216.32 242.63 250.06 270.95 18.74 20.56 12.16 3.06 8.35<br />
Querétaro 136.06 183.97 219.33 268.72 280.43 35.50 35.21 19.22 22.51 4.36<br />
Quintana Roo 213.69 295.86 352.39 439.90 440.24 76.49 38.45 19.11 24.83 0.08<br />
San Luis Potosí 136.61 172.13 204.70 237.88 261.09 9.11 26.00 18.93 16.21 9.76<br />
Sinaloa 193.97 254.28 328.61 376.97 392.04 42.80 31.09 29.23 14.72 4.00<br />
Sonora 112.86 140.84 165.98 185.12 200.74 0.01 24.79 17.85 11.53 8.44<br />
Tabasco 157.20 199.09 233.39 263.57 287.43 29.45 26.65 17.23 12.93 9.05<br />
Tamaulipas 190.40 237.69 268.67 310.31 345.24 32.45 24.84 13.03 15.50 11.26<br />
Tlaxcala 136.99 169.02 203.62 229.81 247.14 18.93 23.39 20.47 12.86 7.54<br />
Veracruz de Ignacio<br />
de la Llave 157.81 185.41 210.06 230.23 255.87 25.88 17.49 13.29 9.60 11.14<br />
Yucatán 147.30 184.47 222.98 267.52 270.36 25.81 25.24 20.87 19.98 1.06<br />
Zacatecas 132.03 162.51 185.72 208.84 224.65 23.44 23.09 14.28 12.45 7.57<br />
Índice de precios implícitos (2003=100)<br />
Variación <strong>por</strong>centual anual<br />
Estados Unidos<br />
Mexicanos 90.49 88.49 83.09 75.93 82.43 0.05 -2.22 -6.10 -8.61 8.56<br />
Aguascalientes 92.26 90.53 84.28 76.57 82.70 0.76 -1.87 -6.90 -9.15 8.01<br />
Baja California 91.25 88.21 81.93 74.33 79.73 0.81 -3.33 -7.12 -9.27 7.25<br />
Baja California Sur 89.81 87.74 82.46 76.11 81.83 -0.36 -2.30 -6.01 -7.70 7.51<br />
Campeche 89.79 88.47 82.70 75.87 83.36 0.17 -1.47 -6.52 -8.27 9.88<br />
Coahuila de Zaragoza 89.21 87.23 81.92 74.61 80.58 -0.36 -2.22 -6.09 -8.92 8.01<br />
Colima 90.05 88.30 82.37 75.08 81.63 -0.36 -1.95 -6.71 -8.85 8.72<br />
Chiapas 91.38 90.09 83.83 76.63 83.13 0.68 -1.42 -6.94 -8.59 8.48<br />
Chihuahua 90.04 88.01 82.04 74.66 80.79 -0.21 -2.25 -6.79 -8.99 8.21<br />
Distrito Federal 90.56 88.61 83.32 76.05 82.79 0.05 -2.16 -5.97 -8.72 8.86<br />
Durango 91.03 89.56 84.55 77.33 83.88 -0.15 -1.62 -5.59 -8.54 8.46<br />
Guanajuato 90.83 89.03 83.82 76.18 82.52 0.36 -1.99 -5.85 -9.11 8.32<br />
Guerrero 90.26 88.31 82.64 75.30 81.43 -0.02 -2.16 -6.42 -8.89 8.14<br />
Hidalgo 94.48 93.94 88.85 82.00 88.78 1.25 -0.57 -5.42 -7.71 8.27<br />
Jalisco 91.13 89.42 83.80 75.91 82.81 -0.17 -1.88 -6.28 -9.42 9.09<br />
México 89.93 87.89 82.10 74.66 81.33 -0.54 -2.28 -6.58 -9.06 8.93<br />
Michoacán de Ocampo 91.43 89.96 84.56 77.47 83.20 -0.17 -1.61 -6.00 -8.38 7.40<br />
Morelos 88.98 86.60 80.56 73.13 78.95 -0.89 -2.67 -6.98 -9.22 7.96<br />
Nayarit 91.36 89.71 84.69 77.69 84.46 0.11 -1.80 -5.59 -8.26 8.71<br />
Nuevo León 88.60 86.18 80.64 74.54 79.92 -0.46 -2.74 -6.43 -7.56 7.21<br />
Oaxaca 91.46 89.63 84.28 76.67 82.92 0.69 -2.00 -5.97 -9.03 8.16<br />
Puebla 92.74 91.18 86.41 79.14 85.46 0.83 -1.69 -5.23 -8.41 7.98<br />
Querétaro 93.16 91.34 86.58 79.09 86.10 0.99 -1.96 -5.21 -8.65 8.86<br />
Quintana Roo 91.11 88.00 82.69 76.57 82.30 0.87 -3.41 -6.04 -7.39 7.49<br />
San Luis Potosí 92.05 89.97 84.29 76.57 82.85 0.66 -2.26 -6.31 -9.16 8.20<br />
Sinaloa 91.44 89.66 84.86 78.04 84.95 0.00 -1.94 -5.36 -8.03 8.85<br />
Sonora 90.62 88.74 83.18 75.79 81.99 -0.05 -2.07 -6.27 -8.88 8.18<br />
Tabasco 91.98 90.03 83.99 76.88 84.07 0.10 -2.13 -6.71 -8.46 9.35<br />
Tamaulipas 90.52 88.53 83.02 75.85 82.12 0.64 -2.19 -6.22 -8.65 8.27<br />
Tlaxcala 92.14 90.19 85.69 78.38 84.67 0.10 -2.12 -4.99 -8.53 8.02<br />
Veracruz de Ignacio<br />
de la Llave 92.70 90.99 85.97 79.13 86.46 1.13 -1.85 -5.51 -7.96 9.25<br />
Yucatán 90.93 88.86 83.39 76.61 83.48 0.48 -2.28 -6.16 -8.13 8.97<br />
Zacatecas 89.94 88.24 82.61 74.94 80.92 -0.57 -1.89 -6.38 -9.29 7.99<br />
Fuente: INEGI. Dirección General de Estadísticas Económicas. Dirección General Adjunta de Cuentas Nacionales. Dirección de Cuentas de Corto Plazo y Regionales.<br />
107<br />
INEGI. SCNM. <strong>Producto</strong> <strong>Interno</strong> <strong>Bruto</strong> <strong>por</strong> <strong>entidad</strong> <strong>federativa</strong> <strong>2006</strong>-<strong>2010</strong>. Año base 2003. Segunda versión. 2012