Producto Interno Bruto por entidad federativa 2006-2010 - Inegi
Producto Interno Bruto por entidad federativa 2006-2010 - Inegi
Producto Interno Bruto por entidad federativa 2006-2010 - Inegi

Create successful ePaper yourself
Turn your PDF publications into a flip-book with our unique Google optimized e-Paper software.
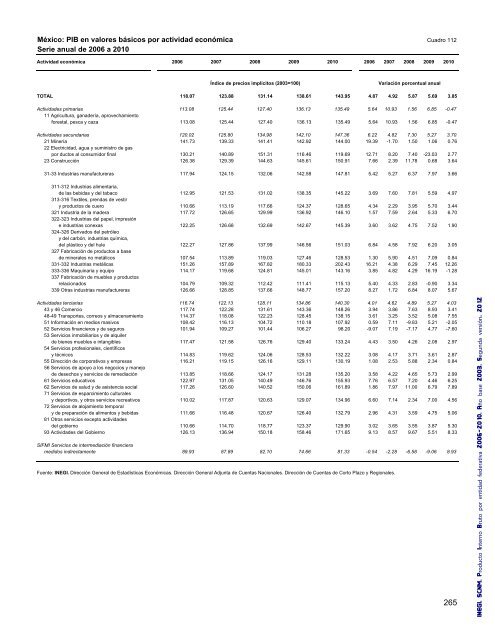
México: PIB en valores básicos <strong>por</strong> actividad económica Cuadro 112<br />
Serie anual de <strong>2006</strong> a <strong>2010</strong><br />
Actividad económica<br />
<strong>2006</strong> 2007 2008 2009<br />
<strong>2010</strong> <strong>2006</strong> 2007 2008 2009 <strong>2010</strong><br />
Índice de precios implícitos (2003=100) Variación <strong>por</strong>centual anual<br />
TOTAL 118.07 123.88 131.14 138.61 143.95 4.87 4.92 5.87 5.69 3.85<br />
Actividades primarias 113.08 125.44 127.40 136.13 135.49 5.64 10.93 1.56 6.85 -0.47<br />
11 Agricultura, ganadería, aprovechamiento<br />
forestal, pesca y caza 113.08 125.44 127.40 136.13 135.49 5.64 10.93 1.56 6.85 -0.47<br />
Actividades secundarias 120.02 125.80 134.98 142.10 147.36 6.22 4.82 7.30 5.27 3.70<br />
21 Minería 141.73 139.33 141.41 142.92 144.00 19.39 -1.70 1.50 1.06 0.76<br />
22 Electricidad, agua y suministro de gas<br />
<strong>por</strong> ductos al consumidor final 130.21 140.89 151.31 116.46 119.69 12.71 8.20 7.40 -23.03 2.77<br />
23 Construcción 126.38 129.39 144.63 145.61 150.91 7.66 2.39 11.78 0.68 3.64<br />
31-33 Industrias manufactureras 117.94 124.15 132.06 142.58 147.81 5.42 5.27 6.37 7.97 3.66<br />
311-312 Industrias alimentaria,<br />
de las bebidas y del tabaco 112.95 121.53 131.02 138.35 145.22 3.69 7.60 7.81 5.59 4.97<br />
313-316 Textiles, prendas de vestir<br />
y productos de cuero 110.66 113.19 117.66 124.37 128.65 4.34 2.29 3.95 5.70 3.44<br />
321 Industria de la madera 117.72 126.65 129.99 136.92 146.10 1.57 7.59 2.64 5.33 6.70<br />
322-323 Industrias del papel, impresión<br />
e industrias conexas 122.25 126.68 132.69 142.67 145.39 3.60 3.62 4.75 7.52 1.90<br />
324-326 Derivados del petróleo<br />
y del carbón, industrias química,<br />
del plástico y del hule 122.27 127.86 137.99 146.56 151.03 6.84 4.58 7.92 6.20 3.05<br />
327 Fabricación de productos a base<br />
de minerales no metálicos 107.54 113.89 119.03 127.46 128.53 1.30 5.90 4.51 7.09 0.84<br />
331-332 Industrias metálicas 151.26 157.89 167.82 180.33 202.43 16.21 4.38 6.29 7.45 12.26<br />
333-336 Maquinaria y equipo 114.17 119.68 124.81 145.01 143.16 3.85 4.82 4.29 16.19 -1.28<br />
337 Fabricación de muebles y productos<br />
relacionados 104.79 109.32 112.42 111.41 115.13 5.40 4.33 2.83 -0.90 3.34<br />
339 Otras industrias manufactureras 126.66 128.85 137.66 148.77 157.20 8.27 1.72 6.84 8.07 5.67<br />
Actividades terciarias 116.74 122.13 128.11 134.86 140.30 4.01 4.62 4.89 5.27 4.03<br />
43 y 46 Comercio 117.74 122.28 131.61 143.36 148.26 3.94 3.86 7.63 8.93 3.41<br />
48-49 Trans<strong>por</strong>tes, correos y almacenamiento 114.37 118.08 122.23 128.45 138.15 3.61 3.25 3.52 5.08 7.55<br />
51 Información en medios masivos 108.42 116.13 104.72 110.18 107.92 0.59 7.11 -9.83 5.21 -2.05<br />
52 Servicios financieros y de seguros 101.94 109.27 101.44 106.27 98.20 -9.07 7.19 -7.17 4.77 -7.60<br />
53 Servicios inmobiliarios y de alquiler<br />
de bienes muebles e intangibles 117.47 121.58 126.76 129.40 133.24 4.43 3.50 4.26 2.08 2.97<br />
54 Servicios profesionales, científicos<br />
y técnicos 114.83 119.62 124.06 128.53 132.22 3.08 4.17 3.71 3.61 2.87<br />
55 Dirección de cor<strong>por</strong>ativos y empresas 116.21 119.15 126.16 129.11 130.19 1.08 2.53 5.88 2.34 0.84<br />
56 Servicios de apoyo a los negocios y manejo<br />
de desechos y servicios de remediación 113.85 118.66 124.17 131.28 135.20 3.58 4.22 4.65 5.73 2.99<br />
61 Servicios educativos 122.97 131.05 140.49 146.76 155.93 7.76 6.57 7.20 4.46 6.25<br />
62 Servicios de salud y de asistencia social 117.26 126.60 140.52 150.06 161.89 1.86 7.97 11.00 6.79 7.89<br />
71 Servicios de esparcimiento culturales<br />
y de<strong>por</strong>tivos, y otros servicios recreativos 110.02 117.87 120.63 129.07 134.96 6.60 7.14 2.34 7.00 4.56<br />
72 Servicios de alojamiento tem<strong>por</strong>al<br />
y de preparación de alimentos y bebidas 111.66 116.48 120.67 126.40 132.79 2.96 4.31 3.59 4.75 5.06<br />
81 Otros servicios excepto actividades<br />
del gobierno 110.66 114.70 118.77 123.37 129.90 3.02 3.65 3.55 3.87 5.30<br />
93 Actividades del Gobierno 126.13 136.94 150.18 158.46 171.65 9.13 8.57 9.67 5.51 8.33<br />
SIFMI Servicios de intermediación financiera<br />
medidos indirectamente 89.93 87.89 82.10 74.66 81.33 -0.54 -2.28 -6.58 -9.06 8.93<br />
Fuente: INEGI. Dirección General de Estadísticas Económicas. Dirección General Adjunta de Cuentas Nacionales. Dirección de Cuentas de Corto Plazo y Regionales.<br />
265<br />
INEGI. SCNM. <strong>Producto</strong> <strong>Interno</strong> <strong>Bruto</strong> <strong>por</strong> <strong>entidad</strong> <strong>federativa</strong> <strong>2006</strong>-<strong>2010</strong>. Año base 2003. Segunda versión. 2012