Representación gráfica de funciones - Amolasmates
Representación gráfica de funciones - Amolasmates
Representación gráfica de funciones - Amolasmates
SHOW LESS

Create successful ePaper yourself
Turn your PDF publications into a flip-book with our unique Google optimized e-Paper software.
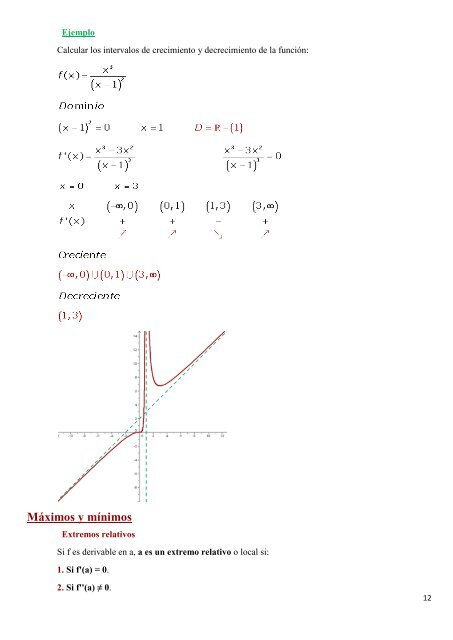
Ejemplo<br />
Calcular los intervalos <strong>de</strong> crecimiento y <strong>de</strong>crecimiento <strong>de</strong> la función:<br />
Máximos y mínimos<br />
Extremos relativos<br />
Si f es <strong>de</strong>rivable en a, a es un extremo relativo o local si:<br />
1. Si f'(a) = 0.<br />
2. Si f''(a) ≠ 0.<br />
12