Capítulo 2 - Línea Base - SEA - Servicio de evaluación ambiental
Capítulo 2 - Línea Base - SEA - Servicio de evaluación ambiental
Capítulo 2 - Línea Base - SEA - Servicio de evaluación ambiental

Create successful ePaper yourself
Turn your PDF publications into a flip-book with our unique Google optimized e-Paper software.
2.5.1.3.2<br />
Octopus<br />
LNG<br />
Estudio o <strong>de</strong> Impacto Ammbiental<br />
- Termminal<br />
Marítimo Octopus LNG,<br />
Bahía <strong>de</strong> Conncepción,<br />
VIII RRegión<br />
<strong>Capítulo</strong><br />
2 - <strong>Línea</strong> <strong>Base</strong> - 19-03-2013<br />
Meteorolo ogía<br />
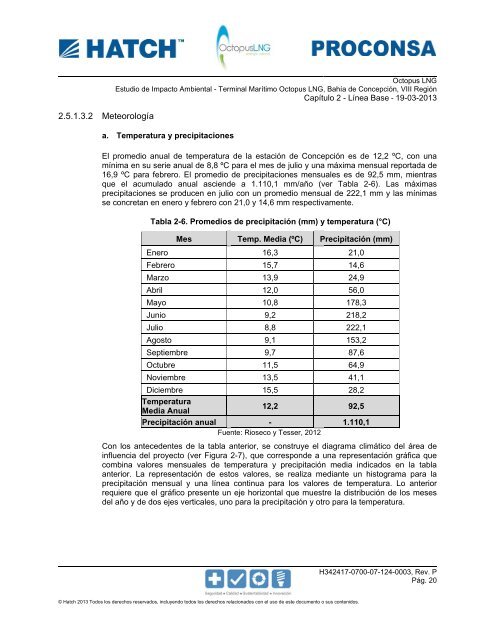
a. Tempe eratura y preecipitacioness<br />
El promed dio anual <strong>de</strong> temperatura <strong>de</strong> la estacióón<br />
<strong>de</strong> Conceepción<br />
es <strong>de</strong> 12,2 ºC, conn<br />
una<br />
mínima en n su serie anuual<br />
<strong>de</strong> 8,8 ºC para el mes d<strong>de</strong><br />
julio y unaa<br />
máxima mennsual<br />
reportada<br />
<strong>de</strong><br />
16,9 ºC pa ara febrero. EEl<br />
promedio <strong>de</strong> precipitacciones<br />
mensuuales<br />
es <strong>de</strong> 992,5<br />
mm, mieentras<br />
que el ac cumulado annual<br />
ascien<strong>de</strong><br />
a 1.110,1 mm/año (vver<br />
Tabla 2-6).<br />
Las máxximas<br />
precipitacio ones se prodducen<br />
en julioo<br />
con un prommedio<br />
mensuual<br />
<strong>de</strong> 222,1 mm y las mínnimas<br />
se concret tan en enero y febrero conn<br />
21,0 y 14,6 mmm<br />
respectivvamente.<br />
Tabla 2-66.<br />
Promedioss<br />
<strong>de</strong> precipitaación<br />
(mm) y temperaturaa<br />
(°C)<br />
Mees<br />
Temp. Meddia<br />
(ºC) PPrecipitaciónn<br />
(mm)<br />
Enero<br />
16,33<br />
Febrero<br />
15,77<br />
Marzo<br />
13,99<br />
Abril<br />
12,00<br />
Mayo<br />
10,88<br />
Junio<br />
9,2<br />
Julio<br />
8,8<br />
Agosto<br />
9,1<br />
Septiembree<br />
9,7<br />
Octubre<br />
11,55<br />
Noviembree<br />
13,55<br />
Diciembre<br />
15,55<br />
Temperaturra<br />
Media Anuaal<br />
12,22<br />
Precipitacióón<br />
anual<br />
-<br />
Fuennte:<br />
Rioseco y Tesser, 2012<br />
21,0<br />
14,6<br />
24,9<br />
56,0<br />
178,3<br />
218,2<br />
222,1<br />
153,2<br />
87,6<br />
64,9<br />
41,1<br />
28,2<br />
Con los antece<strong>de</strong>ntes<br />
<strong>de</strong> la tabla aanterior,<br />
se cconstruye<br />
el ddiagrama<br />
climmático<br />
<strong>de</strong>l áreea<br />
<strong>de</strong><br />
influencia <strong>de</strong>l proyecto (ver Figura 22-7),<br />
que corrrespon<strong>de</strong><br />
a uuna<br />
represenntación<br />
gráficaa<br />
que<br />
combina valores v menssuales<br />
<strong>de</strong> temperatura<br />
y precipitaciónn<br />
media indiccados<br />
en la tabla<br />
anterior. La L representaación<br />
<strong>de</strong> estoos<br />
valores, sse<br />
realiza meediante<br />
un hhistograma<br />
paara<br />
la<br />
precipitació ón mensual y una línea continua para<br />
los valorees<br />
<strong>de</strong> temperratura.<br />
Lo annterior<br />
requiere que<br />
el gráfico presente un eje horizontaal<br />
que muesttre<br />
la distribución<br />
<strong>de</strong> los mmeses<br />
<strong>de</strong>l año y <strong>de</strong> d dos ejes veerticales,<br />
unoo<br />
para la preccipitación<br />
y otrro<br />
para la temmperatura.<br />
© Hatch 2013 Todos<br />
los <strong>de</strong>rechos res servados, incluyendo ttodos<br />
los <strong>de</strong>rechos rellacionados<br />
con el uso <strong>de</strong> este documento o sus contenidos.<br />
92,5<br />
1.110,1<br />
HH342417-0700<br />
07-124-0003, RRev.<br />
P<br />
PPág.<br />
20