La obeSidad coMo pandeMia de SigLo XXi - Acta Sanitaria
La obeSidad coMo pandeMia de SigLo XXi - Acta Sanitaria
La obeSidad coMo pandeMia de SigLo XXi - Acta Sanitaria

Create successful ePaper yourself
Turn your PDF publications into a flip-book with our unique Google optimized e-Paper software.
86<br />
LA oBESiDAD CoMo pAnDEMiA DE <strong>SigLo</strong> <strong>XXi</strong>. Una perspectiva epi<strong>de</strong>miológica <strong>de</strong>s<strong>de</strong> iberoamérica<br />
Este biotipo encubre contextos que dificultan analogías con personas <strong>de</strong> otras<br />
regiones geográficas ya que la estatura baja pue<strong>de</strong> modificar los resultados al ser<br />
encarados con los otros valores: edad y peso.<br />
En este mismo cuadro se exponen los resultados obtenidos y publicados por varios<br />
investigadores en los cuales se señala la magnitud <strong>de</strong>l sobrepeso y obesidad en la edad<br />
adulta, promedios <strong>de</strong> talla baja para mujeres en edad fértil se mantienen casi sin modificación,<br />
por el contrario el índice <strong>de</strong> masa corporal 5, 6, 34 (IMC) se ha incrementado<br />
y el porcentaje <strong>de</strong> mujeres que se encuentran por <strong>de</strong>bajo <strong>de</strong> 18,5 <strong>de</strong> IMC, que <strong>de</strong>nota<br />
<strong>de</strong>snutrición, ha disminuido a 0,9%. No se encontraron datos comparativos <strong>de</strong> nivel<br />
nacional para evaluar el estado nutricional <strong>de</strong> la población adulta masculina, sin embargo<br />
parecería que es un problema creciente, sobretodo en el oriente <strong>de</strong>l país.<br />
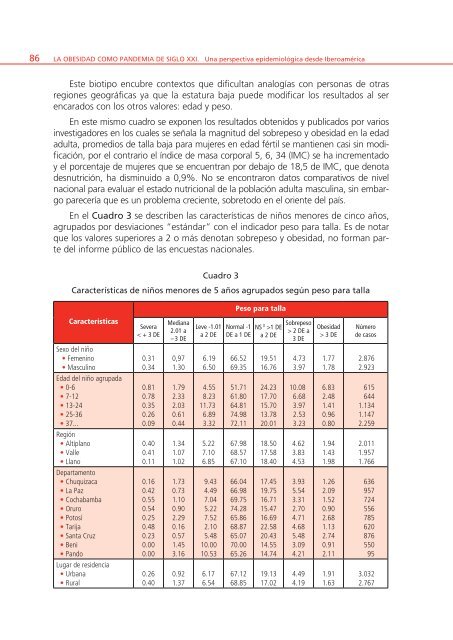
En el Cuadro 3 se <strong>de</strong>scriben las características <strong>de</strong> niños menores <strong>de</strong> cinco años,<br />
agrupados por <strong>de</strong>sviaciones “estándar” con el indicador peso para talla. Es <strong>de</strong> notar<br />
que los valores superiores a 2 o más <strong>de</strong>notan sobrepeso y obesidad, no forman parte<br />
<strong>de</strong>l informe público <strong>de</strong> las encuestas nacionales.<br />
Cuadro 3<br />
Características <strong>de</strong> niños menores <strong>de</strong> 5 años agrupados según peso para talla<br />
Características<br />
Sexo <strong>de</strong>l niño<br />
• Femenino<br />
• Masculino<br />
Edad <strong>de</strong>l niño agrupada<br />
• 0-6<br />
• 7-12<br />
• 13-24<br />
• 25-36<br />
• 37...<br />
Región<br />
• Altiplano<br />
• Valle<br />
• Llano<br />
Departamento<br />
• Chuquizaca<br />
• <strong>La</strong> Paz<br />
• Cochabamba<br />
• Oruro<br />
• Potosí<br />
• Tarija<br />
• Santa Cruz<br />
• Beni<br />
• Pando<br />
Lugar <strong>de</strong> resi<strong>de</strong>ncia<br />
• Urbana<br />
• Rural<br />
Severa<br />
< + 3 DE<br />
0.31<br />
0.34<br />
0.81<br />
0.78<br />
0.35<br />
0.26<br />
0.09<br />
0.40<br />
0.41<br />
0.11<br />
0.16<br />
0.42<br />
0.55<br />
0.54<br />
0.25<br />
0.48<br />
0.23<br />
0.00<br />
0.00<br />
0.26<br />
0.40<br />
Mediana<br />
2.01 a<br />
– 3 DE<br />
0,97<br />
1.30<br />
1.79<br />
2.33<br />
2.03<br />
0.61<br />
0.44<br />
1.34<br />
1.07<br />
1.02<br />
1.73<br />
0.73<br />
1.10<br />
0.90<br />
2.29<br />
0.16<br />
0.57<br />
1.45<br />
3.16<br />
0.92<br />
1.37<br />
Leve -1.01<br />
a 2 DE<br />
6.19<br />
6.50<br />
4.55<br />
8.23<br />
11.73<br />
6.89<br />
3.32<br />
5.22<br />
7.10<br />
6.85<br />
9.43<br />
4.49<br />
7.04<br />
5.22<br />
7.52<br />
2.10<br />
5.48<br />
10.00<br />
10.53<br />
6.17<br />
6.54<br />
Peso para talla<br />
Normal -1 NS<br />
DE a 1 DE<br />
3 Sobrepeso<br />
>1 DE<br />
> 2 DE a<br />
a 2 DE<br />
3 DE<br />
66.52<br />
69.35<br />
51.71<br />
61.80<br />
64.81<br />
74.98<br />
72.11<br />
67.98<br />
68.57<br />
67.10<br />
66.04<br />
66.98<br />
69.75<br />
74.28<br />
65.86<br />
68.87<br />
65.07<br />
70.00<br />
65.26<br />
67.12<br />
68.85<br />
19.51<br />
16.76<br />
24.23<br />
17.70<br />
15.70<br />
13.78<br />
20.01<br />
18.50<br />
17.58<br />
18.40<br />
17.45<br />
19.75<br />
16.71<br />
15.47<br />
16.69<br />
22.58<br />
20.43<br />
14.55<br />
14.74<br />
19.13<br />
17.02<br />
4.73<br />
3.97<br />
10.08<br />
6.68<br />
3.97<br />
2.53<br />
3.23<br />
4.62<br />
3.83<br />
4.53<br />
3.93<br />
5.54<br />
3.31<br />
2.70<br />
4.71<br />
4.68<br />
5.48<br />
3.09<br />
4.21<br />
4.49<br />
4.19<br />
Obesidad<br />
> 3 DE<br />
1.77<br />
1.78<br />
6.83<br />
2.48<br />
1.41<br />
0.96<br />
0.80<br />
1.94<br />
1.43<br />
1.98<br />
1.26<br />
2.09<br />
1.52<br />
0.90<br />
2.68<br />
1.13<br />
2.74<br />
0.91<br />
2.11<br />
1.91<br />
1.63<br />
Número<br />
<strong>de</strong> casos<br />
2.876<br />
2.923<br />
615<br />
644<br />
1.134<br />
1.147<br />
2.259<br />
2.011<br />
1.957<br />
1.766<br />
636<br />
957<br />
724<br />
556<br />
785<br />
620<br />
876<br />
550<br />
95<br />
3.032<br />
2.767