Informe anual sobre la situación y evolución de la ejecución ...
Informe anual sobre la situación y evolución de la ejecución ...
Informe anual sobre la situación y evolución de la ejecución ...

You also want an ePaper? Increase the reach of your titles
YUMPU automatically turns print PDFs into web optimized ePapers that Google loves.
9 <strong>Informe</strong> <strong>anual</strong> <strong>sobre</strong> <strong>la</strong> <strong>situación</strong> y <strong>evolución</strong> <strong>de</strong> <strong>la</strong> <strong>ejecución</strong> presupuestaria 2012<br />
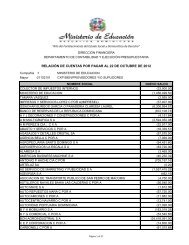
En otro or<strong>de</strong>n, <strong>la</strong> <strong>ejecución</strong> en función <strong>de</strong> <strong>la</strong>s unida<strong>de</strong>s ejecutoras y <strong>de</strong> los libramientos aprobados alcanzó<br />
un monto <strong>de</strong> RD$50,018 millones, siendo responsable el Ministerio <strong>de</strong> Educación <strong>de</strong>l 97.93% <strong>de</strong> los recursos<br />
ejecutados, mientras que <strong>la</strong> Oficina Coordinadora <strong>de</strong> Proyecto Internacional sólo ejecutó el 2.07 por ciento.<br />
1.4 Análisis Presupuestario por Objeto <strong>de</strong> Gasto<br />
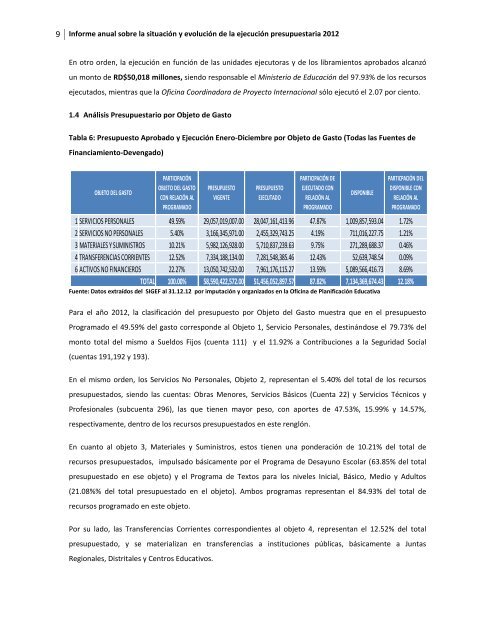
Tab<strong>la</strong> 6: Presupuesto Aprobado y Ejecución Enero-Diciembre por Objeto <strong>de</strong> Gasto (Todas <strong>la</strong>s Fuentes <strong>de</strong><br />
Financiamiento-Devengado)<br />
OBJETO DEL GASTO<br />
Fuente: Datos extraídos <strong>de</strong>l SIGEF al 31.12.12 por imputación y organizados en <strong>la</strong> Oficina <strong>de</strong> P<strong>la</strong>nificación Educativa<br />
Para el año 2012, <strong>la</strong> c<strong>la</strong>sificación <strong>de</strong>l presupuesto por Objeto <strong>de</strong>l Gasto muestra que en el presupuesto<br />
Programado el 49.59% <strong>de</strong>l gasto correspon<strong>de</strong> al Objeto 1, Servicio Personales, <strong>de</strong>stinándose el 79.73% <strong>de</strong>l<br />
monto total <strong>de</strong>l mismo a Sueldos Fijos (cuenta 111) y el 11.92% a Contribuciones a <strong>la</strong> Seguridad Social<br />
(cuentas 191,192 y 193).<br />
PARTICIPACIÓN<br />
OBJETO DEL GASTO<br />
CON RELACIÓN AL<br />
PROGRAMADO<br />
En el mismo or<strong>de</strong>n, los Servicios No Personales, Objeto 2, representan el 5.40% <strong>de</strong>l total <strong>de</strong> los recursos<br />
presupuestados, siendo <strong>la</strong>s cuentas: Obras Menores, Servicios Básicos (Cuenta 22) y Servicios Técnicos y<br />
Profesionales (subcuenta 296), <strong>la</strong>s que tienen mayor peso, con aportes <strong>de</strong> 47.53%, 15.99% y 14.57%,<br />
respectivamente, <strong>de</strong>ntro <strong>de</strong> los recursos presupuestados en este renglón.<br />
En cuanto al objeto 3, Materiales y Suministros, estos tienen una pon<strong>de</strong>ración <strong>de</strong> 10.21% <strong>de</strong>l total <strong>de</strong><br />
recursos presupuestados, impulsado básicamente por el Programa <strong>de</strong> Desayuno Esco<strong>la</strong>r (63.85% <strong>de</strong>l total<br />
presupuestado en ese objeto) y el Programa <strong>de</strong> Textos para los niveles Inicial, Básico, Medio y Adultos<br />
(21.08%% <strong>de</strong>l total presupuestado en el objeto). Ambos programas representan el 84.93% <strong>de</strong>l total <strong>de</strong><br />
recursos programado en este objeto.<br />
Por su <strong>la</strong>do, <strong>la</strong>s Transferencias Corrientes correspondientes al objeto 4, representan el 12.52% <strong>de</strong>l total<br />
presupuestado, y se materializan en transferencias a instituciones públicas, básicamente a Juntas<br />
Regionales, Distritales y Centros Educativos.<br />
PRESUPUESTO<br />
VIGENTE<br />
PRESUPUESTO<br />
EJECUTADO<br />
PARTICIPACIÓN DE<br />
EJECUTADO CON<br />
RELACIÓN AL<br />
PROGRAMADO<br />
DISPONIBLE<br />
PARTICPACIÓN DEL<br />
DISPONIBLE CON<br />
RELACIÓN AL<br />
PROGRAMADO<br />
1 SERVICIOS PERSONALES 49.59% 29,057,019,007.00 28,047,161,413.96 47.87% 1,009,857,593.04 1.72%<br />
2 SERVICIOS NO PERSONALES 5.40% 3,166,345,971.00 2,455,329,743.25 4.19% 711,016,227.75 1.21%<br />
3 MATERIALES Y SUMINISTROS 10.21% 5,982,126,928.00 5,710,837,239.63 9.75% 271,289,688.37 0.46%<br />
4 TRANSFERENCIAS CORRIENTES 12.52% 7,334,188,134.00 7,281,548,385.46 12.43% 52,639,748.54 0.09%<br />
6 ACTIVOS NO FINANCIEROS 22.27% 13,050,742,532.00 7,961,176,115.27 13.59% 5,089,566,416.73 8.69%<br />
TOTAL<br />
100.00% 58,590,422,572.00 51,456,052,897.57 87.82% 7,134,369,674.43 12.18%