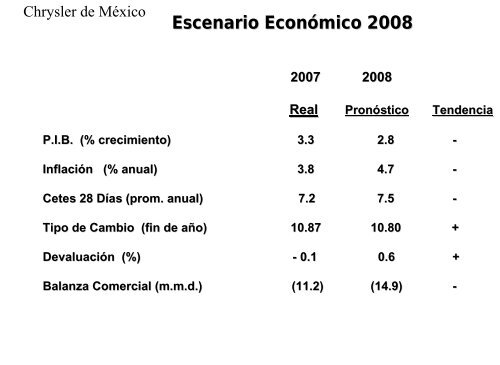
Chrysler de México Esc<strong>en</strong>ario Económico 2008 2007 2008 Real Pronóstico T<strong>en</strong>d<strong>en</strong>cia P.I.B. (% crecimi<strong>en</strong>to) 3.3 2.8 - Inflación (% anual) 3.8 4.7 - Cetes 28 Días (prom. anual) 7.2 7.5 - Tipo de Cambio (fin de año) 10.87 10.80 + Devaluación (%) - 0.1 0.6 + Balanza Comercial (m.m.d.) (11.2) (14.9) -
Chrysler de México Exportación n y Producción n Nacional Anual Exportaciones 2003 2004 Growth % 2005 Growth % 2006 Growth % DaimlerChrysler 305,087 336,647 10.3% 334,323 -0.7% 303,441 -9.2% Ford 106,000 70,200 -33.8% 106,027 51.0% 302,780 185.6% GM 391,876 376,271 -4.0% 335,510 -10.8% 412,807 23.0% Honda 14,497 14,483 -0.1% 14,499 0.1% 15,107 4.2% Nissan 119,774 134,371 12.2% 156,405 16.4% 208,829 33.5% VW 232,887 162,214 -30.3% 239,259 47.5% 283,564 18.5% R<strong>en</strong>ault - 120 0.0% 323 169.2% 138 -57.3% Toyota - - 0.0% 0.0% 10,111 0.0% Otros Camiones 24,598 37,916 54.1% 37,454 -1.2% 50,401 34.6% Total 1,194,719 1,132,222 -5.2% 1,223,800 8.1% 1,587,178 29.7% Producción 2003 2004 Growth % 2005 Growth % 2006 Growth % BMW 308 - -100.0% - - - - DaimlerChrysler 308,738 341,575 10.6% 343,748 0.6% 313,387 -8.8% Ford 143,707 107,804 -25.0% 147,629 36.9% 349,910 137.0% GM 471,619 486,076 3.1% 428,443 -11.9% 502,544 17.3% Honda 21,624 21,824 0.9% 23,532 7.8% 24,262 3.1% Nissan 291,902 313,512 7.4% 350,099 11.7% 408,439 16.7% R<strong>en</strong>ault 15,414 11,042 -28.4% 13,543 - - - VW 287,253 225,342 -21.6% 300,386 33.3% 347,020 15.5% Toyota - - 0.0% 0.0% 33,209 0.0% Otros Camiones 45,588 61,255 34.4% 70,370 14.9% 62,720 -10.9% Total 1,586,153 1,568,430 -1.1% 1,677,750 7.0% 2,041,491 21.7% Cifras de AMIA