Anexo EstadÃstico - Gobierno del Estado de Chihuahua
Anexo EstadÃstico - Gobierno del Estado de Chihuahua
Anexo EstadÃstico - Gobierno del Estado de Chihuahua

Create successful ePaper yourself
Turn your PDF publications into a flip-book with our unique Google optimized e-Paper software.
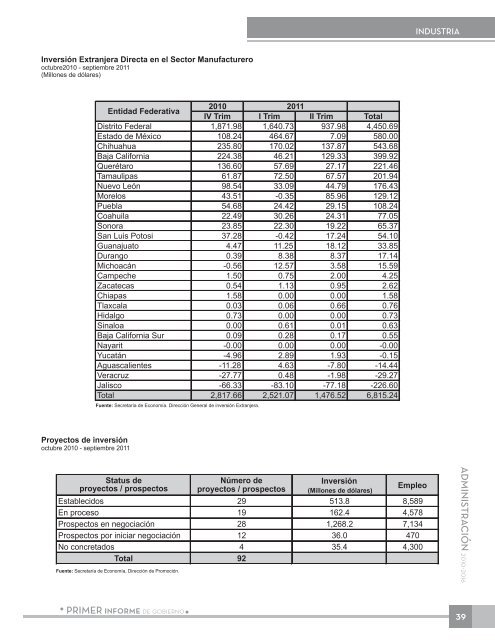
INDUSTRIA<br />
Inversión Extranjera Directa en el Sector Manufacturero<br />
octubre2010 - septiembre 2011<br />
(Millones <strong>de</strong> dólares)<br />
Entidad Fe<strong>de</strong>rativa<br />
2010<br />
2011<br />
IV Trim I Trim II Trim Total<br />
Distrito Fe<strong>de</strong>ral 1,871.98 1,640.73 937.98 4,450.69<br />
<strong>Estado</strong> <strong>de</strong> México 108.24 464.67 7.09 580.00<br />
<strong>Chihuahua</strong> 235.80 170.02 137.87 543.68<br />
Baja California 224.38 46.21 129.33 399.92<br />
Querétaro 136.60 57.69 27.17 221.46<br />
Tamaulipas 61.87 72.50 67.57 201.94<br />
Nuevo León 98.54 33.09 44.79 176.43<br />
Morelos 43.51 -0.35 85.96 129.12<br />
Puebla 54.68 24.42 29.15 108.24<br />
Coahuila 22.49 30.26 24.31 77.05<br />
Sonora 23.85 22.30 19.22 65.37<br />
San Luis Potosi 37.28 -0.42 17.24 54.10<br />
Guanajuato 4.47 11.25 18.12 33.85<br />
Durango 0.39 8.38 8.37 17.14<br />
Michoacán -0.56 12.57 3.58 15.59<br />
Campeche 1.50 0.75 2.00 4.25<br />
Zacatecas 0.54 1.13 0.95 2.62<br />
Chiapas 1.58 0.00 0.00 1.58<br />
Tlaxcala 0.03 0.06 0.66 0.76<br />
Hidalgo 0.73 0.00 0.00 0.73<br />
Sinaloa 0.00 0.61 0.01 0.63<br />
Baja California Sur 0.09 0.28 0.17 0.55<br />
Nayarit -0.00 0.00 0.00 -0.00<br />
Yucatán -4.96 2.89 1.93 -0.15<br />
Aguascalientes -11.28 4.63 -7.80 -14.44<br />
Veracruz -27.77 0.48 -1.98 -29.27<br />
Jalisco -66.33 -83.10 -77.18 -226.60<br />
Total 2,817.66 2,521.07 1,476.52 6,815.24<br />
Fuente: Secretaría <strong>de</strong> Economía. Dirección General <strong>de</strong> inversión Extranjera.<br />
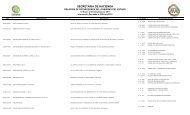
Proyectos <strong>de</strong> inversión<br />
octubre 2010 - septiembre 2011<br />
Status <strong>de</strong><br />
proyectos / prospectos<br />
Número <strong>de</strong><br />
proyectos / prospectos<br />
Inversión<br />
(Millones <strong>de</strong> dólares)<br />
Empleo<br />
Establecidos 29 513.8 8,589<br />
En proceso 19 162.4 4,578<br />
Prospectos en negociación 28 1,268.2 7,134<br />
Prospectos por iniciar negociación 12 36.0 470<br />
No concretados 4 35.4 4,300<br />
Total 92<br />
Fuente: Secretaría <strong>de</strong> Economía, Dirección <strong>de</strong> Promoción.<br />
ADMINISTRACIÓN 2010-2016<br />
PRIMER informe <strong>de</strong> gobierno<br />
39