Anexo EstadÃstico - Gobierno del Estado de Chihuahua
Anexo EstadÃstico - Gobierno del Estado de Chihuahua
Anexo EstadÃstico - Gobierno del Estado de Chihuahua

You also want an ePaper? Increase the reach of your titles
YUMPU automatically turns print PDFs into web optimized ePapers that Google loves.
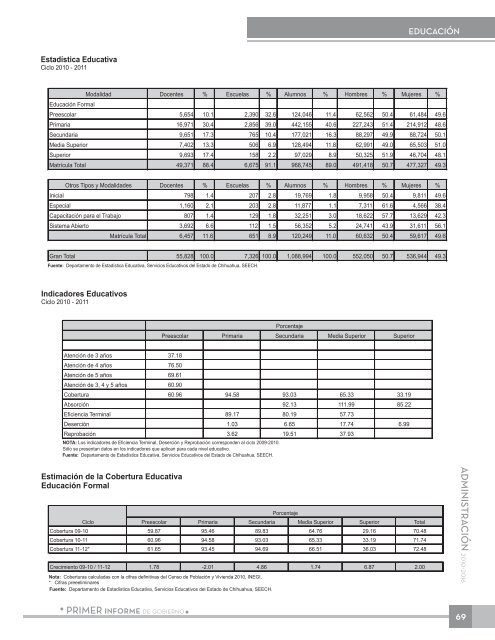
EDUCACIÓN<br />
Estadística Educativa<br />
Ciclo 2010 - 2011<br />
Modalidad Docentes % Escuelas % Alumnos % Hombres % Mujeres %<br />
Educación Formal<br />
Preescolar 5,654 10.1 2,390 32.6 124,046 11.4 62,562 50.4 61,484 49.6<br />
Primaria 16,971 30.4 2,856 39.0 442,155 40.6 227,243 51.4 214,912 48.6<br />
Secundaria 9,651 17.3 765 10.4 177,021 16.3 88,297 49.9 88,724 50.1<br />
Media Superior 7,402 13.3 506 6.9 128,494 11.8 62,991 49.0 65,503 51.0<br />
Superior 9,693 17.4 158 2.2 97,029 8.9 50,325 51.9 46,704 48.1<br />
Matrícula Total 49,371 88.4 6,675 91.1 968,745 89.0 491,418 50.7 477,327 49.3<br />
Otros Tipos y Modalida<strong>de</strong>s Docentes % Escuelas % Alumnos % Hombres % Mujeres %<br />
Inicial 798 1.4 207 2.8 19,769 1.8 9,958 50.4 9,811 49.6<br />
Especial 1,160 2.1 203 2.8 11,877 1.1 7,311 61.6 4,566 38.4<br />
Capacitación para el Trabajo 807 1.4 129 1.8 32,251 3.0 18,622 57.7 13,629 42.3<br />
Sistema Abierto 3,692 6.6 112 1.5 56,352 5.2 24,741 43.9 31,611 56.1<br />
Matrícula Total 6,457 11.6 651 8.9 120,249 11.0 60,632 50.4 59,617 49.6<br />
Gran Total 55,828 100.0 7,326 100.0 1,088,994 100.0 552,050 50.7 536,944 49.3<br />
Fuente: Departamento <strong>de</strong> Estadística Educativa, Servicios Educativos <strong><strong>de</strong>l</strong> <strong>Estado</strong> <strong>de</strong> <strong>Chihuahua</strong>, SEECH.<br />
Indicadores Educativos<br />
Ciclo 2010 - 2011<br />
Porcentaje<br />
Preescolar Primaria Secundaria Media Superior Superior<br />
Atención <strong>de</strong> 3 años 37.18<br />
Atención <strong>de</strong> 4 años 76.50<br />
Atención <strong>de</strong> 5 años 69.61<br />
Atención <strong>de</strong> 3, 4 y 5 años 60.90<br />
Cobertura 60.96 94.58 93.03 65.33 33.19<br />
Absorción 92.13 111.99 85.22<br />
Eficiencia Terminal 89.17 80.19 57.73<br />
Deserción 1.03 6.65 17.74 6.99<br />
Reprobación 3.62 19.51 37.93<br />
NOTA: Los indicadores <strong>de</strong> Eficiencia Terminal, Deserción y Reprobación correspon<strong>de</strong>n al ciclo 2009-2010.<br />
Sólo se presentan datos en los indicadores que aplican para cada nivel educativo.<br />
Fuente: Departamento <strong>de</strong> Estadística Educativa, Servicios Educativos <strong><strong>de</strong>l</strong> <strong>Estado</strong> <strong>de</strong> <strong>Chihuahua</strong>, SEECH.<br />
Estimación <strong>de</strong> la Cobertura Educativa<br />
Educación Formal<br />
Ciclo<br />
Porcentaje<br />
Preescolar Primaria Secundaria Media Superior Superior Total<br />
Cobertura 09-10 59.87 95.46 89.83 64.76 29.16 70.48<br />
Cobertura 10-11 60.96 94.58 93.03 65.33 33.19 71.74<br />
Cobertura 11-12* 61.65 93.45 94.69 66.51 36.03 72.48<br />
Crecimiento 09-10 / 11-12 1.78 -2.01 4.86 1.74 6.87 2.00<br />
Nota: Coberturas calculadas con la cifras <strong>de</strong>finitivas <strong><strong>de</strong>l</strong> Censo <strong>de</strong> Población y Vivienda 2010, INEGI.<br />
* Cifras preeeliminares<br />
Fuente: Departamento <strong>de</strong> Estadística Educativa, Servicios Educativos <strong><strong>de</strong>l</strong> <strong>Estado</strong> <strong>de</strong> <strong>Chihuahua</strong>, SEECH.<br />
ADMINISTRACIÓN 2010-2016<br />
PRIMER informe <strong>de</strong> gobierno<br />
69