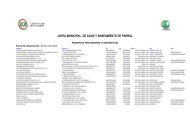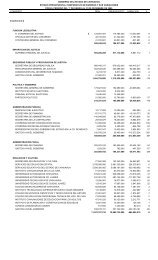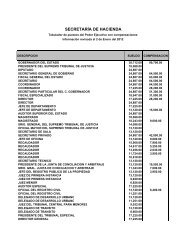
Anexo EstadÃstico - Gobierno del Estado de Chihuahua
Anexo EstadÃstico - Gobierno del Estado de Chihuahua
Anexo EstadÃstico - Gobierno del Estado de Chihuahua

You also want an ePaper? Increase the reach of your titles
YUMPU automatically turns print PDFs into web optimized ePapers that Google loves.
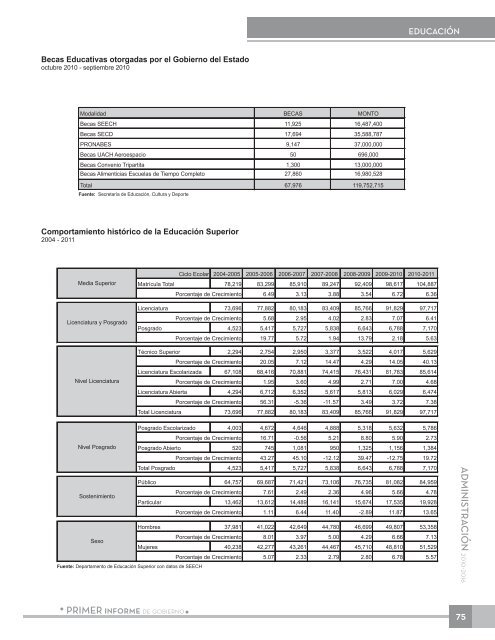
EDUCACIÓN<br />
Becas Educativas otorgadas por el <strong>Gobierno</strong> <strong><strong>de</strong>l</strong> <strong>Estado</strong><br />
octubre 2010 - septiembre 2010<br />
Modalidad BECAS MONTO<br />
Becas SEECH 11,925 16,487,400<br />
Becas SECD 17,694 35,588,787<br />
PRONABES 9,147 37,000,000<br />
Becas UACH Aeroespacio 50 696,000<br />
Becas Convenio Tripartita 1,300 13,000,000<br />
Becas Alimenticias Escuelas <strong>de</strong> Tiempo Completo 27,860 16,980,528<br />
Total 67,976 119,752,715<br />
Fuente: Secretaría <strong>de</strong> Educación, Cultura y Deporte<br />
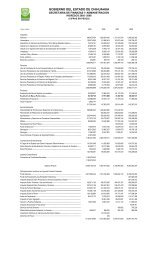
Comportamiento histórico <strong>de</strong> la Educación Superior<br />
2004 - 2011<br />
Media Superior<br />
Licenciatura y Posgrado<br />
Nivel Licenciatura<br />
Ciclo Ecolar 2004-2005 2005-2006 2006-2007 2007-2008 2008-2009 2009-2010 2010-2011<br />
Matrícula Total 78,219 83,299 85,910 89,247 92,409 98,617 104,887<br />
Porcentaje <strong>de</strong> Crecimiento 6.49 3.13 3.88 3.54 6.72 6.36<br />
Licenciatura 73,696 77,882 80,183 83,409 85,766 91,829 97,717<br />
Porcentaje <strong>de</strong> Crecimiento 5.68 2.95 4.02 2.83 7.07 6.41<br />
Posgrado 4,523 5,417 5,727 5,838 6,643 6,788 7,170<br />
Porcentaje <strong>de</strong> Crecimiento 19.77 5.72 1.94 13.79 2.18 5.63<br />
Técnico Superior 2,294 2,754 2,950 3,377 3,522 4,017 5,629<br />
Porcentaje <strong>de</strong> Crecimiento 20.05 7.12 14.47 4.29 14.05 40.13<br />
Licenciatura Escolarizada 67,108 68,416 70,881 74,415 76,431 81,783 85,614<br />
Porcentaje <strong>de</strong> Crecimiento 1.95 3.60 4.99 2.71 7.00 4.68<br />
Licenciatura Abierta 4,294 6,712 6,352 5,617 5,813 6,029 6,474<br />
Porcentaje <strong>de</strong> Crecimiento 56.31 -5.36 -11.57 3.49 3.72 7.38<br />
Total Licenciatura 73,696 77,882 80,183 83,409 85,766 91,829 97,717<br />
Posgrado Escolarizado 4,003 4,672 4,646 4,888 5,318 5,632 5,786<br />
Porcentaje <strong>de</strong> Crecimiento 16.71 -0.56 5.21 8.80 5.90 2.73<br />
Nivel Posgrado Posgrado Abierto 520 745 1,081 950 1,325 1,156 1,384<br />
Porcentaje <strong>de</strong> Crecimiento 43.27 45.10 -12.12 39.47 -12.75 19.72<br />
Total Posgrado 4,523 5,417 5,727 5,838 6,643 6,788 7,170<br />
Público 64,757 69,687 71,421 73,106 76,735 81,082 84,959<br />
Sostenimiento<br />
Porcentaje <strong>de</strong> Crecimiento 7.61 2.49 2.36 4.96 5.66 4.78<br />
Particular 13,462 13,612 14,489 16,141 15,674 17,535 19,928<br />
Porcentaje <strong>de</strong> Crecimiento 1.11 6.44 11.40 -2.89 11.87 13.65<br />
Hombres 37,981 41,022 42,649 44,780 46,699 49,807 53,358<br />
Sexo<br />
Porcentaje <strong>de</strong> Crecimiento 8.01 3.97 5.00 4.29 6.66 7.13<br />
Mujeres 40,238 42,277 43,261 44,467 45,710 48,810 51,529<br />
Porcentaje <strong>de</strong> Crecimiento 5.07 2.33 2.79 2.80 6.78 5.57<br />
Fuente: Departamento <strong>de</strong> Educación Superior con datos <strong>de</strong> SEECH<br />
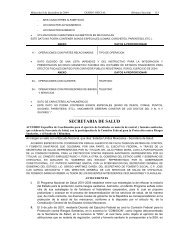
ADMINISTRACIÓN 2010-2016<br />
PRIMER informe <strong>de</strong> gobierno<br />
75