

01_Monografía_de_partidos_políticos_de_Guatemala_2012
01_Monografía_de_partidos_políticos_de_Guatemala_2012
01_Monografía_de_partidos_políticos_de_Guatemala_2012

You also want an ePaper? Increase the reach of your titles
YUMPU automatically turns print PDFs into web optimized ePapers that Google loves.
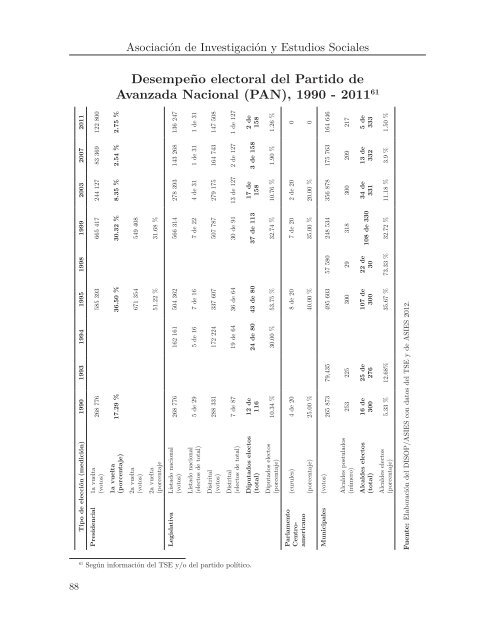
Asociación <strong>de</strong> Investigación y Estudios Sociales<br />
Desempeño electoral <strong>de</strong>l Partido <strong>de</strong><br />
Avanzada Nacional (PAN), 1990 - 2<strong>01</strong>1 61<br />
Tipo <strong>de</strong> elección (medición) 1990 1993 1994 1995 1998 1999 2003 2007 2<strong>01</strong>1<br />
Presi<strong>de</strong>ncial 1a vuelta<br />
(votos)<br />
268 776 585 393 665 417 244 127 83 369 122 800<br />
1a vuelta<br />
(porcentaje)<br />
17.29 % 36.50 % 30.32 % 8.35 % 2.54 % 2.75 %<br />
2a vuelta<br />
(votos)<br />
671 354 549 408<br />
2a vuelta<br />
(porcentaje<br />
51.22 % 31.68 %<br />
Legislativa Listado nacional<br />
(votos)<br />
268 776 162 161 504 362 566 314 278 393 143 268 136 247<br />
Listado nacional<br />
(electos <strong>de</strong> total)<br />
5 <strong>de</strong> 29 5 <strong>de</strong> 16 7 <strong>de</strong> 16 7 <strong>de</strong> 22 4 <strong>de</strong> 31 1 <strong>de</strong> 31 1 <strong>de</strong> 31<br />
Distrital<br />
(votos)<br />
288 331 172 224 337 607 507 787 279 175 164 743 147 508<br />
Distrital<br />
(electos <strong>de</strong> total)<br />
7 <strong>de</strong> 87 19 <strong>de</strong> 64 36 <strong>de</strong> 64 30 <strong>de</strong> 91 13 <strong>de</strong> 127 2 <strong>de</strong> 127 1 <strong>de</strong> 127<br />
Diputados electos<br />
(total)<br />
12 <strong>de</strong><br />
116<br />
24 <strong>de</strong> 80 43 <strong>de</strong> 80 37 <strong>de</strong> 113<br />
17 <strong>de</strong><br />
158<br />
3 <strong>de</strong> 158<br />
2 <strong>de</strong><br />
158<br />
Diputados electos<br />
(porcentaje)<br />
10.34 % 30.00 % 53.75 % 32.74 % 10.76 % 1.90 % 1.26 %<br />
Parlamento<br />
Centroamericano<br />
(curules) 4 <strong>de</strong> 20 8 <strong>de</strong> 20 7 <strong>de</strong> 20 2 <strong>de</strong> 20 0<br />
(porcentaje) 25.00 % 40.00 % 35.00 % 20.00 % 0<br />
Municipales (votos)<br />
265 873 79,435 495 603 57 580 248 534 356 878 175 763 164 646<br />
Alcal<strong>de</strong>s postulados<br />
(número)<br />
253 225 300 29 318 300 209 217<br />
Alcal<strong>de</strong>s electos<br />
(total)<br />
16 <strong>de</strong><br />
300<br />
25 <strong>de</strong><br />
276<br />
107 <strong>de</strong><br />
300<br />
22 <strong>de</strong><br />
30<br />
108 <strong>de</strong> 330<br />
34 <strong>de</strong><br />
331<br />
13 <strong>de</strong><br />
332<br />
5 <strong>de</strong><br />
333<br />
Alcal<strong>de</strong>s electos<br />
(porcentaje)<br />
5.33 % 12.68% 35.67 % 73.33 % 32.72 % 11.18 % 3.9 % 1.50 %<br />
Fuente: Elaboración <strong>de</strong>l DISOP/ASIES con datos <strong>de</strong>l TSE y <strong>de</strong> ASIES 2<strong>01</strong>2.<br />
61<br />
Según información <strong>de</strong>l TSE y/o <strong>de</strong>l partido político.<br />
88