Informe de Actividades - Grupo ACS
Informe de Actividades - Grupo ACS
Informe de Actividades - Grupo ACS

Create successful ePaper yourself
Turn your PDF publications into a flip-book with our unique Google optimized e-Paper software.
INFORME DE ACTIVIDADES<br />
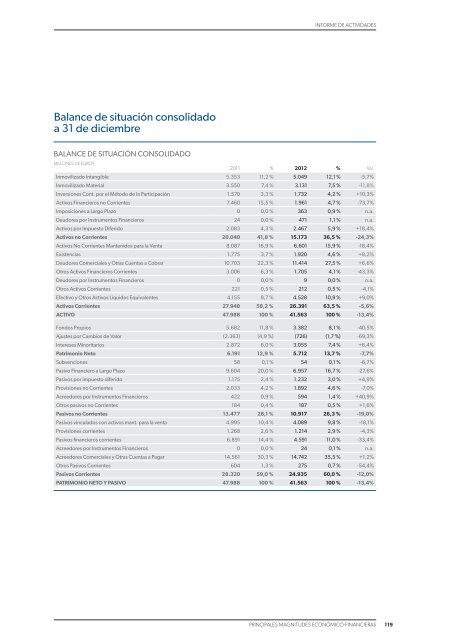
Balance <strong>de</strong> situación consolidado<br />
a 31 <strong>de</strong> diciembre<br />
BALANCE DE SITUACIÓN CONSOLIDADO<br />
MILLONES DE EUROS<br />
2011 % 2012 % Var.<br />
Inmovilizado Intangible 5.353 11,2 % 5.049 12,1 % -5,7%<br />
Inmovilizado Material 3.550 7,4 % 3.131 7,5 % -11,8%<br />
Inversiones Cont. por el Método <strong>de</strong> la Participación 1.570 3,3 % 1.732 4,2 % +10,3%<br />
Activos Financieros no Corrientes 7.460 15,5 % 1.961 4,7 % -73,7%<br />
Imposiciones a Largo Plazo 0 0,0 % 363 0,9 % n.a.<br />
Deudores por Instrumentos Financieros 24 0,0 % 471 1,1 % n.a.<br />
Activos por Impuesto Diferido 2.083 4,3 % 2.467 5,9 % +18,4%<br />
Activos no Corrientes 20.040 41,8 % 15.173 36,5 % -24,3%<br />
Activos No Corrientes Mantenidos para la Venta 8.087 16,9 % 6.601 15,9 % -18,4%<br />
Existencias 1.775 3,7 % 1.920 4,6 % +8,2%<br />
Deudores Comerciales y Otras Cuentas a Cobrar 10.703 22,3 % 11.414 27,5 % +6,6%<br />
Otros Activos Financieros Corrientes 3.006 6,3 % 1.705 4,1 % -43,3%<br />
Deudores por Instrumentos Financieros 0 0,0 % 9 0,0 % n.a.<br />
Otros Activos Corrientes 221 0,5 % 212 0,5 % -4,1%<br />
Efectivo y Otros Activos Líquidos Equivalentes 4.155 8,7 % 4.528 10,9 % +9,0%<br />
Activos Corrientes 27.948 58,2 % 26.391 63,5 % -5,6%<br />
ACTIVO 47.988 100 % 41.563 100 % -13,4%<br />
Fondos Propios 5.682 11,8 % 3.382 8,1 % -40,5%<br />
Ajustes por Cambios <strong>de</strong> Valor (2.363) (4,9 %) (726) (1,7 %) -69,3%<br />
Intereses Minoritarios 2.872 6,0 % 3.055 7,4 % +6,4%<br />
Patrimonio Neto 6.191 12,9 % 5.712 13,7 % -7,7%<br />
Subvenciones 58 0,1 % 54 0,1 % -6,7%<br />
Pasivo Financiero a Largo Plazo 9.604 20,0 % 6.957 16,7 % -27,6%<br />
Pasivos por impuesto diferido 1.175 2,4 % 1.232 3,0 % +4,9%<br />
Provisiones no Corrientes 2.033 4,2 % 1.892 4,6 % -7,0%<br />
Acreedores por Instrumentos Financieros 422 0,9 % 594 1,4 % +40,9%<br />
Otros pasivos no Corrientes 184 0,4 % 187 0,5 % +1,6%<br />
Pasivos no Corrientes 13.477 28,1 % 10.917 26,3 % -19,0%<br />
Pasivos vinculados con activos mant. para la venta 4.995 10,4 % 4.089 9,8 % -18,1%<br />
Provisiones corrientes 1.268 2,6 % 1.214 2,9 % -4,3%<br />
Pasivos financieros corrientes 6.891 14,4 % 4.591 11,0 % -33,4%<br />
Acreedores por Instrumentos Financieros 0 0,0 % 24 0,1 % n.a.<br />
Acreedores Comerciales y Otras Cuentas a Pagar 14.561 30,3 % 14.742 35,5 % +1,2%<br />
Otros Pasivos Corrientes 604 1,3 % 275 0,7 % -54,4%<br />
Pasivos Corrientes 28.320 59,0 % 24.935 60,0 % -12,0%<br />
PATRIMONIO NETO Y PASIVO 47.988 100 % 41.563 100 % -13,4%<br />
PRINCIPALES MAGNITUDES ECONÓMICO-FINANCIERAS<br />
119