Informe de Actividades - Grupo ACS
Informe de Actividades - Grupo ACS
Informe de Actividades - Grupo ACS

You also want an ePaper? Increase the reach of your titles
YUMPU automatically turns print PDFs into web optimized ePapers that Google loves.
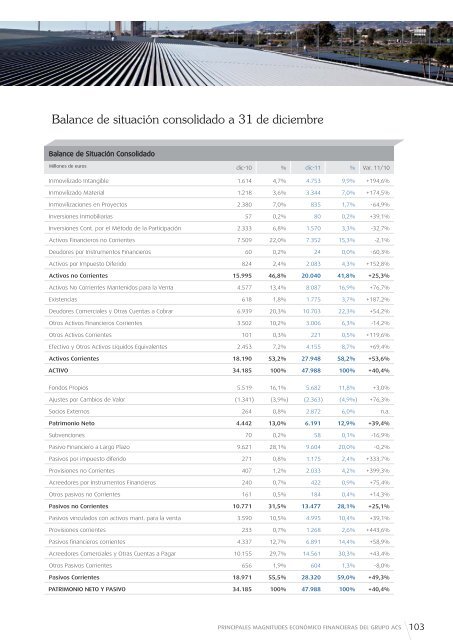
Balance <strong>de</strong> situación consolidado a 31 <strong>de</strong> diciembre<br />
Balance <strong>de</strong> Situación Consolidado<br />
Millones <strong>de</strong> euros dic-10 % dic-11 % Var. 11/10<br />
Inmovilizado Intangible 1.614 4,7% 4.753 9,9% +194,6%<br />
Inmovilizado Material 1.218 3,6% 3.344 7,0% +174,5%<br />
Inmovilizaciones en Proyectos 2.380 7,0% 835 1,7% -64,9%<br />
Inversiones Inmobiliarias 57 0,2% 80 0,2% +39,1%<br />
Inversiones Cont. por el Método <strong>de</strong> la Participación 2.333 6,8% 1.570 3,3% -32,7%<br />
Activos Financieros no Corrientes 7.509 22,0% 7.352 15,3% -2,1%<br />
Deudores por Instrumentos Financieros 60 0,2% 24 0,0% -60,3%<br />
Activos por Impuesto Diferido 824 2,4% 2.083 4,3% +152,8%<br />
Activos no Corrientes 15.995 46,8% 20.040 41,8% +25,3%<br />
Activos No Corrientes Mantenidos para la Venta 4.577 13,4% 8.087 16,9% +76,7%<br />
Existencias 618 1,8% 1.775 3,7% +187,2%<br />
Deudores Comerciales y Otras Cuentas a Cobrar 6.939 20,3% 10.703 22,3% +54,2%<br />
Otros Activos Financieros Corrientes 3.502 10,2% 3.006 6,3% -14,2%<br />
Otros Activos Corrientes 101 0,3% 221 0,5% +119,6%<br />
Efectivo y Otros Activos Líquidos Equivalentes 2.453 7,2% 4.155 8,7% +69,4%<br />
Activos Corrientes 18.190 53,2% 27.948 58,2% +53,6%<br />
ACTIVO 34.185 100% 47.988 100% +40,4%<br />
Fondos Propios 5.519 16,1% 5.682 11,8% +3,0%<br />
Ajustes por Cambios <strong>de</strong> Valor (1.341) (3,9%) (2.363) (4,9%) +76,3%<br />
Socios Externos 264 0,8% 2.872 6,0% n.a.<br />
Patrimonio Neto 4.442 13,0% 6.191 12,9% +39,4%<br />
Subvenciones 70 0,2% 58 0,1% -16,9%<br />
Pasivo Financiero a Largo Plazo 9.621 28,1% 9.604 20,0% -0,2%<br />
Pasivos por impuesto diferido 271 0,8% 1.175 2,4% +333,7%<br />
Provisiones no Corrientes 407 1,2% 2.033 4,2% +399,3%<br />
Acreedores por Instrumentos Financieros 240 0,7% 422 0,9% +75,4%<br />
Otros pasivos no Corrientes 161 0,5% 184 0,4% +14,3%<br />
Pasivos no Corrientes 10.771 31,5% 13.477 28,1% +25,1%<br />
Pasivos vinculados con activos mant. para la venta 3.590 10,5% 4.995 10,4% +39,1%<br />
Provisiones corrientes 233 0,7% 1.268 2,6% +443,6%<br />
Pasivos financieros corrientes 4.337 12,7% 6.891 14,4% +58,9%<br />
Acreedores Comerciales y Otras Cuentas a Pagar 10.155 29,7% 14.561 30,3% +43,4%<br />
Otros Pasivos Corrientes 656 1,9% 604 1,3% -8,0%<br />
Pasivos Corrientes 18.971 55,5% 28.320 59,0% +49,3%<br />
PATRIMONIO NETO Y PASIVO 34.185 100% 47.988 100% +40,4%<br />
PRINCIPALES MAGNITUDES ECONÓMICO FINANCIERAS DEL GRUPO <strong>ACS</strong> 103