Sanidad Militar - Ministerio de Defensa
Sanidad Militar - Ministerio de Defensa
Sanidad Militar - Ministerio de Defensa

Create successful ePaper yourself
Turn your PDF publications into a flip-book with our unique Google optimized e-Paper software.
P. Montenegro Álvarez <strong>de</strong> Tejera, et al.<br />
The Psu and Crea areas were taken as the response for a given<br />
sample. Calibration graphs were calculated by linear regression of<br />
areas versus the corresponding nominal concentrations.<br />
The responses obtained from the calibration samples were used<br />
to establish a relationship between the concentration and response,<br />
across the range of the analytical procedure, and to evaluate the<br />
goodness of fit and the lack of fit by means of analysis of variance.<br />
We studied the statistical evaluation of the slope, intercept, correlation<br />
coefficient and variance of the regression.<br />
Lower limit of quantification (LLOQ)<br />
Using the calibration curve constructed from the standard solutions,<br />
the LLOQ was <strong>de</strong>fined as the lowest concentration that can be<br />
<strong>de</strong>termined with acceptable accuracy and precision.<br />
Accuracy and precision<br />
The reproducibility of the method including the dilution was<br />
using a pooled material from spontaneous urine samples of healthy<br />
volunteers analysed with the <strong>de</strong>veloped RP-HPLC method.<br />
During the validation, three sets of Quality Control Samples<br />
(QC) were prepared by spiking urine sample with Psu and Crea.<br />
These QC, containing 197, 297, 522 and 1262, 1812 and 3162 nmol/<br />
ml, respectively, were analyzed in 6 different runs to <strong>de</strong>termine the<br />
accuracy and precision.<br />
Due to the fact that Psu and Crea are already present in the<br />
blank urine sample and because the method requires a suitable dilution,<br />
we performed a study of precision and accuracy of various<br />
dilutions in or<strong>de</strong>r to check matrix interferences. Once we established<br />
the amount of Psu and Crea, present in the sample, through<br />
10 analysis on the same sample using our method, three different<br />
dilutions were done, 25 µl of treated urine were diluted 10, 20 and<br />
40 times with mobile phase and 20 µl were injected. These quality<br />
control samples were analized in quadruplicate on same day. The<br />
accuracy and precision inter-day were evaluated on four different<br />
days.<br />
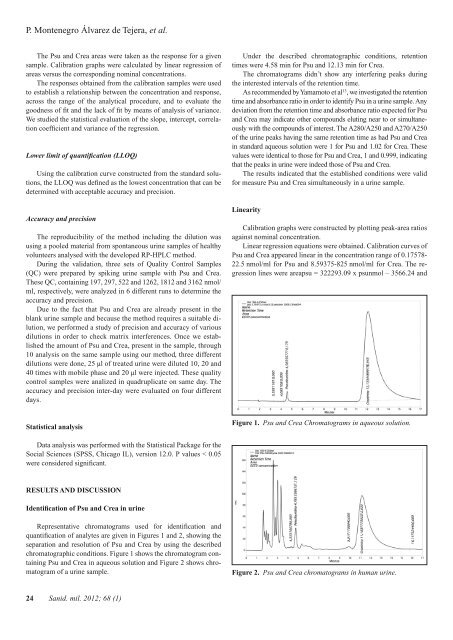
Un<strong>de</strong>r the <strong>de</strong>scribed chromatographic conditions, retention<br />
times were 4.58 min for Psu and 12.13 min for Crea.<br />
The chromatograms didn’t show any interfering peaks during<br />
the interested intervals of the retention time.<br />
As recommen<strong>de</strong>d by Yamamoto et al 13 , we investigated the retention<br />
time and absorbance ratio in or<strong>de</strong>r to i<strong>de</strong>ntify Psu in a urine sample. Any<br />
<strong>de</strong>viation from the retention time and absorbance ratio expected for Psu<br />
and Crea may indicate other compounds eluting near to or simultaneously<br />
with the compounds of interest. The A280/A250 and A270/A250<br />
of the urine peaks having the same retention time as had Psu and Crea<br />
in standard aqueous solution were 1 for Psu and 1.02 for Crea. These<br />
values were i<strong>de</strong>ntical to those for Psu and Crea, 1 and 0.999, indicating<br />
that the peaks in urine were in<strong>de</strong>ed those of Psu and Crea.<br />
The results indicated that the established conditions were valid<br />
for measure Psu and Crea simultaneously in a urine sample.<br />
Linearity<br />
Calibration graphs were constructed by plotting peak-area ratios<br />
against nominal concentration.<br />
Linear regression equations were obtained. Calibration curves of<br />
Psu and Crea appeared linear in the concentration range of 0.17578-<br />
22.5 nmol/ml for Psu and 8.59375-825 nmol/ml for Crea. The regression<br />
lines were areapsu = 322293.09 x psunmol – 3566.24 and<br />
Statistical analysis<br />
Figure 1. Psu and Crea Chromatograms in aqueous solution.<br />
Data analysis was performed with the Statistical Package for the<br />
Social Sciences (SPSS, Chicago IL), version 12.0. P values < 0.05<br />
were consi<strong>de</strong>red significant.<br />
RESULTS AND DISCUSSION<br />
I<strong>de</strong>ntification of Psu and Crea in urine<br />
Representative chromatograms used for i<strong>de</strong>ntification and<br />
quantification of analytes are given in Figures 1 and 2, showing the<br />
separation and resolution of Psu and Crea by using the <strong>de</strong>scribed<br />
chromatographic conditions. Figure 1 shows the chromatogram containing<br />
Psu and Crea in aqueous solution and Figure 2 shows chromatogram<br />
of a urine sample.<br />
Figure 2. Psu and Crea chromatograms in human urine.<br />
24 Sanid. mil. 2012; 68 (1)