Exportaciones e Importaciones Pesqueras 2012 - Ministerio de ...
Exportaciones e Importaciones Pesqueras 2012 - Ministerio de ...
Exportaciones e Importaciones Pesqueras 2012 - Ministerio de ...

You also want an ePaper? Increase the reach of your titles
YUMPU automatically turns print PDFs into web optimized ePapers that Google loves.
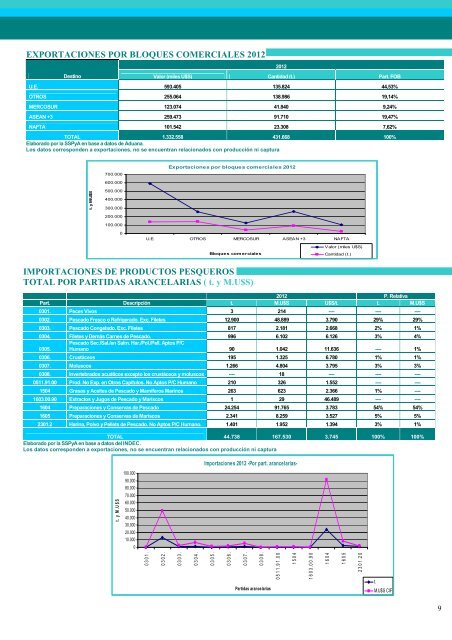
EXPORTACIONES POR BLOQUES COMERCIALES <strong>2012</strong><br />
Destino Valor (miles U$S) Cantidad (t.) Part. FOB<br />
U.E. 593.405 135.824 44,53%<br />
OTROS 255.064 138.986 19,14%<br />
MERCOSUR 123.074 41.840 9,24%<br />
ASEAN +3 259.473 91.710 19,47%<br />
NAFTA 101.542 23.308 7,62%<br />
TOTAL 1.332.558 431.668 100%<br />
Elaborado por la SSPyA en base a datos <strong>de</strong> Aduana.<br />
Los datos correspon<strong>de</strong>n a exportaciones, no se encuentran relacionados con producción ni captura<br />
<strong>2012</strong><br />
700.000<br />
<strong>Exportaciones</strong> por bloques comerciales <strong>2012</strong><br />
600.000<br />
t. y M.U$S<br />
500.000<br />
400.000<br />
300.000<br />
200.000<br />
100.000<br />
0<br />
U.E. OTROS MERCOSUR ASEAN +3 NAFTA<br />
Bloques com erciales<br />
Valor (miles U$S)<br />
Cantidad (t.)<br />
IMPORTACIONES DE PRODUCTOS PESQUEROS<br />
TOTAL POR PARTIDAS ARANCELARIAS ( t. y M.U$S)<br />
<strong>2012</strong> P. Relativa<br />
Part. Descripción t. M.U$S U$S/t. t. M.U$S<br />
0301. Peces Vivos 3 214 ---- ---- ----<br />
0302. Pescado Fresco o Refrigerado. Exc. Filetes 12.900 48.889 3.790 29% 29%<br />
0303. Pescado Congelado. Exc. Filetes 817 2.181 2.668 2% 1%<br />
0304. Filetes y Demás Carnes <strong>de</strong> Pescado. 996 6.102 6.126 3% 4%<br />
Pescado Sec./Sal./en Salm. Har./Pol./Pell. Aptos P/C<br />
0305. Humano 90 1.042 11.636 ---- 1%<br />
0306. Crustáceos 195 1.325 6.780 1% 1%<br />
0307. Moluscos 1.266 4.804 3.795 3% 3%<br />
0308. Invertebrados acuáticos excepto los crustáceos y moluscos ---- 18 ---- ---- ----<br />
0511.91.00 Prod. No Exp. en Otros Capítulos. No Aptos P/C Humano 210 326 1.552 ---- ----<br />
1504 Grasas y Aceites <strong>de</strong> Pescado y Mamíferos Marinos 263 623 2.366 1% ----<br />
1603.00.90 Extractos y Jugos <strong>de</strong> Pescado y Mariscos 1 29 46.489 ---- ----<br />
1604 Preparaciones y Conservas <strong>de</strong> Pescado 24.254 91.765 3.783 54% 54%<br />
1605 Preparaciones y Conservas <strong>de</strong> Mariscos 2.341 8.259 3.527 5% 5%<br />
2301.2 Harina, Polvo y Pellets <strong>de</strong> Pescado. No Aptos P/C Humano. 1.401 1.952 1.394 3% 1%<br />
TOTAL 44.738 167.530 3.745 100% 100%<br />
Elaborado por la SSPyA en base a datos <strong>de</strong>l INDEC.<br />
Los datos correspon<strong>de</strong>n a exportaciones, no se encuentran relacionados con producción ni captura<br />
t . y M .U $ S<br />
100.000<br />
90.000<br />
80.000<br />
70.000<br />
60.000<br />
50.000<br />
40.000<br />
30.000<br />
20.000<br />
10.000<br />
0<br />
<strong>Importaciones</strong> <strong>2012</strong> -Por part. arancelarias-<br />
0 3 0 1 .<br />
0 3 0 2 .<br />
0 3 0 3 .<br />
0 3 0 4 .<br />
0 3 0 5 .<br />
0 3 0 6 .<br />
0 3 0 7 .<br />
0 3 0 8 .<br />
0 5 1 1 .9 1 .0 0<br />
Partidas arancelarias<br />
1 5 0 4<br />
1 6 0 3 .0 0 .9 0<br />
1 6 0 4<br />
1 6 0 5<br />
2 3 0 1 .2 0<br />
t.<br />
M.U$S CIF<br />
9