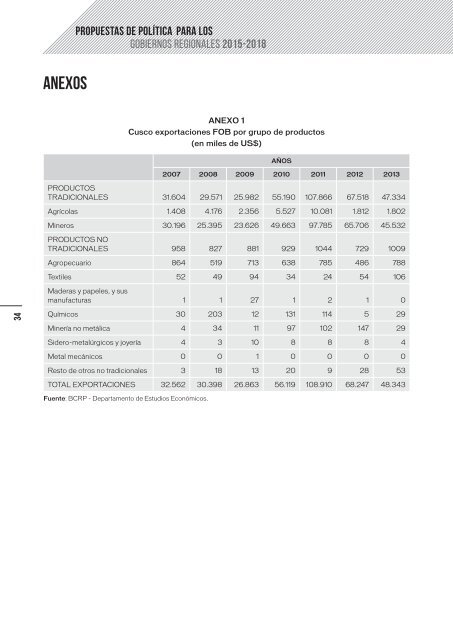
Propuestas de política para los Gobiernos Regionales 2015-2018 ANEXOS ANEXO 1 Cusco exportaciones FOB por grupo de productos (en miles de US$) AÑOS 2007 2008 2009 2010 2011 2012 2013 PRODUCTOS TRADICIONALES 31.604 29.571 25.982 55.190 107.866 67.518 47.334 Agrícolas 1.408 4.176 2.356 5.527 10.081 1.812 1.802 Mineros 30.196 25.395 23.626 49.663 97.785 65.706 45.532 PRODUCTOS NO TRADICIONALES 958 827 881 929 1044 729 1009 Agropecuario 864 519 713 638 785 486 788 Textiles 52 49 94 34 24 54 106 Maderas y papeles, y sus manufacturas 1 1 27 1 2 1 0 34 Químicos 30 203 12 131 114 5 29 Minería no metálica 4 34 11 97 102 147 29 Sidero-metalúrgicos y joyería 4 3 10 8 8 8 4 Metal mecánicos 0 0 1 0 0 0 0 Resto de otros no tradicionales 3 18 13 20 9 28 53 TOTAL EXPORTACIONES 32.562 30.398 26.863 56.119 108.910 68.247 48.343 Fuente: BCRP - Departamento de Estudios Económicos.
Gestión sostenible de los recursos naturales e industrias extractivas en Cusco Valerio Paucarmayta ANEXO 2 Exportaciones FOB, por grupo de productos ANEXO 02: EXPORTACIONES FOB, POR GRUPO DE PRODUCTOS (en millones de US $) (en millones de US$) AÑO 2000 2001 2002 2003 2004 2005 2006 2007 2008 2009 2010 2011 2012 2013 1. Productos tradicionales 4804,442772 4730,309195 5368,57155 6356,318118 9198,568072 12949,55968 18461,04604 21666,40293 23265,72508 20720,21277 27850,27116 35896,34322 34824,83437 30954,24976 % 69,08 67,33 69,60 69,92 71,81 74,56 77,47 77,12 75,01 76,54 77,79 77,40 75,11 73,39 Pesqueros 954,6514128 926,2198588 892,3369657 821,304274 1103,685679 1303,009117 1335,161628 1460,175086 1797,385847 1683,213666 1884,218306 2113,515649 2311,712602 1706,695063 Agrícolas 248,9318043 207,4563756 216,2298329 224,1164275 325,1078025 331,0779469 573,6658799 460,4281113 685,9344871 634,3653145 975,097908 1689,350287 1094,805139 785,3150052 Mineros 3220,128969 3205,293115 3808,948798 4689,91459 7123,81774 9789,851019 14734,51465 17439,35225 18100,96795 16481,81353 21902,83157 27525,67483 26422,77935 23256,86916 Petróleo y derivados 380,730586 391,3398457 451,055954 620,9828268 645,9568507 1525,621597 1817,703878 2306,447482 2681,4368 1920,820259 3088,123384 4567,802454 4995,537272 5205,370533 2. Productos no tradicionales 2043,749167 2182,783052 2256,148827 2620,3785 3479,122 4277,0465 5278,5278 6313,1265 7562,3077 6196,0776 7698,5356 10175,8495 11197,0357 10984,9996 % 29,39 31,07 29,25 28,82 27,16 24,63 22,15 22,47 24,38 22,89 21,50 21,94 24,15 26,05 Agropecuarios 394,0419403 436,7447736 549,775968 623,5924 800,6281 1007,6961 1220,1224 1512,1504 1912,6476 1827,6068 2202,5516 2835,5271 3082,7011 3433,5971 Pesqueros 176,795337 197,0107088 163,817756 204,9568 277,1269 322,6745 432,9043 499,5187 621,9376 517,9215 643,6535 1049,4242 1016,9302 1028,3683 Textiles 700,680013 664,2271607 676,653284 823,2535 1092,378 1275,1107 1472,5702 1736,4664 2025,8468 1495,3792 1560,8284 1989,8615 2177,0586 1926,1992 Maderas y papeles, y sus manufacturas 123,0437909 142,1198549 177,149673 172,3889 214,316 261,4193 333,2884 361,6935 427,7683 335,839 359,1752 401,6937 438,0823 425,7175 Químicos 212,3175219 246,6263233 255,895105 316,3858 415,0063 537,6717 601,6734 805,031 1040,7969 837,801 1228,2732 1654,8217 1636,3206 1502,5697 Minerales no metálicos 46,66435514 57,73595644 67,993572 73,5326 94,4717 118,1891 135,4421 164,9694 175,8918 148,0201 251,6817 491,9676 722,265 720,3907 Sidero-metalúrgicos y joyería 264,8281982 242,4818125 222,382688 261,9541 391,1058 493,4225 828,8852 905,584 908,7844 570,9303 949,2935 1129,5879 1301,0628 1258,0765 Metal-mecánicos 96,57157387 160,0311662 109,553347 99,3665 136,1368 190,9167 164,4158 220,3668 327,7769 368,9264 393,0526 475,9115 545,3243 533,9824 Otros 28,80643712 35,80529532 32,927434 44,9479 57,9524 69,9459 89,226 107,3463 120,8574 93,6533 110,0259 147,0543 277,2908 156,0982 3. Otros 106,717569 112,6376918 89,179623 114,036089 131,4793424 141,0780871 90,57340557 114,4896998 190,4468465 154,2292713 254,2740503 303,7688422 344,8428785 237,5459333 % 1,53 1,60 1,16 1,25 1,03 0,81 0,38 0,41 0,61 0,57 0,71 0,66 0,74 0,56 4. TOTAL EXPORTACIONES 6954,909508 7025,729938 7713,9 9090,732707 12809,16941 17367,68427 23830,14724 28094,01913 31018,47963 27070,51964 35803,08081 46375,96157 46366,71294 42176,79529 Fuente: http://www.bcrp.gob.pe/estadisticas/cuadros-anuales-historicos.html Banco Central de Reserva del Perú Elaboración: Propia 35