1 mop sistema norte - sur febrero 2013 1. antecedentes generales
1 mop sistema norte - sur febrero 2013 1. antecedentes generales
1 mop sistema norte - sur febrero 2013 1. antecedentes generales

You also want an ePaper? Increase the reach of your titles
YUMPU automatically turns print PDFs into web optimized ePapers that Google loves.
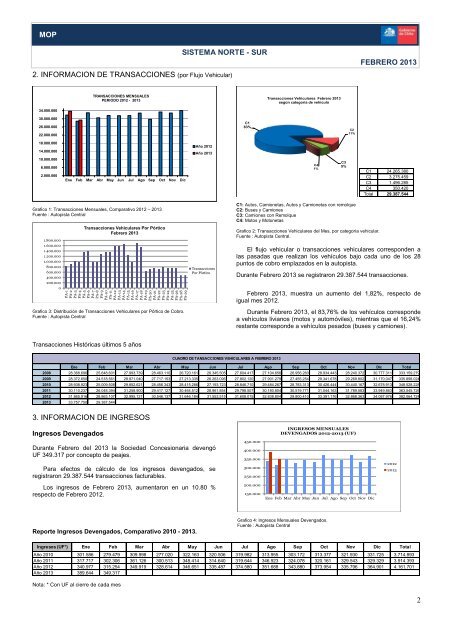
PA-1PA-2PA-3PA-4PA-5PA-6PA-7PA-8PA-9PA-10PA-11PA-12PA-13PA-14PA-15PA-16PA-17PA-18PA-19PA-20PA-21PA-22PA-23PA-24PA-25PA-26PA-28PA-29MOPSISTEMA NORTE - SURFEBRERO <strong>2013</strong>2. INFORMACION DE TRANSACCIONES (por Flujo Vehicular)TRANSACCIONES MENSUALESPERIODO 2012 - <strong>2013</strong>Transacciones Vehiculares Febrero <strong>2013</strong>según categoría de vehículo34.000.00030.000.00026.000.00022.000.000C183%C211%18.000.00014.000.000Año 2012Año <strong>2013</strong>10.000.0006.000.0002.000.000Ene Feb Mar Abr May Jun Jul Ago Sep Oct Nov DicC41%C35%C1 24.265.380C2 3.275.459C3 <strong>1.</strong>496.285C4 350.420Total 29.387.544Grafico 1: Transacciones Mensuales, Comparativo 2012 – <strong>2013</strong>Fuente : Autopista Central<strong>1.</strong>800.000<strong>1.</strong>600.000<strong>1.</strong>400.000<strong>1.</strong>200.000<strong>1.</strong>000.000800.000600.000400.000200.0000Transacciones Vehiculares Por PórticoFebrero <strong>2013</strong>Grafico 3: Distribución de Transacciones Vehiculares por Pórtico de Cobro.Fuente : Autopista CentralTransaccionesPor PórticoC1: Autos, Camionetas, Autos y Camionetas con remolqueC2: Buses y CamionesC3: Camiones con RemolqueC4: Motos y MotonetasGrafico 2: Transacciones Vehiculares del Mes, por categoría vehicular.Fuente : Autopista Central.El flujo vehicular o transacciones vehiculares corresponden alas pasadas que realizan los vehículos bajo cada uno de los 28puntos de cobro emplazados en la autopista.Durante Febrero <strong>2013</strong> se registraron 29.387.544 transacciones.Febrero <strong>2013</strong>, muestra un aumento del 1,82%, respecto deigual mes 2012.Durante Febrero <strong>2013</strong>, el 83,76% de los vehículos correspondea vehículos livianos (motos y automóviles), mientras que el 16,24%restante corresponde a vehículos pesados (buses y camiones).Transacciones Históricas últimos 5 añosCUADRO DE TANSACCIONES VEHICULARES A FEBRERO <strong>2013</strong>Ene Feb Mar Abr May Jun Jul Ago Sep Oct Nov Dic Total2008 28.368.696 25.648.601 27.993.739 28.463.110 26.720.161 26.345.505 27.604.417 27.104.656 26.956.260 28.934.443 28.240.372 30.777.311 333.159.2792009 28.372.650 24.518.561 28.87<strong>1.</strong>040 27.717.153 27.213.335 26.263.096 27.802.120 27.90<strong>1.</strong>279 27.455.254 29.34<strong>1.</strong>678 29.269.802 3<strong>1.</strong>170.047 335.898.0242010 28.938.923 25.009.508 29.852.621 28.456.343 28.415.286 27.193.723 28.846.710 29.484.267 28.783.313 30.426.444 30.440.167 32.678.913 348.528.2282011 30.110.237 26.048.394 3<strong>1.</strong>258.900 29.417.127 30.464.512 28.96<strong>1.</strong>854 29.798.507 30.180.804 30.519.771 3<strong>1.</strong>044.163 3<strong>1.</strong>789.583 33.949.863 363.545.7262012 3<strong>1.</strong>865.916 28.863.107 32.995.121 30.546.137 3<strong>1.</strong>646.184 3<strong>1.</strong>553.515 3<strong>1.</strong>608.015 32.838.804 29.800.410 33.39<strong>1.</strong>176 32.868.363 34.087.976 382.064.724<strong>2013</strong> 33.757.750 29.387.5443. INFORMACION DE INGRESOSIngresos DevengadosINGRESOS MENSUALESDEVENGADOS 2012-<strong>2013</strong> (UF)Durante Febrero del <strong>2013</strong> la Sociedad Concesionaria devengóUF 349.317 por concepto de peajes.Para efectos de cálculo de los ingresos devengados, seregistraron 29.387.544 transacciones facturables.450.000400.000350.000300.000250.0002012<strong>2013</strong>Los ingresos de Febrero <strong>2013</strong>, aumentaron en un 10.80 %respecto de Febrero 2012.200.000150.000Ene Feb Mar Abr May Jun Jul Ago Sep Oct Nov DicReporte Ingresos Devengados, Comparativo 2010 - <strong>2013</strong>.Grafico 4: Ingresos Mensuales Devengados.Fuente : Autopista CentralIngresos (UF*) Ene Feb Mar Abr May Jun Jul Ago Sep Oct Nov Dic TotalAño 2010 30<strong>1.</strong>586 279.479 309.998 277.020 322.163 320.506 319.982 313.955 303.172 313.377 32<strong>1.</strong>930 33<strong>1.</strong>725 3.714.893Año 2011 317.717 302.306 36<strong>1.</strong>126 300.513 348.414 314.640 319.644 346.923 324.078 320.161 329.543 329.329 3.914.393Año 2012 340.977 315.254 349.919 328.614 346.651 335.487 374.580 35<strong>1.</strong>688 343.880 373.954 335.796 364.901 4.16<strong>1.</strong>701Año <strong>2013</strong> 389.644 349.317Nota: * Con UF al cierre de cada mes2