MATLAB & SIMULINK - Universidad Pontificia Comillas
MATLAB & SIMULINK - Universidad Pontificia Comillas
MATLAB & SIMULINK - Universidad Pontificia Comillas

You also want an ePaper? Increase the reach of your titles
YUMPU automatically turns print PDFs into web optimized ePapers that Google loves.
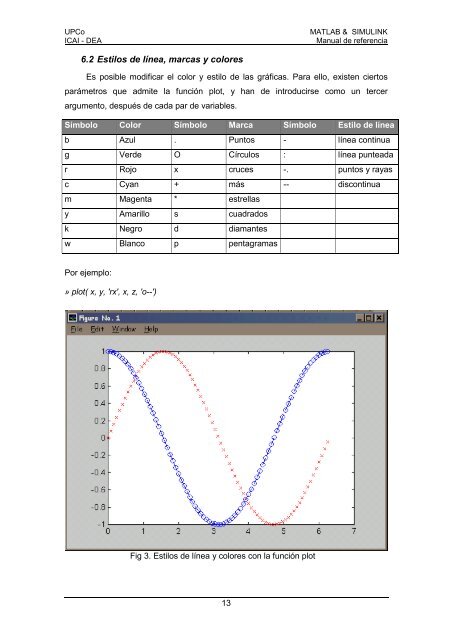
UPCoICAI - DEA<strong>MATLAB</strong> & <strong>SIMULINK</strong>Manual de referencia6.2 Estilos de línea, marcas y coloresEs posible modificar el color y estilo de las gráficas. Para ello, existen ciertosparámetros que admite la función plot, y han de introducirse como un tercerargumento, después de cada par de variables.Símbolo Color Símbolo Marca Símbolo Estilo de líneab Azul . Puntos - línea continuag Verde O Círculos : línea punteadar Rojo x cruces -. puntos y rayasc Cyan + más -- discontinuam Magenta * estrellasy Amarillo s cuadradosk Negro d diamantesw Blanco p pentagramasPor ejemplo:» plot( x, y, 'rx', x, z, 'o--')Fig 3. Estilos de línea y colores con la función plot13