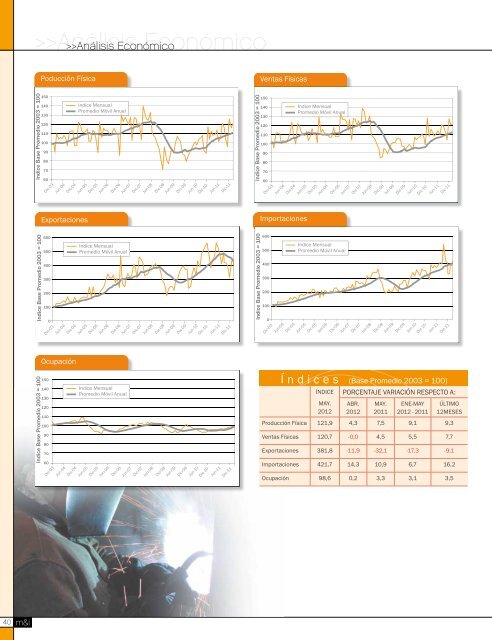
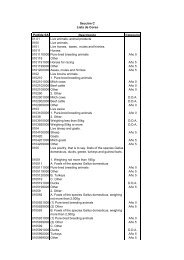
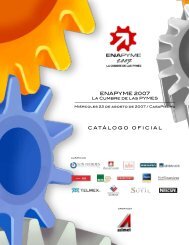
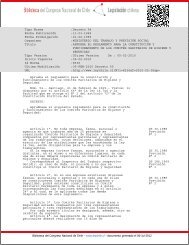
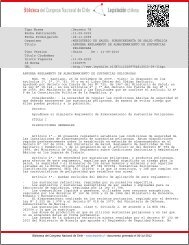
Análisis Económico EconómicoPoducción FísicaVentas FísicasIndice Base Promedio 2003 = 10015014013012011010090807060Dic-03Jun-04Dic-04Indice MensualPromedio Móvil AnualJun-05Dic-05Jun-06Dic-06Jun-07Dic-07Jun-08Dic-08Jun-09Dic-09Jun-10Dic-10Jun-11Dic-11Indice Base Promedio 2003 = 10015014013012011010090807060Dic-03Jun-04Dic-04Indice MensualPromedio Móvil AnualJun-05Dic-05Jun-06Dic-06Jun-07Dic-07Jun-08Dic-08Jun-09Dic-09Jun-10Dic-10Jun-11Dic-11ExportacionesImportacionesIndice Base Promedio 2003 = 1006005004003002001000Dic-03Jun-04Dic-04Indice MensualPromedio Móvil AnualJun-05Dic-05Jun-06Dic-06Jun-07Dic-07Jun-08Dic-08Jun-09Dic-09Jun-10Dic-10Jun-11Dic-11Indice Base Promedio 2003 = 1006005004003002001000Dic-03Jun-04Dic-04Indice MensualPromedio Móvil AnualJun-05Dic-05Jun-06Dic-06Jun-07Dic-07Jun-08Dic-08Jun-09Dic-09Jun-10Dic-10Jun-11Dic-11OcupaciónIndice Base Promedio 2003 = 10015014013012011010090807060Dic-03Jun-04Dic-04Indice MensualPromedio Móvil AnualJun-05Dic-05Jun-06Dic-06Jun-07Dic-07Jun-08Dic-08Jun-09Dic-09Jun-10Dic-10Jun-11Dic-11Í n d i c e s (Base Promedio 2003 = 100)ÍNDICEMAY.2012PORCENTAJE VARIACIÓN RESPECTO A:ABR.2012MAY.2011Ene-MAY2012 - 2011Último12MESESProducción Física 121,9 4,3 7,5 9,1 9,3Ventas Físicas 120,7 -0,0 4,5 5,5 7,7Exportaciones 381,8 -11,9 -32,1 -17,3 -9,1Importaciones 421,7 14,3 10,9 6,7 16,2Ocupación 98,6 0,2 3,3 3,1 3,540
Análisis >>Análisis EconómicoProducto Interno Bruto por Actividad Económica(Variaciones porcentuales respecto al mismo período del año anterior) (Base 2008)2004 2005 2006 2007 2008 2009 2010 2011 I trim. 2012Agropecuario-silvícola 11,3 14,0 12,6 3,1 6,0 -4,3 2,3 11,2 -2,7Pesca 22,5 0,2 -4,2 -1,1 15,4 -14,2 2,2 17,1 -6,5Minería 1,4 -5,4 1,3 2,8 -3,7 -1,0 1,1 -4,8 2,9Minería del cobre 1,0 -5,8 1,2 2,9 -3,7 -0,4 0,5 -6,0 3,3Otras actividades mineras 3,5 -0,0 2,6 0,6 -3,4 -8,1 7,3 9,5 -0,5Industria Manufacturera 6,1 4,9 5,4 2,4 1,6 -4,2 3,4 6,6 3,0Alimentos, bebidas y tabaco 4,4 4,2 4,2 2,2 2,6 -3,3 2,6 4,3 5,0Textil, prendas de vestir y cuero 10,9 7,4 9,8 -7,2 -9,7 1,1 10,4 -1,3 4,0Maderas y muebles 7,2 -1,4 -0,8 -17,0 -8,7 -23,6 9,5 7,0 -0,9Celulosa, papel e imprentas 12,2 -1,3 7,5 17,2 3,6 1,0 -6,3 10,1 3,4Química, petróleo, caucho y plástico 6,5 7,5 9,7 2,3 4,4 -4,8 3,5 6,9 -5,0Minerales no metálicos y metálica básica 7,7 5,4 1,8 -0,1 -7,5 -3,9 4,3 17,2 -0,4Productos metálicos, maquinaria, equipo y resto 0,9 9,2 1,4 8,0 6,6 -4,8 9,1 5,8 10,9Electricidad, gas y agua 4,7 6,3 8,0 -25,4 4,3 13,8 10,7 12,5 23,6Construcción 3,4 9,7 4,1 4,8 11,0 -5,3 1,7 11,1 9,5Comercio, restaurantes y hoteles 10,8 11,3 8,7 6,6 5,2 -5,8 16,1 11,7 8,2Transporte 2,9 4,2 5,1 4,1 0,0 -9,6 8,5 8,4 5,3Comunicaciones 9,6 7,1 5,2 11,7 11,2 5,4 9,2 6,9 6,0Servicios financieros y empresariales 13,7 13,3 9,2 13,4 6,7 1,5 7,0 8,5 8,7Servicios de vivienda 2,6 3,3 3,2 3,8 3,5 3,6 0,2 2,5 2,9Servicios personales 4,4 4,1 4,6 5,5 5,3 3,0 5,3 7,0 5,8Administración pública 2,4 4,8 3,8 4,2 0,3 6,6 2,8 0,9 5,6Impuesto al valor agregado 8,5 7,9 6,6 8,0 6,0 -2,2 12,3 8,6 4,1Derechos de Importación 24,1 21,8 10,5 32,4 10,0 -21,1 31,9 3,4 20,7Producto Interno Bruto 7,0 6,2 5,7 5,2 3,3 -1,0 6,1 6,0 5,6Año2008200<strong>92</strong>01020112012MesIPCIPP Industrial(referencial)variación en 12 mesesImacecBase promedio2008=100DólarObservadoPetróleoUS$/bbCobreUS$/libIndice Preciodel Acero1997=100enero 7,5% 97,1 480,90 96,2 320,28 181,63febrero 8,1% 93,9 467,22 95,7 357,78 199,77marzo 8,5% 103,6 442,94 104,9 382,80 220,68abril 8,3% 100,5 446,43 107,6 393,94 235,66mayo 8,9% 101,0 470,10 116,9 380,24 266,43junio 9,5% 100,1 493,61 130,3 374,69 280,35julio 9,5% 99,5 502,24 136,9 381,66 291,77agosto 9,3% 97,7 516,70 136,7 346,30 283,17septiembre 9,2% 98,5 530,17 118,1 317,10 268,02octubre 9,9% 103,2 618,39 <strong>92</strong>,3 223,43 238,93noviembre 8,9% 99,7 651,51 63,7 168,60 181,91diciembre 7,1% 105,3 649,32 49,4 139,34 154,27enero 6,3% 95,0 623,01 40,7 146,09 157,79febrero 5,5% 89,8 606,00 40,2 150,17 151,68marzo 5,0% 101,6 5<strong>92</strong>,93 40,6 170,09 140,44abril 4,5% 97,8 583,18 52,2 199,88 129,50mayo 3,0% 97,3 565,72 53,0 207,23 129,11junio 1,9% 96,7 553,08 62,0 227,43 133,60julio 0,3% 96,9 540,42 68,4 236,57 145,78agosto -1,0% 98,0 546,88 71,9 279,65 155,24septiembre -1,1% 99,0 549,07 72,9 281,07 158,44octubre -1,9% 103,0 545,83 72,7 285,22 153,95noviembre -2,3% 103,3 507,78 80,4 302,80 148,03diciembre -1,4% 109,1 501,45 77,2 315,86 149,06enero 0,1% 38,9% 98,8 500,66 81,6 335,04 158,87febrero 0,5% 35,0% 93,8 532,56 78,5 310,63 161,56marzo 0,2% 36,8% 101,8 523,16 81,6 338,51 173,57abril 0,9% 34,2% 104,4 520,62 83,0 351,31 194,85mayo 1,5% 25,3% 104,7 533,21 82,8 310,15 203,65junio 1,1% 16,8% 103,5 536,67 76,0 294,80 193,65julio 2,2% 17,3% 105,0 531,72 76,4 305,51 177,74agosto 2,5% 13,0% 106,2 509,32 82,0 330,40 174,11septiembre 1,9% 13,7% 105,3 493,93 76,8 349,69 179,48octubre 2,0% 17,2% 108,8 484,04 81,7 376,14 176,70noviembre 2,5% 17,6% 110,6 482,32 83,9 384,19 172,41diciembre 3,0% 20,2% 116,9 474,78 87,8 414,91 178,71enero 2,7% 20,6% 106,5 489,44 91,5 433,44 198,58febrero 2,7% 26,9% 100,5 475,69 <strong>92</strong>,8 447,59 219,28marzo 3,4% 18,5% 116,4 479,65 107,1 432,30 221,53abril 3,2% 15,0% 110,9 471,32 123,0 430,15 217,85mayo 3,3% 18,0% 112,2 467,73 120,5 404,<strong>92</strong> 211,04junio 3,4% 21,9% 109,1 469,41 123,2 410,29 207,08julio 2,9% 23,9% 108,6 462,94 108,1 436,32 202,83agosto 3,2% 15,0% 109,6 466,79 113,0 410,11 201,23septiembre 3,3% 7,3% 110,0 483,69 108,2 377,16 203,27octubre 3,7% -3,0% 112,0 511,74 115,8 333,28 198,78noviembre 3,9% -3,5% 114,6 508,44 116,3 342,54 189,76diciembre 4,4% -7,4% 125,0 517,17 118,8 343,26 185,69enero 4,2% -8,6% 112,1 501,34 113,6 364,85 191,03febrero 4,4% -8,4% 107,1 481,49 115,3 382,05 195,47marzo 3,8% -6,6% 122,3 485,40 122,0 383,61 195,78abril 3,5% -8,6% 116,2 486,00 127,9 374,65 197,33mayo 3,1% -6,5% 118,2 497,09 120,5 359,24 193,62junio 2,7% -10,8% 505,63 109,9 336,57 185,07Fuente Instituto Nacional de Estadísticas Banco Central de ChileBolsa de Metalesde LondresCruspi41