ANEXOS - Gobierno Regional de Loreto
ANEXOS - Gobierno Regional de Loreto
ANEXOS - Gobierno Regional de Loreto

Create successful ePaper yourself
Turn your PDF publications into a flip-book with our unique Google optimized e-Paper software.
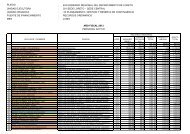
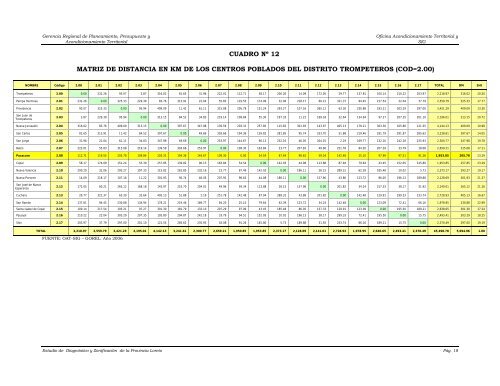
Gerencia <strong>Regional</strong> <strong>de</strong> Planeamiento, Presupuesto yAcondicionamiento TerritorialOficina Acondicionamiento Territorial ySIGCUADRO Nº 12MATRIZ DE DISTANCIA EN KM DE LOS CENTROS POBLADOS DEL DISTRITO TROMPETEROS (COD=2.00)NOMBRE Código 2.00 2.01 2.02 2.03 2.04 2.05 2.06 2.07 2.08 2.09 2.10 2.11 2.12 2.13 2.14 2.15 2.16 2.17 TOTAL DM SHITrompeteros 2.00 0.00 232.26 93.07 2.87 316.02 81.65 31.96 222.01 112.71 58.17 200.20 14.09 172.05 29.77 137.81 100.14 210.22 203.97 2,218.97 316.02 20.50Pampa Hermosa 2.01 232.26 0.00 325.33 229.39 83.76 313.91 22.04 55.83 119.55 174.09 32.06 218.17 60.21 321.37 94.45 217.54 22.04 37.79 2,559.79 325.33 17.77Provi<strong>de</strong>ncia 2.02 93.07 325.33 0.00 95.94 409.09 11.42 61.11 315.08 205.78 151.24 293.27 107.16 265.12 63.30 230.88 193.21 303.29 297.00 3,421.29 409.09 13.30San Juan <strong>de</strong>Trompeteros2.03 2.87 229.39 95.94 0.00 313.15 84.52 34.83 219.14 109.84 55.30 197.33 11.22 169.18 32.64 134.94 97.27 207.35 201.10 2,196.01 313.15 20.72Nueva Jerusalén 2.04 316.02 83.76 409.09 313.15 0.00 397.67 347.98 139.59 203.31 257.85 115.82 301.93 143.97 405.13 178.21 303.30 105.80 121.55 4,144.13 409.09 10.98San Carlos 2.05 81.65 313.91 11.42 84.52 397.67 0.00 49.69 303.66 194.36 139.82 281.85 95.74 253.70 51.88 219.46 181.79 291.87 285.62 3,238.61 397.67 14.05San Jorge 2.06 31.96 22.04 61.11 34.83 347.98 49.69 0.00 253.97 144.67 90.13 232.16 46.05 204.01 2.19 169.77 132.10 242.18 235.93 2,300.77 347.98 19.78Belén 2.07 222.01 55.83 315.08 219.14 139.59 303.66 253.97 0.00 109.30 163.84 23.77 207.92 49.96 251.78 84.20 207.29 33.79 18.08 2,659.21 315.08 17.11Pucacuro 2.08 112.71 119.55 205.78 109.84 203.31 194.36 144.67 109.30 0.00 54.54 87.49 98.62 59.34 142.48 25.10 97.99 97.51 91.26 1,953.85 205.78 23.29Copal 2.09 58.17 174.09 151.24 55.30 257.85 139.82 90.13 163.84 54.54 0.00 142.03 44.08 113.88 87.94 79.64 43.45 152.05 145.80 1,953.85 257.85 23.29Nueva Valencia 2.10 200.20 32.06 293.27 197.33 115.82 281.85 232.16 23.77 87.49 142.03 0.00 186.11 28.15 289.31 62.39 185.48 10.02 5.73 2,373.17 293.27 19.17Nuevo Porvenir 2.11 14.09 218.17 107.16 11.22 301.93 95.74 46.05 207.92 98.62 44.08 186.11 0.00 157.96 43.86 123.72 86.05 196.13 189.88 2,128.69 301.93 21.37San José <strong>de</strong> NuevaEsperanza2.12 172.05 60.21 265.12 168.18 143.97 253.70 204.01 49.96 59.34 113.88 28.15 157.96 0.00 201.82 34.24 157.33 38.17 31.92 2,140.01 265.12 21.26Cuchara 2.13 29.77 321.37 63.30 32.64 405.13 51.88 2.19 251.78 142.48 87.94 289.31 43.86 201.82 0.00 142.48 129.91 299.33 233.74 2,728.93 405.13 16.67San Ramón 2.14 137.81 94.45 230.88 134.94 178.21 219.46 169.77 84.20 25.10 79.64 62.39 123.72 34.24 142.48 0.00 123.09 72.41 66.16 1,978.95 230.88 22.99Santa Isabel <strong>de</strong> Copal 2.15 100.14 217.54 193.21 97.27 301.30 181.79 132.10 207.29 97.99 43.45 185.48 86.05 157.33 129.91 123.09 0.00 195.50 189.21 2,638.65 301.30 17.24Pijuayal 2.16 210.22 22.04 303.29 207.35 105.80 294.87 242.18 33.79 94.51 152.05 10.02 196.13 38.17 299.33 72.41 195.50 0.00 15.75 2,493.41 303.29 18.25Sión 2.17 203.97 37.79 297.00 201.10 121.55 285.62 235.93 18.08 91.26 145.80 5.73 189.88 31.92 233.74 66.16 189.21 15.75 0.00 2,370.49 297.00 19.19TOTAL 2,218.97 2,559.79 3,421.29 2,195.01 4,142.13 3,241.61 2,300.77 2,659.21 1,950.85 1,953.85 2,373.17 2,128.69 2,141.01 2,728.93 1,978.95 2,640.65 2,493.41 2,370.49 45,498.78 5,694.96 1.00FUENTE: OAT-SIG – GOREL. Año 2006Estudio <strong>de</strong> Diagnóstico y Zonificación <strong>de</strong> la Provincia <strong>Loreto</strong> Pág. 18