ANEXOS - Gobierno Regional de Loreto
ANEXOS - Gobierno Regional de Loreto
ANEXOS - Gobierno Regional de Loreto

Create successful ePaper yourself
Turn your PDF publications into a flip-book with our unique Google optimized e-Paper software.
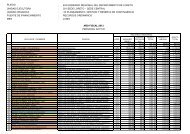
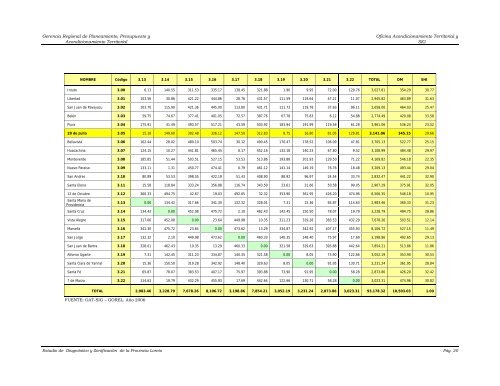
Gerencia <strong>Regional</strong> <strong>de</strong> Planeamiento, Presupuesto yAcondicionamiento TerritorialOficina Acondicionamiento Territorial ySIGNOMBRE Código 3.13 3.14 3.15 3.16 3.17 3.18 3.19 3.20 3.21 3.22 TOTAL DM SHIIntuto 3.00 6.13 140.55 311.53 335.17 138.45 321.88 1.90 9.95 72.00 120.76 3,027.81 354.20 30.77Libertad 3.01 103.56 30.86 421.22 444.86 28.76 431.57 111.59 119.64 47.21 11.07 2,945.82 463.89 31.63San Juan <strong>de</strong> Pavayacu 3.02 103.70 115.90 421.36 445.00 113.80 431.71 111.73 119.78 37.83 96.11 3,658.00 464.03 25.47Belén 3.03 59.75 74.67 377.41 401.05 72.57 387.76 67.78 75.83 6.12 54.88 2,774.49 420.08 33.58Piura 3.04 175.91 41.49 493.57 517.21 43.59 503.92 183.94 191.99 119.56 61.28 3,961.06 536.24 23.5228 <strong>de</strong> Julio 3.05 15.18 149.60 302.48 326.12 147.50 312.83 8.75 16.80 81.05 129.81 3,141.06 345.15 29.66Bellavista 3.06 162.44 28.02 480.10 503.74 30.12 490.45 170.47 178.52 106.09 47.81 3,705.13 522.77 25.15Huacachina 3.07 124.15 10.27 441.81 465.45 8.17 452.16 132.18 140.23 67.80 9.52 3,108.99 484.48 29.97Montever<strong>de</strong> 3.08 185.85 51.44 503.51 527.15 53.53 513.86 193.88 201.93 129.50 71.22 4,169.82 546.18 22.35Nuevo Paraiso 3.09 133.11 1.31 450.77 474.41 0.79 461.12 141.14 149.19 76.76 18.48 3,209.13 493.44 29.04San Andres 3.10 80.89 53.53 398.55 422.19 51.43 408.90 88.92 96.97 24.54 33.74 2,832.47 441.22 32.90Santa Elena 3.11 15.58 118.84 333.24 356.88 116.74 343.59 23.61 31.66 50.58 99.05 2,907.29 375.91 32.0512 <strong>de</strong> Octubre 3.12 360.33 494.75 42.67 19.03 492.65 32.32 353.90 361.95 426.20 474.96 8,506.35 546.18 10.95Santa Maria <strong>de</strong>Provi<strong>de</strong>ncia3.13 0.00 134.42 317.66 341.30 132.32 328.01 7.31 15.36 65.87 114.63 2,983.46 360.33 31.23Santa Cruz 3.14 134.42 0.00 452.08 475.72 2.10 462.43 142.45 150.50 78.07 19.79 3,228.79 494.75 28.86Vista Alegre 3.15 317.66 452.08 0.00 23.64 449.98 10.35 311.23 319.28 383.53 432.29 7,678.26 503.51 12.14Marsella 3.16 341.30 475.72 23.64 0.00 473.62 13.29 334.87 342.92 407.17 455.93 8,106.72 527.15 11.49San Jorge 3.17 132.32 2.10 449.98 473.62 0.00 460.33 140.35 148.40 75.97 17.69 3,198.86 492.65 29.13San Juan <strong>de</strong> Bartra 3.18 328.01 462.43 10.35 13.29 460.33 0.00 321.58 329.63 393.88 442.64 7,854.21 513.86 11.86Alfonso Ugarte 3.19 7.31 142.45 311.23 334.87 140.35 321.58 0.00 8.05 73.90 122.66 3,052.19 353.90 30.53Santa Clara <strong>de</strong> Yarinal 3.20 15.36 150.50 319.28 342.92 148.40 329.63 8.05 0.00 91.95 130.71 3,231.24 361.95 28.84Santa Fé 3.21 65.87 78.07 383.53 407.17 75.97 393.88 73.90 91.95 0.00 58.28 2,873.86 426.20 32.427 <strong>de</strong> Marzo 3.22 114.63 19.79 432.29 455.93 17.69 442.64 122.66 130.71 58.28 0.00 3,023.31 474.96 30.82TOTAL 2,983.46 3,228.79 7,678.26 8,106.72 3,198.86 7,854.21 3,052.19 3,231.24 2,873.86 3,023.31 93,178.32 10,503.03 1.00FUENTE: OAT-SIG – GOREL. Año 2006Estudio <strong>de</strong> Diagnóstico y Zonificación <strong>de</strong> la Provincia <strong>Loreto</strong> Pág. 20