CAPITULO 1 “EFECTO DE LA TEXTURA DEL SUELO Y DEL TIPO ...
CAPITULO 1 “EFECTO DE LA TEXTURA DEL SUELO Y DEL TIPO ...
CAPITULO 1 “EFECTO DE LA TEXTURA DEL SUELO Y DEL TIPO ...
Create successful ePaper yourself
Turn your PDF publications into a flip-book with our unique Google optimized e-Paper software.
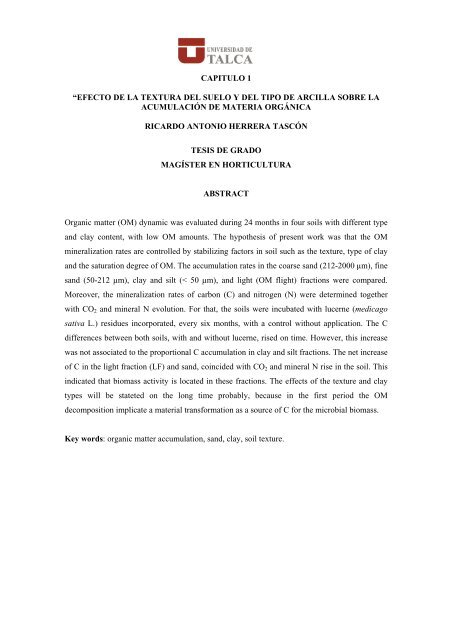
<strong>CAPITULO</strong> 1<strong>“EFECTO</strong> <strong>DE</strong> <strong>LA</strong> <strong>TEXTURA</strong> <strong>DE</strong>L <strong>SUELO</strong> Y <strong>DE</strong>L <strong>TIPO</strong> <strong>DE</strong> ARCIL<strong>LA</strong> SOBRE <strong>LA</strong>ACUMU<strong>LA</strong>CIÓN <strong>DE</strong> MATERIA ORGÁNICARICARDO ANTONIO HERRERA TASCÓNTESIS <strong>DE</strong> GRADOMAGÍSTER EN HORTICULTURAABSTRACTOrganic matter (OM) dynamic was evaluated during 24 months in four soils with different typeand clay content, with low OM amounts. The hypothesis of present work was that the OMmineralization rates are controlled by stabilizing factors in soil such as the texture, type of clayand the saturation degree of OM. The accumulation rates in the coarse sand (212-2000 µm), finesand (50-212 µm), clay and silt (< 50 µm), and light (OM flight) fractions were compared.Moreover, the mineralization rates of carbon (C) and nitrogen (N) were determined togetherwith CO 2 and mineral N evolution. For that, the soils were incubated with lucerne (medicagosativa L.) residues incorporated, every six months, with a control without application. The Cdifferences between both soils, with and without lucerne, rised on time. However, this increasewas not associated to the proportional C accumulation in clay and silt fractions. The net increaseof C in the light fraction (LF) and sand, coincided with CO 2 and mineral N rise in the soil. Thisindicated that biomass activity is located in these fractions. The effects of the texture and claytypes will be stateted on the long time probably, because in the first period the OMdecomposition implicate a material transformation as a source of C for the microbial biomass.Key words: organic matter accumulation, sand, clay, soil texture.
RESUMENSe evaluó la dinámica de la materia orgánica (MO) durante 24 meses en cuatro suelos condistinto tipo y contenido de arcilla, con bajas cantidades de MO. La hipótesis del presenteestudio fue que las tasas de mineralización de MO son controladas por los factoresestabilizadores del suelo como la textura, tipo de arcilla y el grado de saturación con MO. Secomparó las tasas de acumulación de MO en las fracciones de arena gruesa (212-2000 µm),arena fina (50-212 µm), arcilla y limo (< 50 µm), y liviana (MO ligera). Además, se determinólas tasas de mineralización de carbono (C) y nitrógeno (N) junto con la evolución de CO 2 y Nmineral del suelo. Para ello, los suelos fueron incubados con residuos de alfalfa (medicagosativa L.) incorporados cada seis meses, con un control sin aplicación. La diferencia de C entrelos suelos con y sin alfalfa, aumentó en el tiempo. Sin embargo, este aumento no estuvoasociado a una acumulación de C proporcional en las fracciones de arcilla y limo. Elincremento neto de C en la fracción liviana (FL) y de arena, coincidió con un aumento en lacantidad de CO 2 y N mineral del suelo, indicando que la actividad microbiana se localiza enestas fracciones. Es probable que los efectos de la textura y tipos de arcilla se manifiesten en ellargo plazo ya que en una primera etapa la descomposición de MO implica una transformacióndel material como fuente de C para la biomasa microbiana.Palabras claves: acumulación de materia orgánica, arena, arcilla, textura del suelo.
<strong>CAPITULO</strong> 2“CALIBRACIÓN ABSOLUTA <strong>DE</strong> <strong>LA</strong> ENERGÍA DISIPADA EN AGUA PURA <strong>DE</strong>UNA SONDA <strong>DE</strong> ULTRASONIDO”ABSTRACTUltrasound equipment was calibrated to standardize and quantify the real energy disipated onpure water and to match the estimates with nominal energy indicated by the manufacturer. Todo so, about 250 g of water was put inside an isolated container previously heated with theprobe equipment, and the energy loss (H) on time, measured. Moreover, the heat capacity of thecontainer was determined. The power output (P c ) and the energy applied (E a ) for three relativesettings (27, 67 y 108 W) in the equipment were calculated. These were obtained measuring thetemperature rising in several time treatments: 60, 180, 300, 420, 540, 660 and 780 s. Eaincreased over the time, and the isolated capacity of the container determinates H in a greatextent. The correlation found were excellent (r 2 ≈ 1), and the P c variations tested werepractically similar to the maximum power indicated by the manufacturer. This pointed out thatthe container was sufficiently isolated and the effect of the external temperature variations wassmall. The calibration indicated, a variations in the energy supplied throughout the time oftreatment and the relative settings of control power and the operation time intervals. Therefore,only with controlled applications and knowing the dissipated energy is possible to make a totalsoil disruption reproducible.Key words: ultrasound equipment calibration, soil disruption, dissipated energy.
RESUMENSe calibró un equipo de ultrasonido para estandarizar y cuantificar la energía real disipada enagua pura y relacionarla con la indicada por el fabricante. Para ello se midió la pérdida deenergía (H) en el tiempo de 250 g de agua en un contenedor aislado, previamente calentada conla sonda del equipo. Además, se determinó la capacidad calorífica del contenedor. Se calculó lapotencia (P c ) y la energía aplicada (E a ) para tres posiciones relativas (27, 67 y 108 W) almáximo indicado en el equipo. Estas se obtuvieron midiendo el cambio de temperatura en eltiempo de 250 g de agua calentadas con la sonda, para las tres posiciones relativas y el valor deH para cada temperatura. E a aumentó en forma decreciente a través del tiempo, y la capacidadde aislamiento del contenedor determinó en gran medida H. Las correlaciones encontradasfueron excelentes (r 2 ≈ 1), y las variaciones de P c probadas fueron prácticamente constantes ypequeñas en relación a la máxima potencia informada por el fabricante. Esto indica que elaislamiento del contenedor fue suficiente y el efecto de la variación de la temperatura externafue bajo. La calibración indicó que la energía varía con el tiempo de tratamiento y con laposición relativa de los controles de potencia e intervalos de tiempo de operación. Entonces,solo con una aplicación controlada de una energía conocida, disipada a través de una cuidadosacalibración de la sonda, es posible realizar una disrupción total del suelo en forma reproducible.Palabras claves: calibración equipo ultrasonido, disrupción de un suelo, energía disipada.


