Create successful ePaper yourself
Turn your PDF publications into a flip-book with our unique Google optimized e-Paper software.
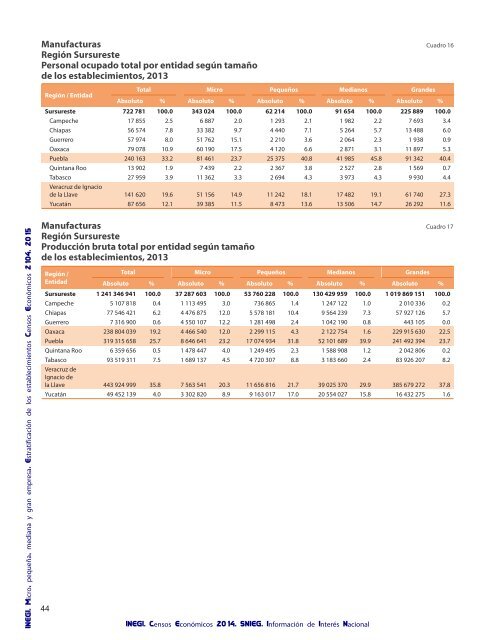
Manufacturas Cuadro 16<br />
Región Sursureste<br />
Personal ocupado total por entidad según tamaño<br />
de los establecimientos, 2013<br />
Región / Entidad<br />
Total <strong>Micro</strong> Pequeños Medianos Grandes<br />
Absoluto % Absoluto % Absoluto % Absoluto % Absoluto %<br />
Sursureste 722 781 100.0 343 024 100.0 62 214 100.0 91 654 100.0 225 889 100.0<br />
Campeche 17 855 2.5 6 887 2.0 1 293 2.1 1 982 2.2 7 693 3.4<br />
Chiapas 56 574 7.8 33 382 9.7 4 440 7.1 5 264 5.7 13 488 6.0<br />
Guerrero 57 974 8.0 51 762 15.1 2 210 3.6 2 064 2.3 1 938 0.9<br />
Oaxaca 79 078 10.9 60 190 17.5 4 120 6.6 2 871 3.1 11 897 5.3<br />
Puebla 240 163 33.2 81 461 23.7 25 375 40.8 41 985 45.8 91 342 40.4<br />
Quintana Roo 13 902 1.9 7 439 2.2 2 367 3.8 2 527 2.8 1 569 0.7<br />
Tabasco 27 959 3.9 11 362 3.3 2 694 4.3 3 973 4.3 9 930 4.4<br />
Veracruz de Ignacio<br />
de la Llave 141 620 19.6 51 156 14.9 11 242 18.1 17 482 19.1 61 740 27.3<br />
Yucatán 87 656 12.1 39 385 11.5 8 473 13.6 13 506 14.7 26 292 11.6<br />
INEGI. <strong>Micro</strong>, <strong>pequeña</strong>, <strong>mediana</strong> y <strong>gran</strong> <strong>empresa</strong>. Estratificación de los establecimientos Censos Económicos 2104. 2015<br />
Manufacturas Cuadro 17<br />
Región Sursureste<br />
Producción bruta total por entidad según tamaño<br />
de los establecimientos, 2013<br />
Región /<br />
Entidad<br />
44<br />
Total <strong>Micro</strong> Pequeños Medianos Grandes<br />
Absoluto % Absoluto % Absoluto % Absoluto % Absoluto %<br />
Sursureste 1 241 346 941 100.0 37 287 603 100.0 53 760 228 100.0 130 429 959 100.0 1 019 869 151 100.0<br />
Campeche 5 107 818 0.4 1 113 495 3.0 736 865 1.4 1 247 122 1.0 2 010 336 0.2<br />
Chiapas 77 546 421 6.2 4 476 875 12.0 5 578 181 10.4 9 564 239 7.3 57 927 126 5.7<br />
Guerrero 7 316 900 0.6 4 550 107 12.2 1 281 498 2.4 1 042 190 0.8 443 105 0.0<br />
Oaxaca 238 804 039 19.2 4 466 540 12.0 2 299 115 4.3 2 122 754 1.6 229 915 630 22.5<br />
Puebla 319 315 658 25.7 8 646 641 23.2 17 074 934 31.8 52 101 689 39.9 241 492 394 23.7<br />
Quintana Roo 6 359 656 0.5 1 478 447 4.0 1 249 495 2.3 1 588 908 1.2 2 042 806 0.2<br />
Tabasco 93 519 311 7.5 1 689 137 4.5 4 720 307 8.8 3 183 660 2.4 83 926 207 8.2<br />
Veracruz de<br />
Ignacio de<br />
la Llave 443 924 999 35.8 7 563 541 20.3 11 656 816 21.7 39 025 370 29.9 385 679 272 37.8<br />
Yucatán 49 452 139 4.0 3 302 820 8.9 9 163 017 17.0 20 554 027 15.8 16 432 275 1.6<br />
INEGI. Censos Económicos 2014. SNIEG. Información de Interés Nacional


