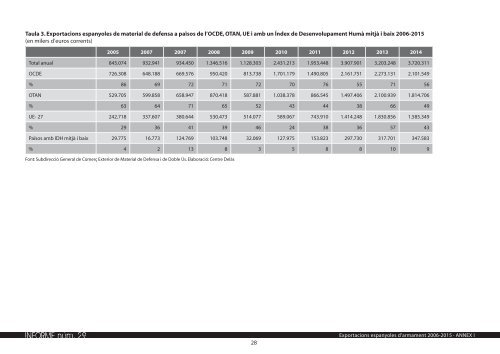
Taula 3. Exportacions espanyoles de material de defensa a països de l’OCDE, OTAN, UE i amb un Índex de Desenvolupament Humà mitjà i baix 2006-2015 (en milers d’euros corrents) 2005 2007 2007 2008 2009 2010 2011 2012 2013 2014 Total anual 845.074 932.941 934.450 1.346.516 1.128.303 2.431.213 1.953.448 3.907.901 3.203.248 3.720.311 OCDE 726.308 648.188 669.576 950.420 813.738 1.701.179 1.490.805 2.161.751 2.273.131 2.101.549 % 86 69 72 71 72 70 76 55 71 56 OTAN 529.705 599.858 658.947 870.418 587.881 1.038.378 866.545 1.497.406 2.100.939 1.814.706 % 63 64 71 65 52 43 44 38 66 49 UE- 27 242.718 337.607 380.644 530.473 514.077 589.067 743.910 1.414.248 1.830.856 1.585.349 % 29 36 41 39 46 24 38 36 57 43 Països amb IDH mitjà i baix 29.775 16.773 124.769 103.748 32.069 127.975 153.823 297.730 317.701 347.583 % 4 2 13 8 3 5 8 8 10 9 Font: Subdirecció General de Comerç Exterior de Material de Defensa i de Doble Ús. Elaboració: Centre Delàs <strong>INFORME</strong> núm. 29 28 Exportacions espanyoles d’armament 2006-2015 · ANNEX I
Taula 4. Exportacions espanyolas de productes i tecnologies de doble ús (en milers d’euros corrents) Països 2006 2007 2008 2009 2010 2011 2012 2013 2014 2015 2006-2015 1 EUA 48.966,67 58.651,18 37.213,78 4.268,15 4.868,04 15.259,20 91.415,96 7.434,55 30.838,30 22.891,94 321.807,77 2 Iran 2.162,30 24.896,17 61.953,31 38.983,60 39.222,24 16.775,94 31.041,97 21.515,53 26.446,01 14.118,86 277.115,92 3 República Xina 7.829,89 7.943,52 14.400,75 9.646,14 18.008,25 18.612,53 19.958,59 30.602,20 23.330,51 18.723,13 169.055,49 4 Brasil 3.150,30 6.841,54 6.758,84 2.944,86 7.861,34 10.607,48 4.599,20 7.393,31 5.010,15 16.319,81 71.486,83 5 Rússia 459,24 399,70 337,62 5.674,26 3.118,99 3.084,26 4.308,89 9.357,82 14.402,11 11.394,87 52.537,74 6 Veneçuela 2.640,53 3.026,37 4.105,15 4.308,25 4.872,39 3.249,57 6.129,93 5.099,09 9.270,78 1.566,70 44.268,77 7 Argentina 428,27 1.098,32 2.208,97 7.113,65 6.121,81 6.628,72 6.280,53 2.685,64 1.207,50 2.390,62 36.164,02 8 Turquia 1.638,54 559,39 922,01 888,30 4.844,74 12.254,41 5.027,50 7.494,10 635,07 34.264,07 9 Emirats Àrabs Unit 297,10 0,09 0,07 22,77 13,33 9,98 41,89 13.196,78 6.854,59 13.823,78 34.260,37 10 Cuba 4.201,41 2.470,95 2.410,91 3.069,58 2.799,30 2.717,03 4.304,59 2.440,39 1.820,43 295,34 26.529,93 11 Índia 6,10 1.153,57 380,33 1.533,44 1.214,60 1.779,36 32,09 1.997,77 978,41 16.370,75 25.446,42 12 Líbia 49,16 11.252,53 12.700,13 0,09 5,99 24.007,89 13 Aràbia Saudita 93,47 154,75 158,71 229,43 136,25 309,22 1.445,72 5.506,99 2.006,68 10.683,73 20.724,95 14 Suïssa 0,01 19,23 359,99 837,73 1.106,26 1.314,80 1.750,70 11.264,39 2.203,85 18.856,94 15 Japó 80,73 617,58 153,16 0,75 420,73 2.711,91 69,90 209,10 5.973,26 8.191,29 18.428,40 16 França - 43,07 16.955,62 534,52 17.533,21 17 Mèxic 3.456,70 425,00 466,63 178,89 2,98 704,49 659,36 351,50 7.798,84 2.654,85 16.699,24 18 Israel 1.587,32 576,81 801,57 622,28 214,33 99,17 36,40 2.205,28 2.922,74 5.934,42 15.000,31 19 Canadà 5,45 216,46 46,70 1.033,42 24,88 64,09 10.146,22 1.529,50 13.066,71 20 Marroc 384,78 513,30 1.731,18 1.035,94 1.731,82 1.580,86 2.573,24 1.704,22 606,55 645,23 12.507,10 21 Turkemistan 6.161,00 2.861,64 188,58 9.211,22 22 Hong Kong - 472,78 1.830,87 2.131,60 2.530,09 1.510,06 189,95 8.665,34 23 Bielorússia - 8.134,00 8.134,00 24 Taiwan 0,95 82,99 2.047,01 102,39 172,17 559,32 3.635,46 296,83 298,23 442,97 7.638,31 25 Eslovènia - 7.516,42 7.516,42 26 Oman - 0,06 5.127,70 952,63 1,98 1.331,23 7.413,60 <strong>INFORME</strong> núm. 29 Exportacions espanyoles d’armament 2006-2015 · ANNEX I 29