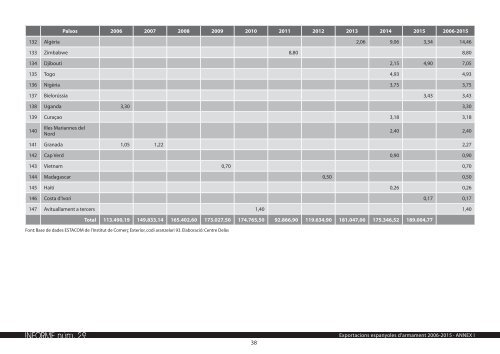
Països 2006 2007 2008 2009 2010 2011 2012 2013 2014 2015 2006-2015 132 Algèria 2,06 9,06 3,34 14,46 133 Zimbabwe 8,80 8,80 134 Djibouti 2,15 4,90 7,05 135 Togo 4,93 4,93 136 Nigèria 3,75 3,75 137 Bielorússia 3,43 3,43 138 Uganda 3,30 3,30 139 Curaçao 3,18 3,18 140 Illes Mariannes del Nord 2,40 2,40 141 Granada 1,05 1,22 2,27 142 Cap Verd 0,90 0,90 143 Vietnam 0,70 0,70 144 Madagascar 0,50 0,50 145 Haití 0,26 0,26 146 Costa d'Ivori 0,17 0,17 147 Avituallament a tercers 1,40 1,40 Total 113.490,19 149.833,14 165.402,60 173.027,50 174.765,50 92.866,90 119.634,90 181.047,06 175.346,52 189.004,77 Font: Base de dades ESTACOM de l’Institut de Comerç Exterior, codi aranzelari 93. Elaboració: Centre Delàs <strong>INFORME</strong> núm. 29 38 Exportacions espanyoles d’armament 2006-2015 · ANNEX I
Taula 6. Exportacions Espanyoles d’armes de caça i tir esportiu (en milers d’euros corrents) Països 2008 2009 2010 2011 2012 2013 2014 2015 2008-2015 1 EUA 5.795,05 9.892,06 4.098,80 6.718,28 6.388,97 19.592,01 18.933,37 2.946,48 74.365,01 2 Ghana 2.773,07 3.543,07 1.507,52 7.504,71 2.500,00 2.143,99 2.251,18 3.893,64 26.117,18 3 Turquía 1.912,99 3.217,83 3.420,84 1.881,70 2.229,59 2.029,32 2.564,70 1.773,29 19.030,26 4 Austràlia 710,32 1.381,15 1.563,65 2.434,73 1.673,33 1.468,06 1.857,39 2.624,49 13.713,12 5 Perú 1.102,44 1.424,32 2.320,31 1.468,37 1.688,79 2.246,36 1.391,41 1.757,70 13.399,69 6 Japó 1.129,47 1.095,93 869,06 1.250,86 1.463,28 1.645,74 1.406,56 1.474,94 10.335,84 7 Sud-àfrica 1.362,15 1.293,84 1.317,52 1.281,51 1.626,48 971,52 1.797,37 564,03 10.214,42 8 Ucraïna 1.850,43 1.223,16 728,54 1.056,15 1.612,15 1.608,64 1.164,53 864,85 10.108,45 9 Marroc 1.004,34 975,69 1.224,19 1.925,11 1.053,10 1.556,69 1.315,37 853,76 9.908,25 10 Camerun 212,68 247,24 630,56 1.108,99 1.241,65 1.353,78 1.361,44 1.610,38 7.766,71 11 Noruega 683,84 772,62 824,38 2.965,39 647,71 305,00 731,91 828,48 7.759,33 12 Rússia 1.227,06 987,26 441,18 1.085,31 963,43 797,44 1.043,75 921,73 7.467,14 13 Líban 348,12 1.087,24 1.524,03 643,26 627,51 899,36 762,77 1.090,99 6.983,28 14 Xile 431,43 322,81 540,96 1.433,73 959,10 1.140,11 1.095,86 904,68 6.828,66 15 Guinea Bissau 149,30 374,85 1.395,98 1.015,64 741,82 2.412,38 663,37 6.753,34 16 Mèxic 582,98 274,73 606,43 847,56 577,93 1.118,57 1.218,05 830,60 6.056,84 17 República de Guinea 1.827,96 4.135,09 5.963,05 18 Tunis 173,85 164,75 293,89 602,07 1.025,08 569,56 1.315,69 1.306,56 5.451,44 19 Nova Zelanda 508,12 222,11 491,66 754,96 482,54 595,88 337,85 1.069,63 4.462,74 20 Mali 231,79 356,68 534,97 3.143,78 111,07 4.378,29 21 Angola 257,70 208,54 373,08 368,55 479,50 961,29 305,00 932,87 3.886,53 22 Veneçuela 535,57 784,70 397,09 810,84 118,14 972,30 3.618,64 23 Argentina 126,81 739,44 639,73 573,21 458,88 260,21 172,05 630,68 3.601,01 24 Mauritània 509,36 208,84 69,86 362,66 512,83 668,90 654,06 2.986,51 25 Uruguai 291,09 165,08 337,58 734,20 334,99 386,00 437,61 104,27 2.790,82 26 Paraguai 223,11 99,33 334,08 349,14 352,20 771,48 118,00 527,68 2.775,03 <strong>INFORME</strong> núm. 29 Exportacions espanyoles d’armament 2006-2015 · ANNEX I 39