Téléchargez le rapport - About TELUS
Téléchargez le rapport - About TELUS
Téléchargez le rapport - About TELUS

Create successful ePaper yourself
Turn your PDF publications into a flip-book with our unique Google optimized e-Paper software.
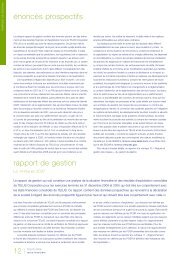
Statistiques opérationnel<strong>le</strong>s annuel<strong>le</strong>s<br />
Consolidé Après <strong>le</strong> passage aux IFRS 1 Avant <strong>le</strong> passage aux IFRS<br />
36 . RAPPORT ANNUEL 2012 <strong>TELUS</strong><br />
2012 2011 2010 2010 2009 2008 2007 2006<br />
Information tirée des tab<strong>le</strong>aux<br />
des flux de trésorerie<br />
Entrées liées aux activités opérationnel<strong>le</strong>s (en millions) 3 219ß$ 2 550ß$ 2 670ß$ 2 570ß$ 2 904ß$ 2 819ß$ 3 172ß$ 2 804ß$<br />
Sorties liées aux activités d’investissement (en millions)<br />
Entrées (sorties) liées aux activités<br />
(2 058) (1 968) (1 731) (1 731) (2 128) (3 433) (1 772) (1 675)<br />
de financement (en millions)<br />
Indicateurs de rendement<br />
(1 100) (553) (963) (863) (739) 598 (1 369) (1 149)<br />
Ratio de distribution2 Rendement des capitaux propres<br />
63 % 62 % 64 % 65 % 61 % 54 % 47 % 45 %<br />
attribuab<strong>le</strong>s aux actions ordinaires3 17,0 % 15,5 % 13,8 % 13,1 % 13,6 % 16,3 % 18,6 % 16,6 %<br />
Rendement de l’actif 4 Ratios d’endettement et de couverture<br />
15,7 % 12,8 % 13,6 % 13,1 % 15,1 % 14,8 % 18,8 % 17,0 %<br />
Ratio de couverture des intérêts par <strong>le</strong> BAIIA5 12,1 10,1 7,1 7,3 6,9 8,3 8,2 7,3<br />
Ratio dette nette/BAIIA6 1,6 1,8 1,8 1,8 2,0 1,9 1,7 1,7<br />
Dette nette/total des capitaux investis<br />
Autres mesures<br />
46,2 % 48,1 % 46,9 % 45,5 % 48,9 % 50,2 % 46,9 % 47,4 %<br />
Flux de trésorerie disponib<strong>le</strong>s (en millions) 7 1 331ß$ 997ß$ 939ß$ 947ß$ 485ß$ 361ß$ 1 388ß$ 1 443ß$<br />
Dépenses d’investissement (en millions)<br />
Paiement au titre des enchères<br />
1 981ß$ 1 847ß$ 1 721ß$ 1 721ß$ 2 103ß$ 1 859ß$ 1 770ß$ 1 618ß$<br />
de spectre du sans-fil (en millions) – – – – – 882ß$ – –<br />
Intensité des dépenses d’investissement 8 18 % 18 % 18 % 18 % 22 % 19 % 20 % 19 %<br />
Total des connexions clients (en milliers) 9 Information liée aux employés<br />
13 113 12 728 12 253 12 253 11 875 11 603 11 111 10 715<br />
Total des salaires et des avantages (en millions) 10 2 474ß$ 2 258ß$ 2 205ß$ 2 233ß$ 2 303ß$ 2 326ß$ 2 329ß$ 2 028ß$<br />
Total de l’effectif actif11 42 400 41 100 34 800 34 800 36 400 36 600 34 200 31 900<br />
Effectif en équiva<strong>le</strong>nt temps p<strong>le</strong>in (ETP) 41 400 40 100 33 900 33 900 35 300 35 900 33 400 31 100<br />
BAIIA par l’effectif en ETP moyen (en milliers) 12 101ß$ 102ß$ 109ß$ 109ß$ 106ß$ 111ß$ 117ß$ 126ß$<br />
Rendement des capitaux propres<br />
attribuab<strong>le</strong>s aux actions ordinaires (en pourcentage)<br />
12<br />
11<br />
10<br />
10<br />
09<br />
08<br />
07<br />
06<br />
avant <strong>le</strong> passage aux IFRS<br />
13,1<br />
13,8<br />
13,6<br />
15,5<br />
16,3<br />
17,0<br />
16,6<br />
18,6<br />
Flux de trésorerie disponib<strong>le</strong>s 7 (en millions de dollars)<br />
12<br />
11<br />
10<br />
10<br />
09<br />
08<br />
07<br />
06<br />
361<br />
485<br />
avant <strong>le</strong> passage aux IFRS<br />
939<br />
947<br />
997<br />
1 331<br />
1 388<br />
1 443
![DISK004:[98CLG6.98CLG3726]BA3726A.;28 - About TELUS](https://img.yumpu.com/16786670/1/190x245/disk00498clg698clg3726ba3726a28-about-telus.jpg?quality=85)