pdf 3 691 ko - Institut national de la statistique malgache (INSTAT)
pdf 3 691 ko - Institut national de la statistique malgache (INSTAT)
pdf 3 691 ko - Institut national de la statistique malgache (INSTAT)

Create successful ePaper yourself
Turn your PDF publications into a flip-book with our unique Google optimized e-Paper software.
<strong>Institut</strong> National <strong>de</strong> <strong>la</strong> Statistique<br />
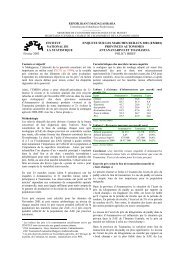
Tableau 67. Répartition selon <strong>la</strong> marque <strong>de</strong>s voitures immatriculées au cours<br />
<strong>de</strong>s trois premiers trimestres 2005<br />
Marque <strong>de</strong> moto<br />
Type <strong>de</strong> moto<br />
Mutation Neuf Occasion<br />
Unité : %<br />
MAK 0,0 21,8 3,1 20,4<br />
YAMAHA 37,0 16,2 36,7 17,6<br />
YAMALO 0,0 15,2 0,0 14,2<br />
HONDA 37,0 8,7 29,7 10,2<br />
KINLON 0,0 7,9 0,0 7,3<br />
LONCIN 0,0 5,4 0,0 5,0<br />
KTM 3,7 4,3 2,3 4,1<br />
EL MATADOR 0,0 3,6 0,0 3,4<br />
SUZUKI 7,4 2,6 6,3 2,8<br />
LEMURS 0,0 2,4 0,0 2,2<br />
UNISTAR 0,0 1,7 0,0 1,6<br />
PIAGGIO 3,7 1,2 2,3 1,3<br />
KAWASAKI 3,7 1,0 3,9 1,2<br />
Autres 7,4 8,1 15,6 8,5<br />
Source : <strong>INSTAT</strong>/DirTana<br />
Total<br />
Tableau 68. Répartition par genre <strong>de</strong>s véhicules immatriculés <strong>de</strong> 2004 à 2005<br />
Unité : %<br />
Genre<br />
2004 2005<br />
<strong>de</strong> véhicules 1er Trim 2 eme Trim 3 eme Trim 4 eme Trim 1 er Trim 2 eme Trim 3 eme Trim<br />
Véhicule à <strong>de</strong>ux roues 11,8 19,1 18,2 26,1 27,9 23,7 29,1<br />
Voiture particulière 34,6 26,0 30,8 28,9 25,6 27,4 28,0<br />
Camionnette 26,5 29,8 30,1 27,1 24,7 23,8 19,7<br />
Transport en commun 12,1 11,8 10,5 9,1 11,8 13,8 12,5<br />
Camion 9,1 9,3 7,3 6,8 6,8 7,8 7,7<br />
Tracteur routier 3,1 1,7 1,2 0,8 1,6 1,6 1,2<br />
Véhicule spécial 0,5 0,8 0,8 0,3 1,3 1,3 1,1<br />
Tracteur agricole 0,0 0,1 0,1 0,3 0,1 0,3 0,5<br />
Semi-remorque 2,1 1,4 1,0 0,3 0,2 0,2 0,2<br />
Remorque 0,3 0,2 0,2 0,3 0,0 0,1 0,1<br />
Total 100,0 100,0 100,0 100,0 100,0 100,0 100,0<br />
Source : <strong>INSTAT</strong>/DirTana<br />
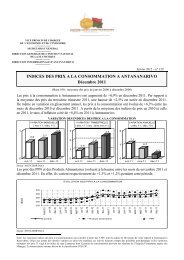
Tableau 69. Variation mensuelle <strong>de</strong>s indices <strong>de</strong>s prix à <strong>la</strong> consommation<br />
à Antananarivo <strong>de</strong> 2002 à 2005<br />
Unité : %<br />
Janv Févr Mars Avr Mai Juin Juil Août Sept Oct Nov Déc<br />
2002 1,7 0,6 -1,9 21,1 0,8 -1,4 -4,3 -1,8 0,1 0,0 -0,5 0,1<br />
2003 0,3 0,5 0,0 -1,5 -1,2 -1,6 -1,0 -0,2 0,3 0,2 1,6 1,5<br />
2004 0,7 0,0 2,2 2,7 1,1 2,2 3,0 1,7 2,3 1,7 2,7 1,7<br />
2005 1,9 1,6 -0,2 -1,5 -1,6 0,2 3,4 3,4 0,4<br />
Source : <strong>INSTAT</strong>/DirTana<br />
Journée Africaine <strong>de</strong> <strong>la</strong> Statistique 2005 42