Les principaux résultats - (CCI) de Montauban
Les principaux résultats - (CCI) de Montauban
Les principaux résultats - (CCI) de Montauban

Create successful ePaper yourself
Turn your PDF publications into a flip-book with our unique Google optimized e-Paper software.
Etu<strong>de</strong> sur les comportements<br />
d’achats <strong>de</strong>s ménages m<br />
sur le Tarn et Garonne<br />
Principaux <strong>résultats</strong>r<br />
– 8 Avril 2010
Contexte et objectifs <strong>de</strong> l’interventionl<br />
1- Contexte :<br />
Réaliser une enquête auprès d’un échantillon <strong>de</strong> ménages pour :<br />
Recueillir les lieux <strong>de</strong> consommation pour une liste <strong>de</strong> 39 produits <strong>de</strong><br />
consommation courante (flux)<br />
Recueillir <strong>de</strong>s éléments d’opinion<br />
2- Objectif :<br />
valorisation <strong>de</strong>s dépenses <strong>de</strong> consommation <strong>de</strong>s ménages<br />
i<strong>de</strong>ntification <strong>de</strong>s flux <strong>de</strong> consommation<br />
valorisation <strong>de</strong> l’activité marchan<strong>de</strong> du département<br />
- <strong>CCI</strong> Tarn et Garonne / Etu<strong>de</strong> sur les comportments d'achats / Principaux Résultats / Avril 2010 -<br />
2
Cher<br />
19%<br />
72%<br />
3% 5%<br />
1%<br />
Eure et Loir<br />
19%<br />
73%<br />
3% 4%<br />
1%<br />
Indre<br />
19%<br />
72%<br />
3%<br />
5%<br />
1%<br />
Indre et Loire<br />
20%<br />
71%<br />
4% 3%<br />
2%<br />
Loir et Cher<br />
20%<br />
70%<br />
3%<br />
5%<br />
2%<br />
Loiret<br />
19%<br />
74%<br />
2% 4%<br />
1%<br />
REGION CENTRE<br />
19%<br />
72%<br />
3% 4%<br />
2%<br />
0% 20% 40% 60% 80% 100%<br />
Commerce moins 300 m² Gran<strong>de</strong>s Surfaces CNS VAD Autres FV<br />
Culture<br />
loisirs<br />
12%<br />
Autres<br />
produits<br />
7%<br />
Eqt <strong>de</strong> la<br />
maison<br />
16%<br />
Eqt <strong>de</strong> la<br />
personne<br />
13%<br />
Alimentaire<br />
52%<br />
PREMIERE PARTIE :<br />
Éléments méthodologiquesm<br />
- <strong>CCI</strong> Tarn et Garonne / Etu<strong>de</strong> sur les comportments d'achats / Principaux Résultats / Avril 2010 -<br />
3
1. Périmètre d’étu<strong>de</strong><br />
Ariège<br />
Aveyron<br />
Millau<br />
Aveyron<br />
Ro<strong>de</strong>z<br />
Gers<br />
Haute<br />
Garonne<br />
Hautes<br />
Pyrénées<br />
Tarn<br />
Albi<br />
Tarn<br />
Castres<br />
Tarn et<br />
Garonne<br />
MIDI<br />
PYRENEES<br />
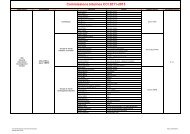
Nombre<br />
secteurs<br />
14<br />
12<br />
30 (+ 1<br />
limitrophe)<br />
26<br />
81<br />
21 (+ 1<br />
limitrophe)<br />
19<br />
19<br />
20 (+ 2<br />
limitrophes)<br />
242 + 4<br />
(limitrophes)<br />
- <strong>CCI</strong> Tarn et Garonne / Etu<strong>de</strong> sur les comportments d'achats / Principaux Résultats / Avril 2010 -<br />
4
2. Périmètre d’étu<strong>de</strong> : Zoom sur le Tarn et Garonne<br />
Le département du Tarn et Garonne a été découpé en 20 secteurs<br />
- <strong>CCI</strong> Tarn et Garonne / Etu<strong>de</strong> sur les comportments d'achats / Principaux Résultats / Avril 2010 -<br />
5
3. Echantillonnage, produits et mo<strong>de</strong> <strong>de</strong> recueil <strong>de</strong> l’information<br />
1- Échantillonnage :<br />
600 ménages du Tarn et Garonne ont été interrogés sur le lieu <strong>de</strong><br />
leur <strong>de</strong>rnier acte d’achat<br />
Échantillon représentatif au sens socio démographique sur<br />
chacun <strong>de</strong>s bassins <strong>de</strong> vie (taille du ménage, âge du chef <strong>de</strong><br />
famille, CSP du référent)<br />
2- Produits :<br />
Panel <strong>de</strong> 39 produits <strong>de</strong> consommation courante (8 alimentaires,<br />
30 non alimentaires et 1 activité <strong>de</strong> service)<br />
3- Mo<strong>de</strong> <strong>de</strong> recueil <strong>de</strong> l’information auprès <strong>de</strong>s ménages :<br />
Enquête téléphonique réalisée entre février et mai 2009<br />
Recueil <strong>de</strong>s déclarations <strong>de</strong> lieux <strong>de</strong> consommation pour chaque<br />
produit enquêté (17 877 actes d’achat soit 76% du potentiel)<br />
- <strong>CCI</strong> Tarn et Garonne / Etu<strong>de</strong> sur les comportments d'achats / Principaux Résultats / Avril 2010 -<br />
6
Cher<br />
19%<br />
72%<br />
3% 5%<br />
1%<br />
Eure et Loir<br />
19%<br />
73%<br />
3% 4%<br />
1%<br />
Indre<br />
19%<br />
72%<br />
3%<br />
5%<br />
1%<br />
Indre et Loire<br />
20%<br />
71%<br />
4% 3%<br />
2%<br />
Loir et Cher<br />
20%<br />
70%<br />
3%<br />
5%<br />
2%<br />
Loiret<br />
19%<br />
74%<br />
2% 4%<br />
1%<br />
REGION CENTRE<br />
19%<br />
72%<br />
3% 4%<br />
2%<br />
0% 20% 40% 60% 80% 100%<br />
Commerce moins 300 m² Gran<strong>de</strong>s Surfaces CNS VAD Autres FV<br />
Culture<br />
loisirs<br />
12%<br />
Autres<br />
produits<br />
7%<br />
Eqt <strong>de</strong> la<br />
maison<br />
16%<br />
Eqt <strong>de</strong> la<br />
personne<br />
13%<br />
Alimentaire<br />
52%<br />
DEUXIEME PARTIE :<br />
Analyse <strong>de</strong> la consommation<br />
et <strong>de</strong>s comportements d’achat d<br />
<strong>de</strong>s ménages m<br />
du Tarn et Garonne<br />
- <strong>CCI</strong> Tarn et Garonne / Etu<strong>de</strong> sur les comportments d'achats / Principaux Résultats / Avril 2010 -<br />
7
1. Évolution du nombre <strong>de</strong> ménages entre 1999 et 2009<br />
Nombre <strong>de</strong> ménages 2009 : 100 393<br />
Évolution du nombre <strong>de</strong> ménages sur la zone d’enquête : +22 % entre 1999 et 2009<br />
- <strong>CCI</strong> Tarn et Garonne / Etu<strong>de</strong> sur les comportments d'achats / Principaux Résultats / Avril 2010 -<br />
8
2. Marché <strong>de</strong> consommation annuel* moyen par ménage dans le Tarn<br />
et Garonne<br />
Tarn et<br />
Garonne<br />
Midi Pyrénées<br />
France<br />
Dépense<br />
alimentaire<br />
5 853 €<br />
5 724 €<br />
5 858 €<br />
Dépense totale<br />
non alimentaire<br />
6 792 €<br />
6 009 €<br />
6 889 €<br />
Dépense totale<br />
12 645 €<br />
12 624 €<br />
12 747 €<br />
* Base <strong>de</strong> calcul : la liste <strong>de</strong>s 38 produits enquêtés (hors produit pharmacie)<br />
- <strong>CCI</strong> Tarn et Garonne / Etu<strong>de</strong> sur les comportments d'achats / Principaux Résultats / Avril 2010 -<br />
9
3. Indices locaux <strong>de</strong> disparité <strong>de</strong> la consommation par secteur<br />
IDC moyen alimentaire : 100 IDC moyen non alimentaire : 98<br />
Source : ACFIC - IDC 2010<br />
- <strong>CCI</strong> Tarn et Garonne / Etu<strong>de</strong> sur les comportments d'achats / Principaux Résultats / Avril 2010 -<br />
10
4. Marché annuel <strong>de</strong> consommation* par département<br />
Tarn et Garonne<br />
8%<br />
Ariège<br />
6%<br />
857 M€<br />
1 537 M€<br />
Aveyron<br />
10%<br />
1 266 M€<br />
Dépense commercialisable<br />
totale 2009 : 15 274 M€<br />
Tarn<br />
14%<br />
2 074 M€<br />
1 285 M€<br />
7 251 M€<br />
Haute Garonne<br />
47%<br />
Haute Pyrénées<br />
8%<br />
1 004 M€<br />
Gers<br />
7%<br />
* Base <strong>de</strong> calcul : la liste <strong>de</strong>s 38 produits enquêtés (hors produit pharmacie)<br />
- <strong>CCI</strong> Tarn et Garonne / Etu<strong>de</strong> sur les comportments d'achats / Principaux Résultats / Avril 2010 -<br />
11
5. Marché annuel <strong>de</strong> consommation* 2009 par gran<strong>de</strong> famille <strong>de</strong><br />
produits sur le Tarn et Garonne<br />
Culture loisirs<br />
7%<br />
Hygiène,<br />
produits <strong>de</strong><br />
beauté<br />
7%<br />
83 M€<br />
Dépense commercialisable<br />
totale 2009 : 1 266 M€<br />
93 M€<br />
Eqt <strong>de</strong> la<br />
maison<br />
25%<br />
317 M€<br />
588 M€<br />
Alimentaire<br />
46%<br />
Famille <strong>de</strong> produits<br />
DC<br />
France<br />
185 M€<br />
Alimentaire<br />
Équipement <strong>de</strong> la personne<br />
Équipement <strong>de</strong> la maison<br />
46 %<br />
15 %<br />
24 %<br />
Eqt <strong>de</strong> la<br />
personne<br />
15%<br />
Hygiène produits <strong>de</strong> beauté<br />
Culture Loisirs<br />
* Base <strong>de</strong> calcul : la liste <strong>de</strong>s 38 produits enquêtés (hors produit pharmacie)<br />
- <strong>CCI</strong> Tarn et Garonne / Etu<strong>de</strong> sur les comportments d'achats / Principaux Résultats / Avril 2010 -<br />
7 %<br />
8 %<br />
12
6. Estimation <strong>de</strong> l’évasion 2009 par famille <strong>de</strong> produits<br />
Alimentaire<br />
92%<br />
8%<br />
Non Alimentaire<br />
82% 18%<br />
Equip. Personne<br />
78%<br />
22%<br />
Equip. Maison<br />
82%<br />
18%<br />
Culture, loisirs<br />
83%<br />
17%<br />
Hygiène produits <strong>de</strong> beauté<br />
89%<br />
11%<br />
0% 10% 20% 30% 40% 50% 60% 70% 80% 90% 100%<br />
Consommation sur le Tarn et Garonne<br />
Evasion<br />
Dépense commercialisable totale : 1 266 M€<br />
Évasion totale : 13 %, soit 168 M€<br />
- <strong>CCI</strong> Tarn et Garonne / Etu<strong>de</strong> sur les comportments d'achats / Principaux Résultats / Avril 2010 -<br />
13
7. Principales <strong>de</strong>stinations d’évasion non alimentaire en 2009<br />
Haute Garonne<br />
37 M€<br />
dont Toulouse<br />
14 M€<br />
dont Roques<br />
10 M€<br />
Vente à Distance<br />
37 M€<br />
dont Internet<br />
17 M€<br />
Lot et Garonne<br />
25 M€<br />
dont Agen<br />
15 M€<br />
En M€<br />
0 10 20 30 40<br />
Évasion non alimentaire : 123 M€<br />
- <strong>CCI</strong> Tarn et Garonne / Etu<strong>de</strong> sur les comportments d'achats / Principaux Résultats / Avril 2010 -<br />
14
Etu<strong>de</strong> sur les comportements<br />
d’achats <strong>de</strong>s ménages m<br />
sur le Tarn et Garonne<br />
Principaux <strong>résultats</strong>r<br />
– 8 Avril 2010