Industries Electriques, Electroniques et de l ... - Tunisie industrie
Industries Electriques, Electroniques et de l ... - Tunisie industrie
Industries Electriques, Electroniques et de l ... - Tunisie industrie

Create successful ePaper yourself
Turn your PDF publications into a flip-book with our unique Google optimized e-Paper software.
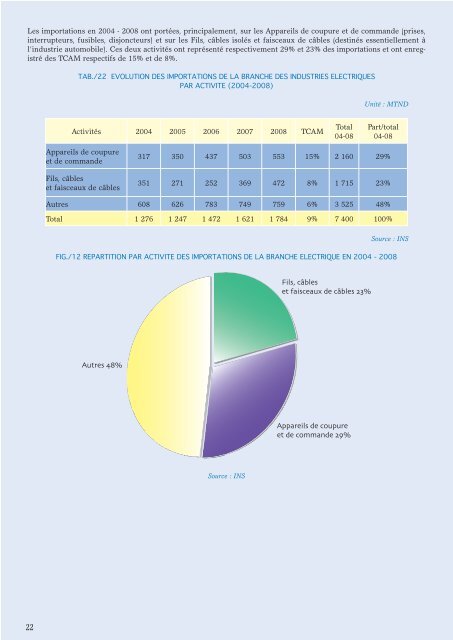
Les importations en 2004 - 2008 ont portées, principalement, sur les Appareils <strong>de</strong> coupure <strong>et</strong> <strong>de</strong> comman<strong>de</strong> (prises,<br />
interrupteurs, fusibles, disjoncteurs) <strong>et</strong> sur les Fils, câbles isolés <strong>et</strong> faisceaux <strong>de</strong> câbles (<strong>de</strong>stinés essentiellement à<br />
l’<strong>industrie</strong> automobile). Ces <strong>de</strong>ux activités ont représenté respectivement 29% <strong>et</strong> 23% <strong>de</strong>s importations <strong>et</strong> ont enregistré<br />
<strong>de</strong>s TCAM respectifs <strong>de</strong> 15% <strong>et</strong> <strong>de</strong> 8%.<br />
TAB./22 EVOLUTION DES IMPORTATIONS DE LA BRANCHE DES INDUSTRIES ELECTRIQUES<br />
PAR ACTIVITE (2004-2008)<br />
Unité : MTND<br />
Activités 2004 2005 2006 2007 2008 TCAM Total<br />
04-08<br />
Part/total<br />
04-08<br />
Appareils <strong>de</strong> coupure<br />
<strong>et</strong> <strong>de</strong> comman<strong>de</strong><br />
Fils, câbles<br />
<strong>et</strong> faisceaux <strong>de</strong> câbles<br />
317 350 437 503 553 15% 2 160 29%<br />
351 271 252 369 472 8% 1 715 23%<br />
Autres 608 626 783 749 759 6% 3 525 48%<br />
Total 1 276 1 247 1 472 1 621 1 784 9% 7 400 100%<br />
Source : INS<br />
FIG./12 REPARTITION PAR ACTIVITE DES IMPORTATIONS DE LA BRANCHE ELECTRIQUE EN 2004 - 2008<br />
Fils, câbles<br />
<strong>et</strong> faisceaux <strong>de</strong> câbles 23%<br />
Autres 48%<br />
Appareils <strong>de</strong> coupure<br />
<strong>et</strong> <strong>de</strong> comman<strong>de</strong> 29%<br />
Source : INS<br />
22