Les défis de l'urbanisation du monde - Euromedina
Les défis de l'urbanisation du monde - Euromedina
Les défis de l'urbanisation du monde - Euromedina

You also want an ePaper? Increase the reach of your titles
YUMPU automatically turns print PDFs into web optimized ePapers that Google loves.
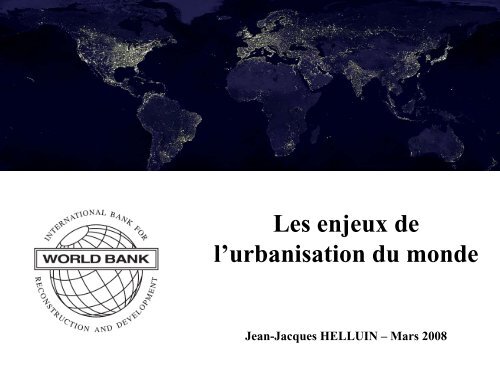
<strong>Les</strong> enjeux <strong>de</strong><br />
l’urbanisation <strong>du</strong> mon<strong>de</strong><br />
Jean-Jacques HELLUIN – Mars 2008
1 - L’urbanisation <strong>du</strong> mon<strong>de</strong>, un phénomène :<br />
- mal connu,<br />
- mal décrit, mal analysé<br />
- mal aimé…mais cela change peut- être <br />
2 - Un rapi<strong>de</strong> état <strong>de</strong>s lieux <strong>de</strong> l’urbanisation <strong>du</strong> mon<strong>de</strong><br />
- quelques données fondamentales<br />
- le défi majeur <strong>de</strong>s 40 prochaine années<br />
3 - L’urbanisation comme moteur <strong>de</strong> la croissance économique<br />
- urbanisation et croissance économique vont ensemble<br />
- les villes comme lieux <strong>de</strong> lutte contre la pauvreté<br />
4 – La croissance économique comme le moyen <strong>de</strong> rendre les villes <strong>du</strong>rables <br />
- villes et courbes <strong>de</strong> Kuznet environnementales : ça marche <br />
- une course-poursuite est engagée entre croissance <strong>de</strong>s revenus, croissance <strong>de</strong> la<br />
population urbaine, et croissance <strong>de</strong> l’espace consommé<br />
5 - Quelques débats (anciens et nouveaux) qui ne font que commencer ....<br />
- qui parle <strong>Les</strong> acteurs <strong>de</strong> l’urbain au niveau mondial<br />
- importance <strong>de</strong> l’ai<strong>de</strong> au <strong>de</strong>veloppement et d’une approche positive et systémique <strong>de</strong> la<br />
ville en développement<br />
- les défis <strong>de</strong>s infrastructures, <strong>de</strong> la forme urbaine, <strong>du</strong> changement climatique (le combat<br />
sera gagné – ou per<strong>du</strong> – dans les villes) et <strong>de</strong>s inégalités socio-spatiales<br />
Jean-Jacques HELLUIN - Mars 2008
1 - L’urbanisation <strong>du</strong> mon<strong>de</strong>, un<br />
phénomène :<br />
- mal connu,<br />
- mal décrit, mal analysé<br />
- mal aimé…mais cela change peut-être
Exemples <strong>de</strong> problèmes avec les<br />
données urbaines<br />
• Dans le rapport statistique 2006 <strong>de</strong>s Nations Unies, pour 20 pays Africains il n’y<br />
a pas eu <strong>de</strong> recensements <strong>de</strong>puis 1993<br />
• Confusions courantes dans les notions, par exemple entre urbanisation (taux<br />
et processus) et croissance urbaine (nombre absolu)<br />
• <strong>Les</strong> bases <strong>de</strong> données comparatives sur les villes au niveau mondial<br />
sont peu nombreuses et assez peu fiables (d’ou l’initiative en cours <strong>de</strong> la<br />
Banque Mondiale)<br />
• La difficulté fondamentale <strong>de</strong> la délimitation <strong>de</strong> la ville ou <strong>du</strong> fait urbain
Population <strong>de</strong>s gran<strong>de</strong>s villes : les erreurs <strong>de</strong> prévision <strong>de</strong> l’ONU<br />
35<br />
30<br />
2003<br />
pour<br />
2000<br />
Tokyo<br />
25<br />
20<br />
New-York<br />
15<br />
Sao Paulo<br />
Mexico<br />
10<br />
Dhaka<br />
Graphique : Helluin, 2008<br />
Données : UN 1973 – 2006 ;<br />
Sattherwaite, 2007<br />
5<br />
0<br />
1973 pour 2000<br />
0 5 10 15 20 25 30 35
Exemples <strong>de</strong> variabilité <strong>du</strong> nombre d’habitants <strong>de</strong>s villes en fonction <strong>de</strong> la<br />
définition utilisée
Une nouvelle approche / les données par grille <strong>du</strong> Earth Institute (Columbia Univ.)<br />
Source : Columbia University in the City of New York, 2005. Center for International Earth Science Information Network<br />
Grid<strong>de</strong>d Population of the World : http://beta.sedac.ciesin.columbia.e<strong>du</strong>/gpw/
Quelques idées fausses<br />
courantes sur l’urbanisation...<br />
- L’urbanisation serait la cause <strong>du</strong> sous-développement dans certains<br />
pays<br />
- <strong>Les</strong> politiques et stratégies urbaines seraient coûteuses et non<br />
pro<strong>du</strong>ctives<br />
- Il faut arrêter “l’exo<strong>de</strong> rural”, par tous les moyens (ex: permis d’habiter<br />
en ville)<br />
- <strong>Les</strong> politiques agricoles sont <strong>de</strong>s stratégies endogènes capables d’initier<br />
le processus <strong>de</strong> développement alors que les politiques urbaines sont<br />
exogènes et ne peuvent initier le développement<br />
- “Il est clair que l’échelle et la profon<strong>de</strong>ur <strong>de</strong> la pauvreté urbaine sont<br />
hautement sous-representees dans <strong>de</strong> nombreuses statistiques<br />
publiques et pour certains chercheurs – une <strong>de</strong>s raisons étant le<br />
mauvais usage <strong>de</strong>s seuils <strong>de</strong> pauvreté pour les populations urbaines”<br />
(Satterthwaite, David (2004), The Un<strong>de</strong>r-estimation of Urban Poverty in Low and Middle-Income<br />
Nations, IIED Working Paper 14 on Poverty Re<strong>du</strong>ction in Urban Areas, IIED, London, 69 pages.)
Poverty is becoming more urban over time (e.g. the urban share of the $1 a day poor is rising at<br />
about 0.6% points per year over 1993=2002, though these findings hold up less well for the $2<br />
day line.<br />
On the whole, urbanization has played a positive role in overall poverty re<strong>du</strong>ction by providing<br />
new opportunities to rural migrants and through second-round impacts of urbanization for those<br />
who remain in rural areas.<br />
Future projections indicate increases in urban poverty, but globally the majority of the poor will still<br />
be found rural areas for some <strong>de</strong>ca<strong>de</strong>s to come (~2040 for the $1 per day line, ~2080 for the $2<br />
per day line).<br />
Source : Ravallion, Chen, Sangraula. New Evi<strong>de</strong>nce on the Urbanization of Global Poverty . World Bank Policy Research Working<br />
Paper 4199, April 2007.
Le biais anti-urbain<br />
Dans les institutions internationales<br />
Chez les intellectuels<br />
Most influencal work on urban bias : Lipton, Michael (1977), Why<br />
Poor People Stay Poor – Urban Bias in World Development, Temple<br />
Smith,<br />
London. While the reality is more a “middle- and upper-income group,<br />
large-city bias” (Hardoy and Satterthwaite, 1989)
Le biais anti-urbain - 2<br />
Chez les planificateurs (texte <strong>de</strong> Bernard Marchand, WB 2007)<br />
Dans les écoles<br />
Paul Delouvrier, leading planner of the Paris Region<br />
ans les politiques publiques (Allaire , PhD, 2007, p. 102)
Mais <strong>de</strong> nouveaux discours commencent à se faire entendre…<br />
Stratégie urbaine <strong>de</strong><br />
la Banque Mondiale<br />
Affiche <strong>de</strong> Cities<br />
Alliance<br />
Africités 2006<br />
•« en Afrique Sub-Saharienne, les villes sont à l’origine <strong>de</strong> plus <strong>de</strong> 80 % <strong>de</strong> la<br />
croissance économique ; plus <strong>de</strong> 80 % <strong>de</strong>s créations d’emploi sont le fait <strong>du</strong> secteur<br />
informel ; et l’urbanisation est l’un <strong>de</strong>s principaux moteurs <strong>de</strong> la mo<strong>de</strong>rnisation <strong>de</strong><br />
l’agriculture et <strong>de</strong> la croissance <strong>de</strong>s revenus en milieu rural »<br />
Christine Kessi<strong>de</strong>s dans le rapport intitulé “The Contributions of Urban Development to Economic Growth and<br />
Poverty Re<strong>du</strong>ction in Sub-Saharan Africa”, (2004)
2 - Un rapi<strong>de</strong> état <strong>de</strong>s lieux <strong>de</strong><br />
l’urbanisation <strong>du</strong> mon<strong>de</strong>
Des faits sans précé<strong>de</strong>nts :<br />
• Le rythme d’urbanisation<br />
• La taille et le nombre <strong>de</strong>s gran<strong>de</strong>s villes<br />
• <strong>Les</strong> nations riches avaient la plupart <strong>de</strong> la<br />
population urbaine <strong>du</strong> Mon<strong>de</strong> –<br />
Maintenant c’est le contraire
Urban Rural Population Growth to 2030<br />
Low and Middle Income vs. High Income Countries<br />
Source: National Research Council. 2003. Cities Transformed: Demographic Change and Its<br />
Implications for the Developing World. Panel on Urban Population Dynamics, M.R.
Source : UN – World Urbanization Prospect: The 2005 revision population database<br />
With an annual urban growth rate of 1.8 per cent, nearly double that projected for the total population (1 per cent), the<br />
world’s urban population is expected to increase from 3.2 billion in 2005 to 4.9 billion in 2030, when 60 per cent of the<br />
global population is expected to live in urban areas.
Distribution of Urban Population Growth to 2015 by City Size<br />
Source :<br />
Annez, Huet, Peterson. World Bank 2007- Operational <strong>Les</strong>sons for the Urban Century: Urban Infrastructure Funds<br />
in World Bank Lending Operations 1979-2006
Source : UN – World Urbanization Prospect: The 2005 revision population database<br />
Average size of the world’s largest 100<br />
cities, 1800, 1850, 1900, 1950 and 2000
Source : David Satterthwaite, The transition to a predominantly urban world and its un<strong>de</strong>rpinnings. IIED, 2007
La croissance urbaine<br />
selon les régions <strong>du</strong><br />
mon<strong>de</strong><br />
ASIA<br />
Source : David Satterthwaite, The transition to a predominantly urban world<br />
and its un<strong>de</strong>rpinnings. IIED, 2007<br />
NORTH AMERICA<br />
AFRICA<br />
LATIN AMERICA<br />
EUROPE
3 - L’urbanisation comme<br />
moteur nécessaire <strong>de</strong> la<br />
croissance économique
Chine et In<strong>de</strong> : une forte croissance implique <strong>de</strong>s<br />
changements structurels<br />
Source : Commission on growth and <strong>de</strong>velopment 2008. www.growthcommission.org
Changes in the proportion of GDP from in<strong>du</strong>stry and services, of the labour force<br />
working in in<strong>du</strong>stry and services and of the population in urban areas, 1950–2005<br />
Low and middle income nations<br />
Data : World Bank, WDI
Pays à forte croissance…<br />
Source : Commission on growth and <strong>de</strong>velopment 2008. www.growthcommission.org<br />
Dans tous les pays à forte croissance (>7%) dans les<br />
15 <strong>de</strong>rnières années, la croissance vient <strong>de</strong>s villes
Source : Commission on growth and <strong>de</strong>velopment 2008. www.growthcommission.org<br />
Pour les pays à forte croissance, les gains <strong>de</strong><br />
pro<strong>du</strong>ctivité sont dans les villes<br />
-La pro<strong>du</strong>ctivité in<strong>du</strong>strielle surpasse <strong>de</strong> loin la pro<strong>du</strong>ctivité agricole<br />
- <strong>Les</strong> migrations <strong>du</strong> rural vers l’urbain sont excellentes pour la croissance
Differences in per capita GDP of<br />
metro regions<br />
And their national level (2002)<br />
Source : OECD Territorial Reviews: competitive cities<br />
in the global economy, 2006<br />
Note : OECD average refers to the average of OECD<br />
metro regions
Skills in Metro-regions and their<br />
national average (2001)<br />
Percentage differences of population<br />
with tertiary e<strong>du</strong>cation<br />
(sample of 56 metro regions)<br />
Source : OECD Territorial Reviews:<br />
competitive cities in the global economy, 2006
Source : OECD Territorial Reviews: competitive cities in the global economy, 2006<br />
There is a positive correlation between metro-regions’ size<br />
and income, especially when they concentrate over 20% of<br />
national GDP but this correlation becomes negative at around<br />
6-7 million, suggesting diseconomies of agglomeration <strong>du</strong>e to<br />
congestion and other related costs.
<strong>Les</strong> sans-emploi sont souvent concentrés dans les villes<br />
Source : European Union – Urban Audit 2004
4 – La croissance économique<br />
comme moyen <strong>de</strong> rendre les<br />
villes <strong>du</strong>rables
Environmental Kuznet Curve (EKC)<br />
Indicateur <strong>de</strong><br />
“Pollution”<br />
au sens<br />
général<br />
Temps<br />
Échelle<br />
spatiale<br />
Indicateur <strong>de</strong> richesse moyenne<br />
ex: PIB / habitant<br />
Une courbe influencée par : les prix, la technologie, les régulations<br />
Principales critiques : irréversibilités , externalités trans-frontières<br />
Graphique : JJ HELLUIN - 2008<br />
References:<br />
- Kahn, Matthew E. Green Cities – Urban growth and the environment – Brookings institution, 2006.<br />
- Hilton and Levinson, 1998
Source : Allaire, PhD 2007, page 121
Concentration annuelle moyenne en polluants (ug/m3)<br />
1987 2004<br />
Source :<br />
Global Environment Outlook – GeO4 - UNEP 2007
Source : European Union – Urban Audit Perception Survey – 2004<br />
300 min respon<strong>de</strong>nts per city (95% confi<strong>de</strong>nce interval between 2 to 5 %)
Seuil EKC<br />
Changement<br />
Climatique<br />
(20 k$ )<br />
Seuil EKC<br />
pour<br />
problèmes<br />
localisés<br />
(6 a 8 k$)
Une course poursuite est engagée entre :<br />
croissance <strong>de</strong>s revenus moyens,<br />
croissance <strong>de</strong> la population urbaine, et<br />
croissance <strong>de</strong> l’espace consommé
Marseille<br />
Lyon<br />
Paris
5 - Quelques défis et débats à<br />
venir ....
Qui parle <br />
<strong>Les</strong> acteurs <strong>de</strong> l’urbain au niveau<br />
mondial
Acteurs impliqués sur le thème Ville et changement climatique
L’importance <strong>de</strong> l’ai<strong>de</strong> au<br />
<strong>de</strong>veloppement<br />
et d’une approche positive et<br />
systémique <strong>de</strong> la ville en<br />
développement<br />
A – le défi <strong>de</strong>s infrastructures
L’importance <strong>de</strong> l’investissement dans les<br />
infrastructures urbaines :<br />
A condition d’etre fait avec un engagement massif sur<br />
plusieures décennies, c’est sans doute une condition<br />
indispensable pour que les villes <strong>du</strong> Sud parviennent<br />
(plus rapi<strong>de</strong>ment) au seuil <strong>de</strong>s EKC
Ai<strong>de</strong> au<br />
<strong>de</strong>veloppement<br />
par secteur<br />
Source : OCDE<br />
www.oecd.org/dac/stat<br />
s/dac/dcrannex.
B – le défi <strong>de</strong> la forme urbaine
Pourquoi influencer la structure spatiale d’une<br />
ville<br />
- transports<br />
- environnement<br />
- accès aux emplois par les pauvres<br />
Peut-on l’influencer <br />
Oui, via :<br />
-les régulations foncières (COS; taille <strong>de</strong> parcelle<br />
mini, UGB…) mais attention aux effets pervers<br />
- les investissements en infrastructures<br />
- la fiscalité
Une <strong>de</strong>s raisons pour lesquelles la<br />
forme compte...<br />
Distance<br />
moyenne au<br />
centre :<br />
Distance moyenne<br />
à <strong>de</strong>s points<br />
aléatoires<br />
3.00 Km 5.71km<br />
6.00 Km 7.28 Km<br />
5.09 Km 6.75 Km<br />
From Bertaud, 2004 : the spatial organization of cities: <strong>de</strong>liberate outcome or<br />
unforeseen consequence
Quand on laisse faire….
État <strong>de</strong>s lieux et enjeux<br />
<strong>de</strong> l’urbanisation <strong>du</strong> mon<strong>de</strong><br />
Accra, Ghana
Source :<br />
Global Environment Outlook – GeO4 - UNEP 2007
Pourtant d’autres<br />
modèles sont<br />
possibles….
Two hundred years of urban growth for the Baltimore-Washington region<br />
Red pixels <strong>de</strong>note urban land use as <strong>de</strong>fined by both the USGS and the<br />
Bureau of the Census<br />
Source : The Baltimore-Washington Regional Collaboratory Land-Use History Research Program by Timothy W. Foresman –<br />
biology.usgs.gov/luhna/chap5.html
From Bertaud, 2004 : the spatial organization of cities: <strong>de</strong>liberate outcome or unforeseen consequence
Mais attention aux erreurs<br />
dans l’intervention<br />
publique…
From : World Bank study – Alain Berthaud presentation, WB, March 2008
From : World Bank study – Alain Berthaud presentation, WB, March 2008
(Alain Berthaud on land markets)
Berthaud 2008 – FAR in Downtown Singapore varies between 2 to 25
C – le défi <strong>de</strong>s villes face au<br />
changement climatique
CLIMATE CHANGE : WE WILL WIN, OR LOOSE, IN THE CITIES<br />
Countries with highest urban population living in low elevation coastal zone (LECZ)<br />
l<br />
Urban Pop in LECZ<br />
90,000,000<br />
80,000,000<br />
70,000,000<br />
60,000,000<br />
50,000,000<br />
40,000,000<br />
30,000,000<br />
20,000,000<br />
10,000,000<br />
0<br />
China<br />
India<br />
Japan<br />
Indonesia<br />
United States of America<br />
Bangla<strong>de</strong>sh<br />
Viet Nam<br />
Thailand<br />
Egypt<br />
Netherlands<br />
Brazil<br />
Philippines<br />
United Kingdom<br />
Myanmar<br />
Nigeria<br />
Italy<br />
Argentina<br />
Germany<br />
Malaysia<br />
Mexico<br />
World :<br />
360 million people live in URBAN LECZ (6 % of the world population)<br />
274 million people live in RURAL LECZ (4.5 % of the world population)<br />
Graphic and calculation : JJ HELLUIN, 2007<br />
Data : Center for International Earth Science Information Network (CIESIN), Columbia University. Low Elevation Coastal Zone<br />
(LECZ) Urban-Rural Estimates, Global Rural-Urban Mapping Project (GRUMP), Alpha Version. Palisa<strong>de</strong>s, NY: Socioeconomic Data<br />
and Applications Center (SEDAC), Columbia University. Available at http://sedac.ciesin.columbia.e<strong>du</strong>/gpw/lecz. (downloa<strong>de</strong>d<br />
11/22/2007).
Graphic and calculation : JJ HELLUIN, 2007<br />
Data : Center for International Earth Science Information Network (CIESIN), Columbia University. Low Elevation Coastal Zone<br />
(LECZ) Urban-Rural Estimates, Global Rural-Urban Mapping Project (GRUMP), Alpha Version. Palisa<strong>de</strong>s, NY: Socioeconomic Data<br />
and Applications Center (SEDAC), Columbia University. Available at http://sedac.ciesin.columbia.e<strong>du</strong>/gpw/lecz. (downloa<strong>de</strong>d<br />
11/22/2007).<br />
Regions and their urban population living in low elevation coastal zone (LECZ)<br />
l<br />
Urban Pop in LECZ<br />
300,000,000<br />
250,000,000<br />
238,186,343<br />
200,000,000<br />
150,000,000<br />
100,000,000<br />
50,000,000<br />
0<br />
31,239,883<br />
2,546,549<br />
40,321,008<br />
22,833,999 21,401,771<br />
Africa Asia Australia<br />
and New<br />
Zealand<br />
Europe<br />
Latin<br />
America<br />
North<br />
America
MASDAR CITY : first zero-carbon, zero-waste city <br />
The initiative is hea<strong>de</strong>d by the Abu Dhabi Future Energy Company. Initiated<br />
in 2006, the project is estimated to take some 10 years to complete, with the<br />
first phase complete and habitable in 2009. The city will rely entirely on solar<br />
energy, with a sustainable, zero-carbon, zero-waste ecology. It will cost<br />
$US22 billion to build and be home to 50,000 people and 1,500<br />
businesses.The city is inten<strong>de</strong>d to cover six square kilometers, with no point<br />
further than 200 m from a public transport link, housing energy, science and<br />
technology communities. The city will cover 6 km² and inclu<strong>de</strong> housing,<br />
commercial areas, a university, and the headquarters of the Future Energy<br />
Company.
D – Le défi <strong>de</strong>s inégalités socio-spatiales intraurbaines<br />
et inter-urbaines<br />
• La croissance et la concentration <strong>de</strong>s activités s’accompagnent<br />
dans un premier temps d’inégalités intra-urbaines considérables<br />
Source :<br />
European<br />
Union –<br />
Urban Audit<br />
2004
• Mais aussi d’inégalités inter-urbaines entre villes <strong>du</strong> Nord qui<br />
franchissent le seuil <strong>de</strong>s EKC et villes <strong>du</strong> Sud qui pourraient ne<br />
jamais les franchir sans une ai<strong>de</strong> efficace
Power-Point complet téléchargeable sur<br />
www.urbanres.net<br />
Puis LIBRARY<br />
Puis Other FILES