

Lihat Isi - Badan Pusat Statistik
Lihat Isi - Badan Pusat Statistik
Lihat Isi - Badan Pusat Statistik
- No tags were found...

Create successful ePaper yourself
Turn your PDF publications into a flip-book with our unique Google optimized e-Paper software.
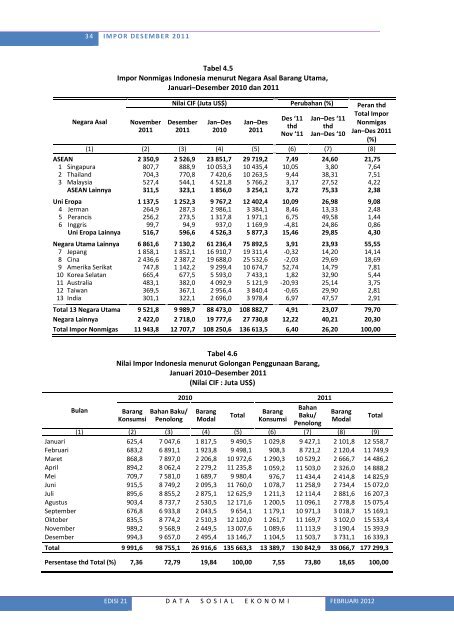
34 I M P O R D E S E M B E R 2 0 1 1Negara AsalTabel 4.5Impor Nonmigas Indonesia menurut Negara Asal Barang Utama,Januari–Desember 2010 dan 2011November2011Nilai CIF (Juta US$) Perubahan (%) Peran thdTotal ImporDes ‘11 Jan–Des ‘11Desember Jan–Des Jan–DesNonmigasthd thd2011 2010 2011Nov ‘11 Jan–Des ‘10Jan–Des 2011(%)(1) (2) (3) (4) (5) (6) (7) (8)ASEAN 2 350,9 2 526,9 23 851,7 29 719,2 7,49 24,60 21,751 Singapura 807,7 888,9 10 053,3 10 435,4 10,05 3,80 7,642 Thailand 704,3 770,8 7 420,6 10 263,5 9,44 38,31 7,513 Malaysia 527,4 544,1 4 521,8 5 766,2 3,17 27,52 4,22ASEAN Lainnya 311,5 323,1 1 856,0 3 254,1 3,72 75,33 2,38Uni Eropa 1 137,5 1 252,3 9 767,2 12 402,4 10,09 26,98 9,084 Jerman 264,9 287,3 2 986,1 3 384,1 8,46 13,33 2,485 Perancis 256,2 273,5 1 317,8 1 971,1 6,75 49,58 1,446 Inggris 99,7 94,9 937,0 1 169,9 -4,81 24,86 0,86Uni Eropa Lainnya 516,7 596,6 4 526,3 5 877,3 15,46 29,85 4,30Negara Utama Lainnya 6 861,6 7 130,2 61 236,4 75 892,5 3,91 23,93 55,557 Jepang 1 858,1 1 852,1 16 910,7 19 311,4 -0,32 14,20 14,148 Cina 2 436,6 2 387,2 19 688,0 25 532,6 -2,03 29,69 18,699 Amerika Serikat 747,8 1 142,2 9 299,4 10 674,7 52,74 14,79 7,8110 Korea Selatan 665,4 677,5 5 593,0 7 433,1 1,82 32,90 5,4411 Australia 483,1 382,0 4 092,9 5 121,9 -20,93 25,14 3,7512 Taiwan 369,5 367,1 2 956,4 3 840,4 -0,65 29,90 2,8113 India 301,1 322,1 2 696,0 3 978,4 6,97 47,57 2,91Total 13 Negara Utama 9 521,8 9 989,7 88 473,0 108 882,7 4,91 23,07 79,70Negara Lainnya 2 422,0 2 718,0 19 777,6 27 730,8 12,22 40,21 20,30Total Impor Nonmigas 11 943,8 12 707,7 108 250,6 136 613,5 6,40 26,20 100,00BulanTabel 4.6Nilai Impor Indonesia menurut Golongan Penggunaan Barang,Januari 2010–Desember 2011(Nilai CIF : Juta US$)Barang Bahan Baku/Konsumsi Penolong2010 2011BahanBarangBarangTotalBaku/ModalKonsumsiPenolongBarangModal(1) (2) (3) (4) (5) (6) (7) (8) (9)Januari 625,4 7 047,6 1 817,5 9 490,5 1 029,8 9 427,1 2 101,8 12 558,7Februari 683,2 6 891,1 1 923,8 9 498,1 908,3 8 721,2 2 120,4 11 749,9Maret 868,8 7 897,0 2 206,8 10 972,6 1 290,3 10 529,2 2 666,7 14 486,2April 894,2 8 062,4 2 279,2 11 235,8 1 059,2 11 503,0 2 326,0 14 888,2Mei 709,7 7 581,0 1 689,7 9 980,4 976,7 11 434,4 2 414,8 14 825,9Juni 915,5 8 749,2 2 095,3 11 760,0 1 078,7 11 258,9 2 734,4 15 072,0Juli 895,6 8 855,2 2 875,1 12 625,9 1 211,3 12 114,4 2 881,6 16 207,3Agustus 903,4 8 737,7 2 530,5 12 171,6 1 200,5 11 096,1 2 778,8 15 075,4September 676,8 6 933,8 2 043,5 9 654,1 1 179,1 10 971,3 3 018,7 15 169,1Oktober 835,5 8 774,2 2 510,3 12 120,0 1 261,7 11 169,7 3 102,0 15 533,4November 989,2 9 568,9 2 449,5 13 007,6 1 089,6 11 113,9 3 190,4 15 393,9Desember 994,3 9 657,0 2 495,4 13 146,7 1 104,5 11 503,7 3 731,1 16 339,3Total 9 991,6 98 755,1 26 916,6 135 663,3 13 389,7 130 842,9 33 066,7 177 299,3Persentase thd Total (%) 7,36 72,79 19,84 100,00 7,55 73,80 18,65 100,00TotalEDISI 21 D A T A S O S I A L E K O N O M I FEBRUARI 2012


